| Param | Original file | Final file |
|---|---|---|
| Filename | modeM0/AS1T03_189T01_9000003614_24617cztM0_level2.evt | modeM0/AS1T03_189T01_9000003614_24617cztM0_level2_quad_clean.evt |
| Size (bytes) | 470,736,000 | 70,536,960 |
| Size | 448.9 MB | 67.3 MB |
| Events in quadrant A | 3,356,489 | 428,137 |
| Events in quadrant B | 3,526,612 | 429,712 |
| Events in quadrant C | 3,356,251 | 408,741 |
| Events in quadrant D | 3,564,785 | 405,211 |
| Mode M9 | |||
|---|---|---|---|
| Quadrant | BADHDUFLAG | Total packets | Discarded packets |
| A | 0 | 14 | 0 |
| B | 0 | 15 | 0 |
| C | 0 | 15 | 0 |
| D | 0 | 15 | 0 |
| Mode M0 | |||
|---|---|---|---|
| Quadrant | BADHDUFLAG | Total packets | Discarded packets |
| A | 0 | 14021 | 2 |
| B | 0 | 14507 | 2 |
| C | 0 | 13969 | 2 |
| D | 0 | 14844 | 2 |
| Mode SS | |||
|---|---|---|---|
| Quadrant | BADHDUFLAG | Total packets | Discarded packets |
| A | 0 | 136 | 0 |
| B | 0 | 136 | 0 |
| C | 0 | 136 | 0 |
| D | 0 | 136 | 0 |
| Quadrant | Total seconds | Saturated seconds | Saturation percentage |
|---|---|---|---|
| A | 6651 | 88 | 1.323109% |
| B | 6651 | 141 | 2.119982% |
| C | 6651 | 119 | 1.789205% |
| D | 6651 | 74 | 1.112615% |
Noise dominated data is calculated using 1-second bins in cleaned event files. If a bin has >2000 counts, and if more than 50% of those come from <1% of pixels, then it is considered to be noise-dominated and hence unusable.
| Quadrant | # 1 sec bins | Bins with >0 counts | Bins with >2000 counts | High rate bins dominated by noise | Noise dominated (total time) | Noise dominated (detector-on time) | Marked lightcurve |
|---|---|---|---|---|---|---|---|
| A | 7696 | 6651 | 0 | 0 | 0.00% | 0.00% | 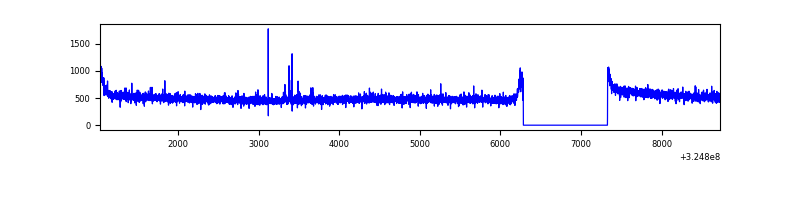 |
| B | 7696 | 6651 | 28 | 28 | 0.36% | 0.42% | 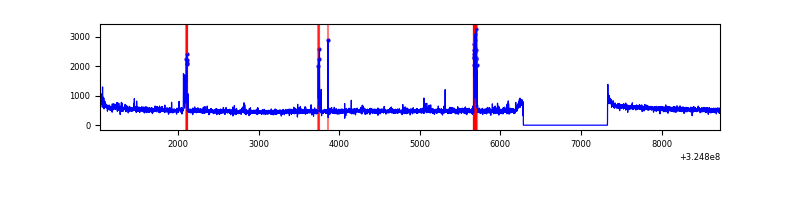 |
| C | 7696 | 6652 | 1 | 1 | 0.01% | 0.02% |  |
| D | 7696 | 6651 | 2 | 2 | 0.03% | 0.03% | 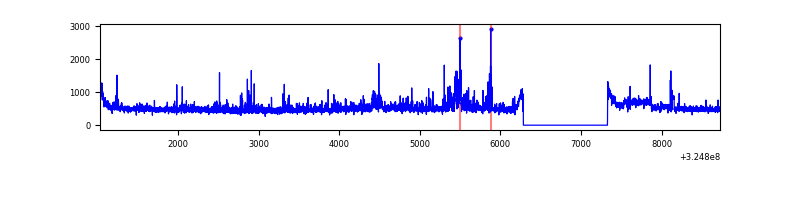 |
Top three noisy pixels from each quadrant. If the there are fewer than three noisy pixels in the level2.evt file, extra rows are filled as -1
| Pixel properties | Quadrant properties | ||||||
|---|---|---|---|---|---|---|---|
| Quadrant | DetID | PixID | Counts | Sigma | Mean | Median | Sigma |
| A | 12 | 96 | 11099 | 59.06 | 867 | 851 | 173.5 |
| A | 13 | 254 | 10098 | 53.29 | 867 | 851 | 173.5 |
| A | 3 | 137 | 7883 | 40.52 | 867 | 851 | 173.5 |
| B | 3 | 64 | 90813 | 546.27 | 854 | 832 | 164.7 |
| B | 0 | 245 | 62129 | 372.13 | 854 | 832 | 164.7 |
| B | 7 | 202 | 28713 | 169.26 | 854 | 832 | 164.7 |
| C | 14 | 238 | 131759 | 692.03 | 816 | 822 | 189.2 |
| C | 5 | 112 | 16151 | 81.02 | 816 | 822 | 189.2 |
| C | 7 | 247 | 10647 | 51.93 | 816 | 822 | 189.2 |
| D | 1 | 52 | 200475 | 998.62 | 830 | 806 | 199.9 |
| D | 8 | 195 | 172819 | 860.3 | 830 | 806 | 199.9 |
| D | 7 | 238 | 37961 | 185.83 | 830 | 806 | 199.9 |
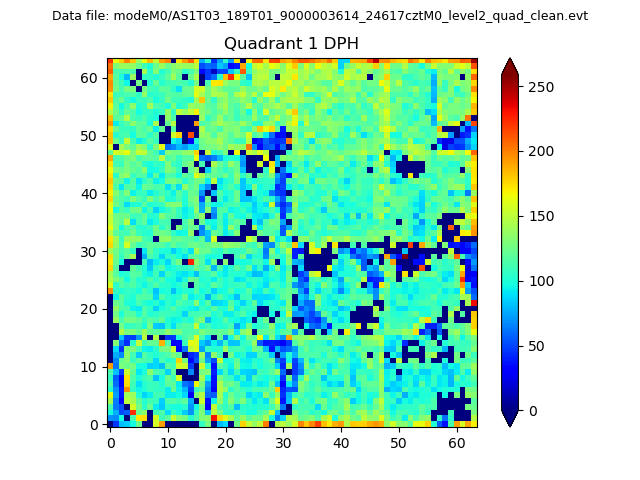
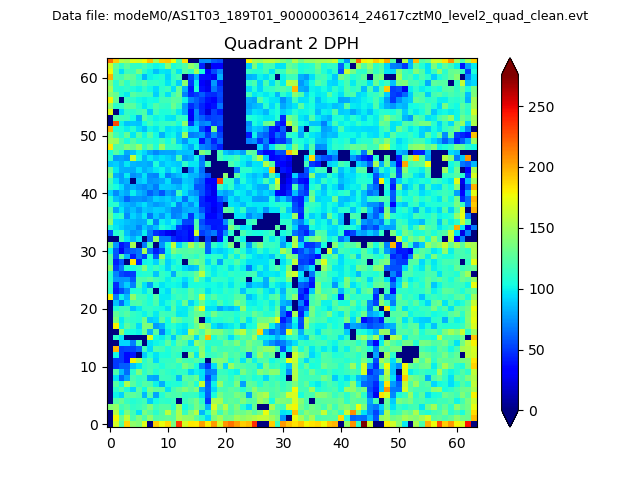
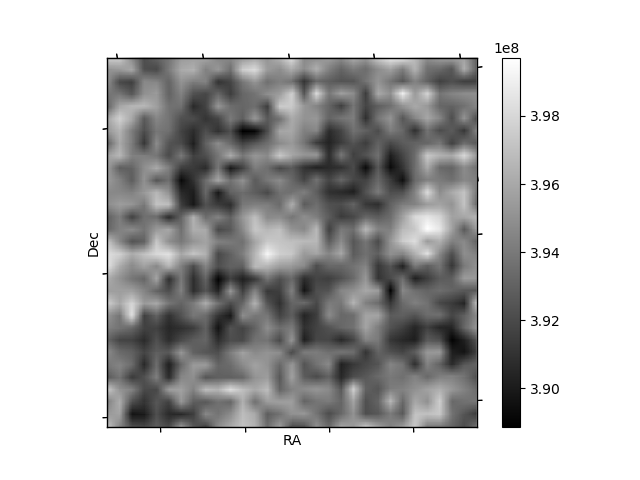
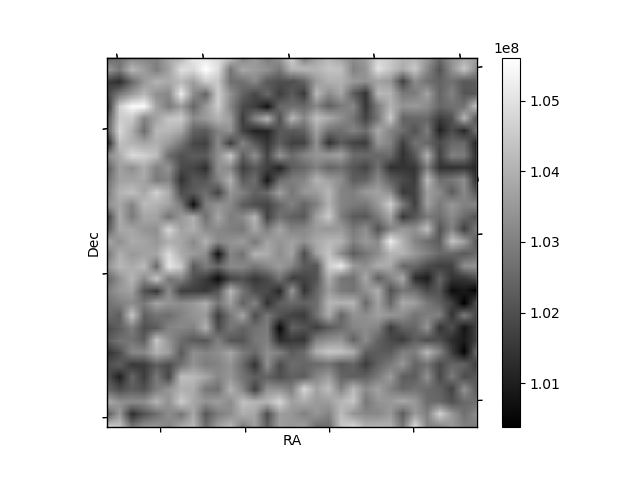
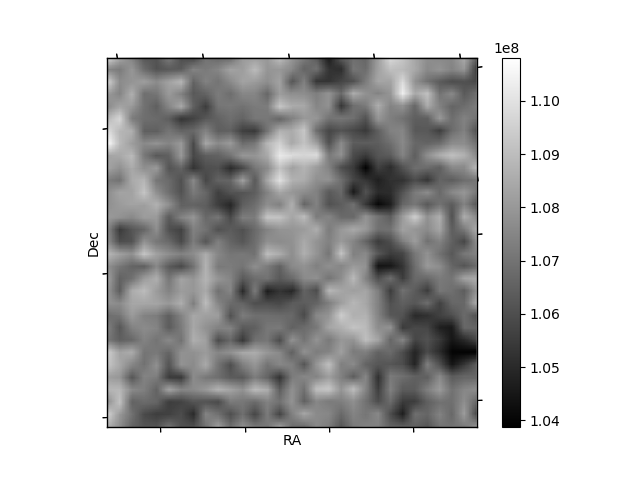
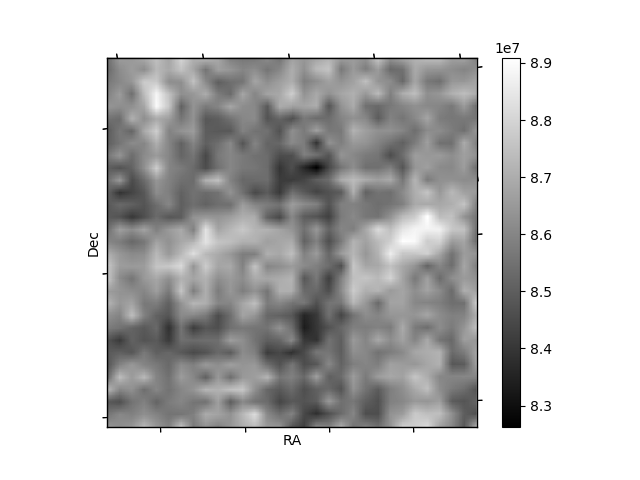
Histogram calculated using DETX and DETY for each event in the final _common_clean file
| Quadrant A | 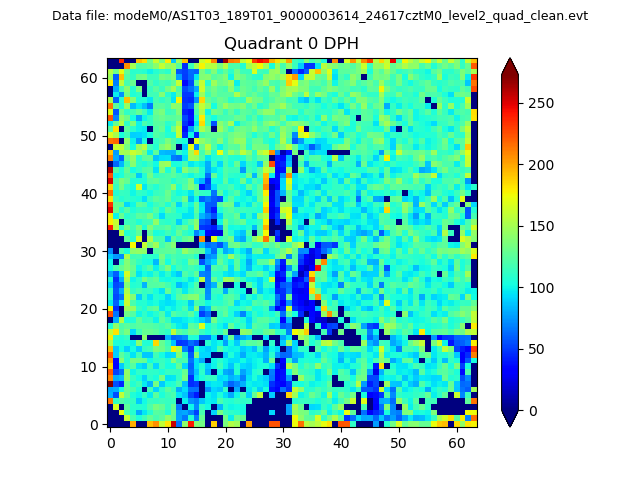 |
 |
Quadrant B |
|---|---|---|---|
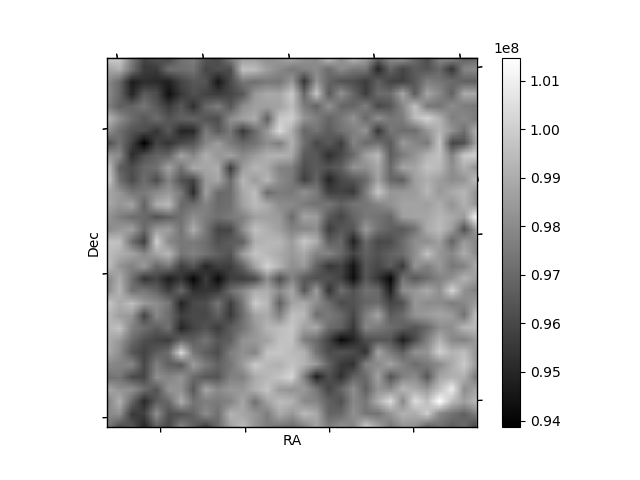
| Quadrant D | 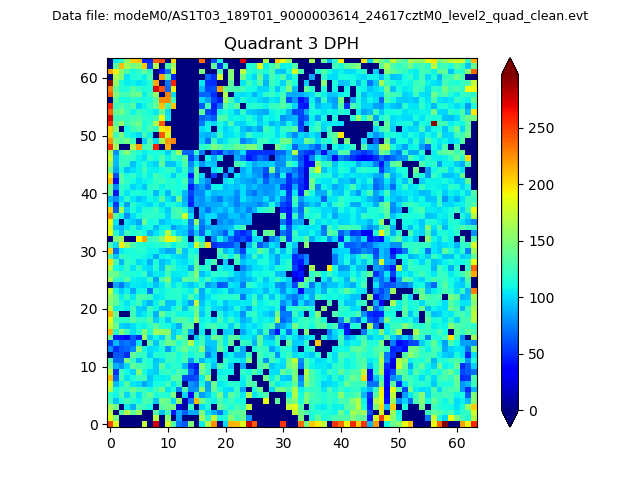 |
 |
Quadrant C |
| Plot type | Count rate plots | Images |
|---|---|---|
| Comparison with Poisson distribution Blue bars denote a histogram of data divided into 1 sec bins. Red curve is a Poisson curve with rate = median count rate of data. |
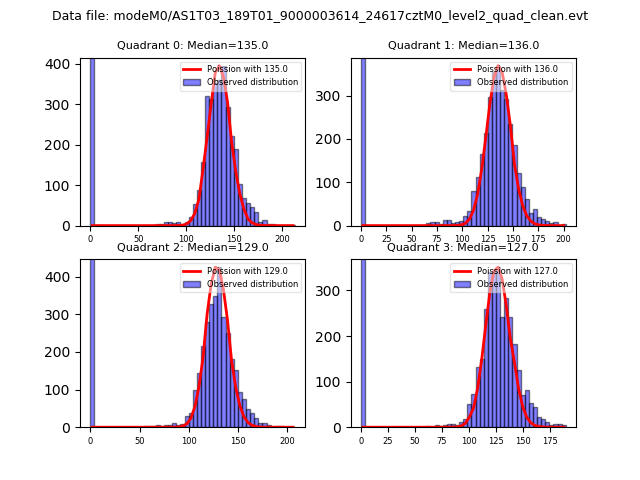 |
 |
| Quadrant-wise count rates Data is divided into 100 sec bins |
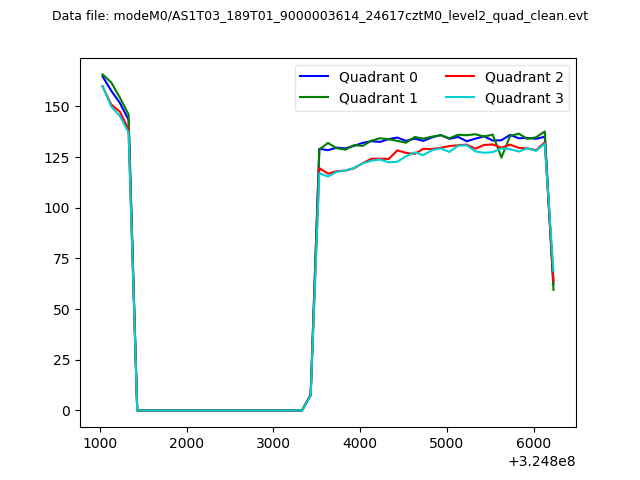 |
|
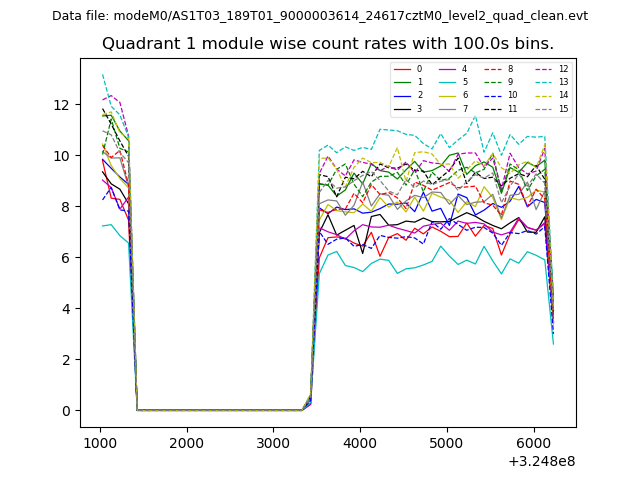
| Module-wise count rates for Quadrant A Data is divided into 100 sec bins |
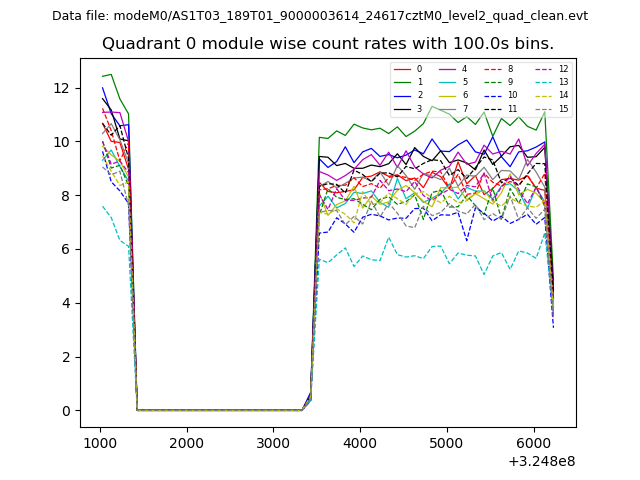 |
 |
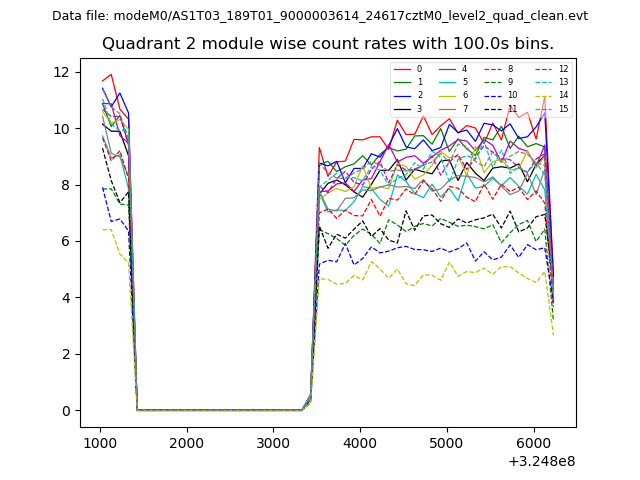
| Module-wise count rates for Quadrant B Data is divided into 100 sec bins |
 |
 |
| Module-wise count rates for Quadrant C Data is divided into 100 sec bins |
 |
 |
| Module-wise count rates for Quadrant D Data is divided into 100 sec bins |
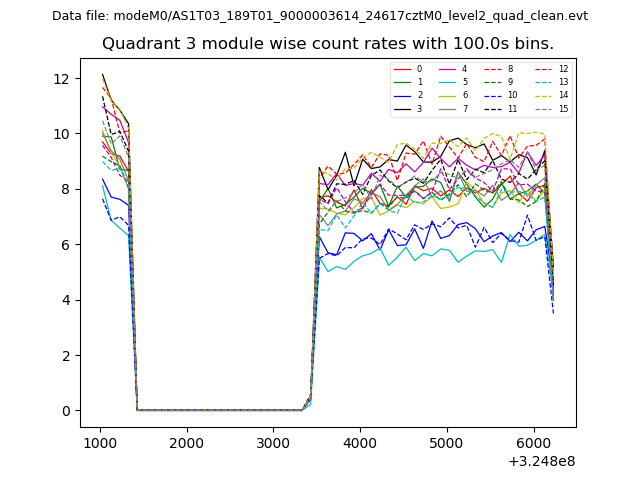 |
 |
| Parameter | Plot |
|---|---|
| CZT HV Monitor | 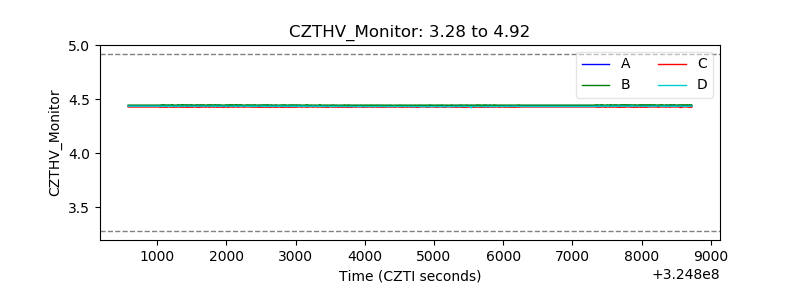 |
| D_VDD | 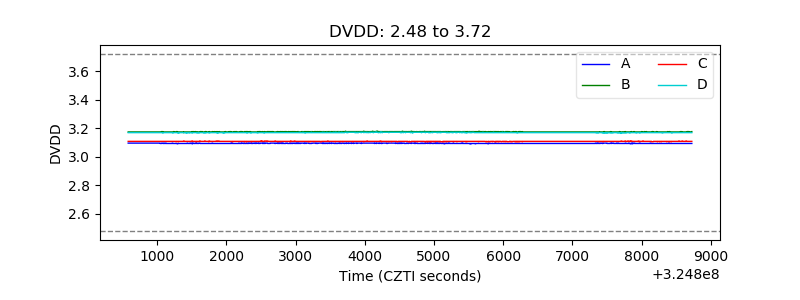 |
| Temperature 1 | 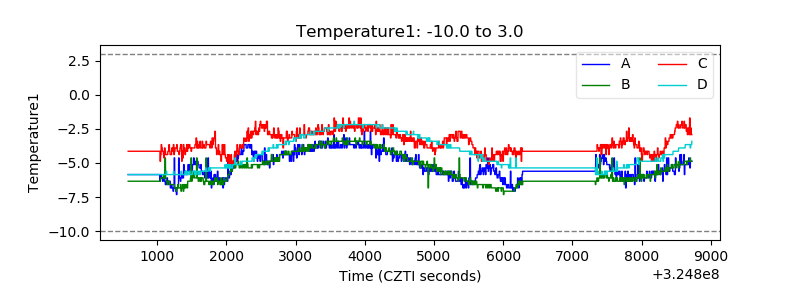 |
| Veto HV Monitor |  |
| Veto LLD | 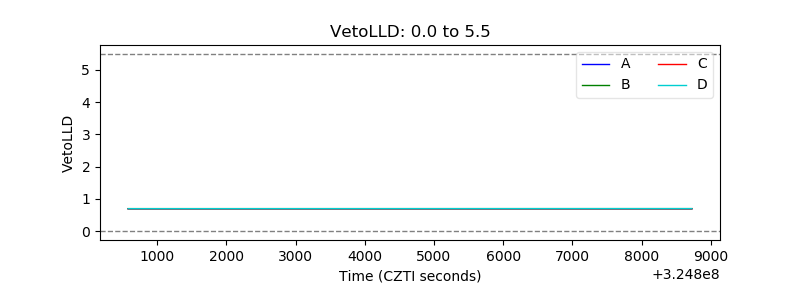 |
| Alpha Counter | 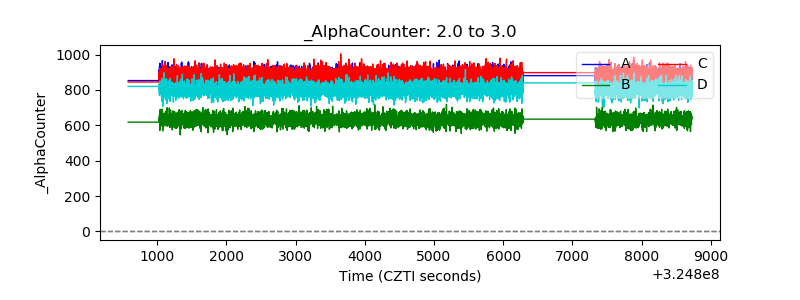 |
| _CPM_Rate | 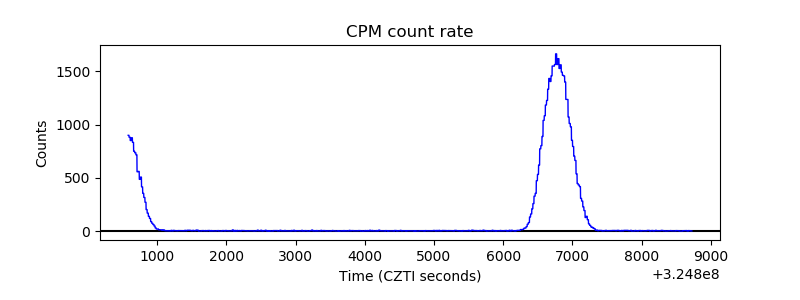 |
| CZT Counter | 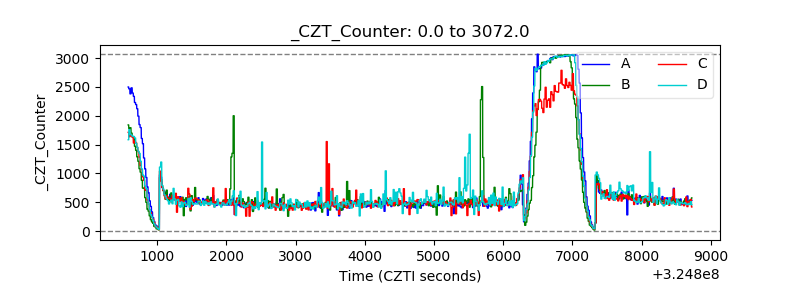 |
| +2.5 Volts monitor |  |
| +5 Volts monitor |  |
| _ROLL_ROT | 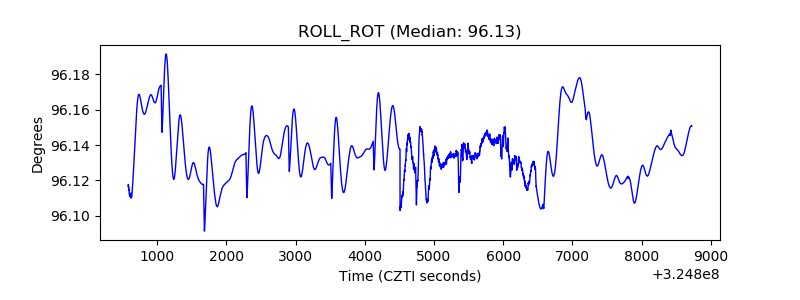 |
| _Roll_DEC | 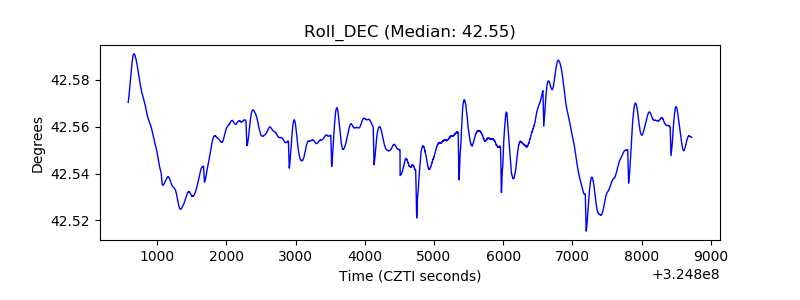 |
| _Roll_RA | 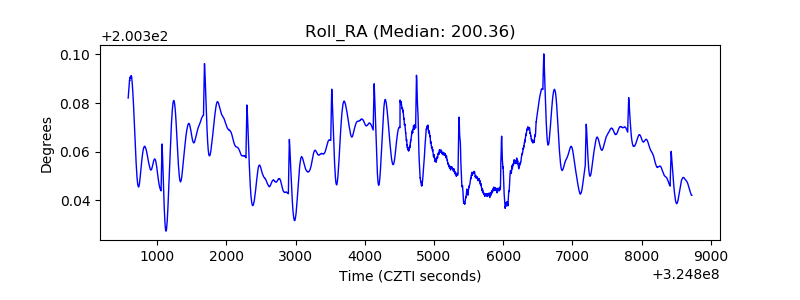 |
| Veto Counter | 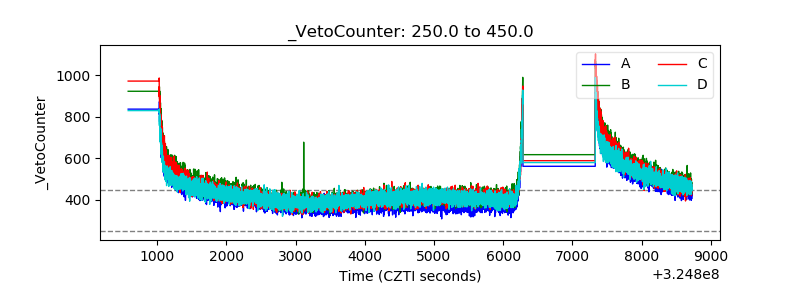 |