| Param | Original file | Final file |
|---|---|---|
| Filename | modeM0/AS1T03_189T01_9000003614_24619cztM0_level2.evt | modeM0/AS1T03_189T01_9000003614_24619cztM0_level2_quad_clean.evt |
| Size (bytes) | 466,320,960 | 69,143,040 |
| Size | 444.7 MB | 65.9 MB |
| Events in quadrant A | 3,375,386 | 423,240 |
| Events in quadrant B | 3,383,533 | 426,655 |
| Events in quadrant C | 3,374,899 | 402,376 |
| Events in quadrant D | 3,557,967 | 398,544 |
| Mode M9 | |||
|---|---|---|---|
| Quadrant | BADHDUFLAG | Total packets | Discarded packets |
| A | 0 | 15 | 0 |
| B | 0 | 16 | 0 |
| C | 0 | 16 | 0 |
| D | 0 | 16 | 0 |
| Mode M0 | |||
|---|---|---|---|
| Quadrant | BADHDUFLAG | Total packets | Discarded packets |
| A | 0 | 14044 | 2 |
| B | 0 | 14013 | 2 |
| C | 0 | 13937 | 2 |
| D | 0 | 14591 | 2 |
| Mode SS | |||
|---|---|---|---|
| Quadrant | BADHDUFLAG | Total packets | Discarded packets |
| A | 0 | 128 | 0 |
| B | 0 | 128 | 0 |
| C | 0 | 128 | 0 |
| D | 0 | 128 | 0 |
| Quadrant | Total seconds | Saturated seconds | Saturation percentage |
|---|---|---|---|
| A | 6347 | 68 | 1.071372% |
| B | 6347 | 76 | 1.197416% |
| C | 6347 | 97 | 1.528281% |
| D | 6347 | 64 | 1.008350% |
Noise dominated data is calculated using 1-second bins in cleaned event files. If a bin has >2000 counts, and if more than 50% of those come from <1% of pixels, then it is considered to be noise-dominated and hence unusable.
| Quadrant | # 1 sec bins | Bins with >0 counts | Bins with >2000 counts | High rate bins dominated by noise | Noise dominated (total time) | Noise dominated (detector-on time) | Marked lightcurve |
|---|---|---|---|---|---|---|---|
| A | 7547 | 6347 | 0 | 0 | 0.00% | 0.00% | 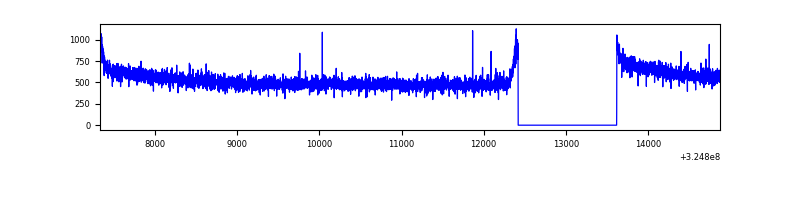 |
| B | 7547 | 6347 | 0 | 0 | 0.00% | 0.00% | 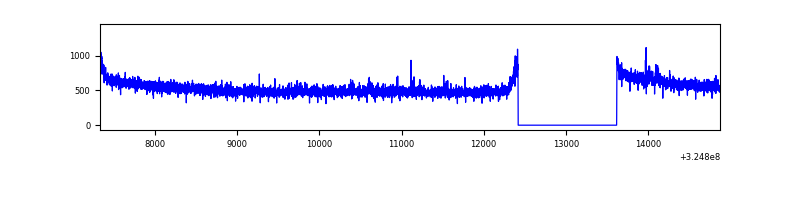 |
| C | 7547 | 6348 | 3 | 3 | 0.04% | 0.05% | 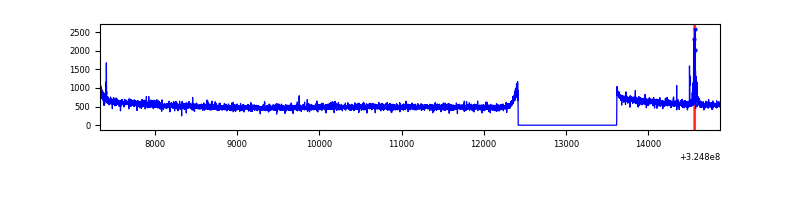 |
| D | 7547 | 6347 | 15 | 15 | 0.20% | 0.24% | 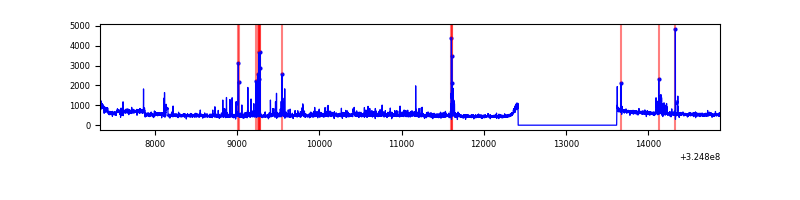 |
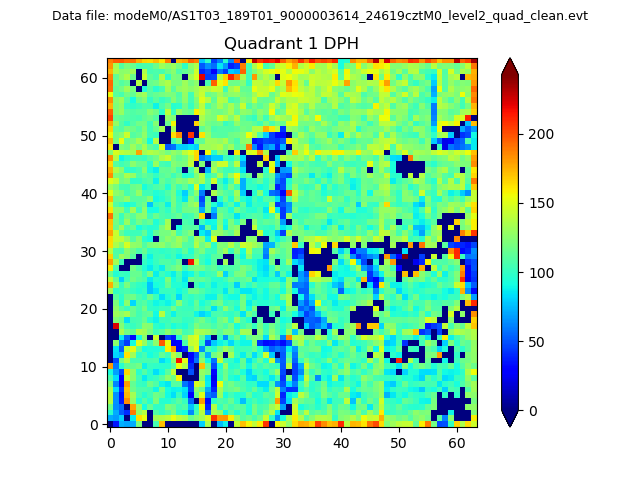
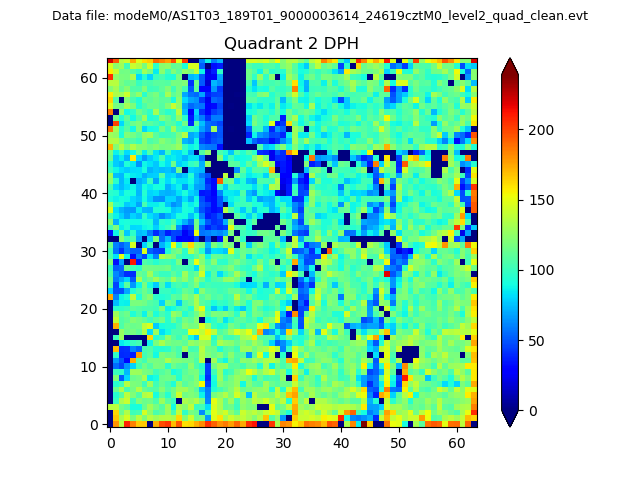
Top three noisy pixels from each quadrant. If the there are fewer than three noisy pixels in the level2.evt file, extra rows are filled as -1
| Pixel properties | Quadrant properties | ||||||
|---|---|---|---|---|---|---|---|
| Quadrant | DetID | PixID | Counts | Sigma | Mean | Median | Sigma |
| A | 13 | 254 | 9240 | 48.62 | 874 | 859 | 172.4 |
| A | 6 | 16 | 8854 | 46.38 | 874 | 859 | 172.4 |
| A | 3 | 137 | 7683 | 39.59 | 874 | 859 | 172.4 |
| B | 12 | 111 | 19565 | 115.82 | 857 | 840 | 161.7 |
| B | 11 | 111 | 17930 | 105.71 | 857 | 840 | 161.7 |
| B | 14 | 111 | 16819 | 98.83 | 857 | 840 | 161.7 |
| C | 14 | 238 | 131633 | 692.85 | 818 | 825 | 188.8 |
| C | 9 | 54 | 35188 | 182.01 | 818 | 825 | 188.8 |
| C | 3 | 233 | 8290 | 39.54 | 818 | 825 | 188.8 |
| D | 1 | 52 | 190928 | 946.8 | 838 | 816 | 200.8 |
| D | 8 | 195 | 110682 | 547.16 | 838 | 816 | 200.8 |
| D | 10 | 70 | 58720 | 288.37 | 838 | 816 | 200.8 |
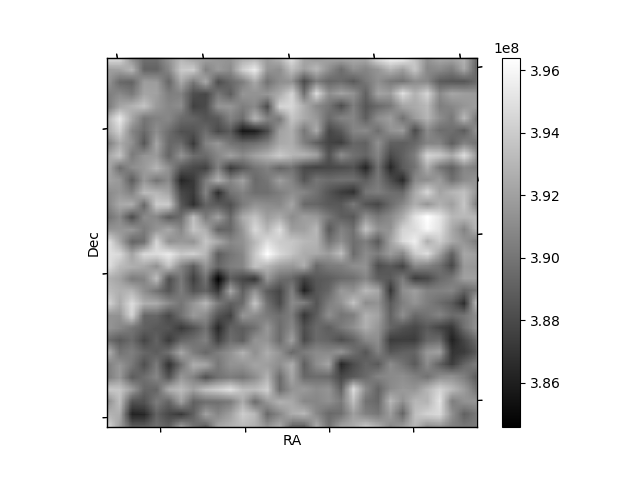
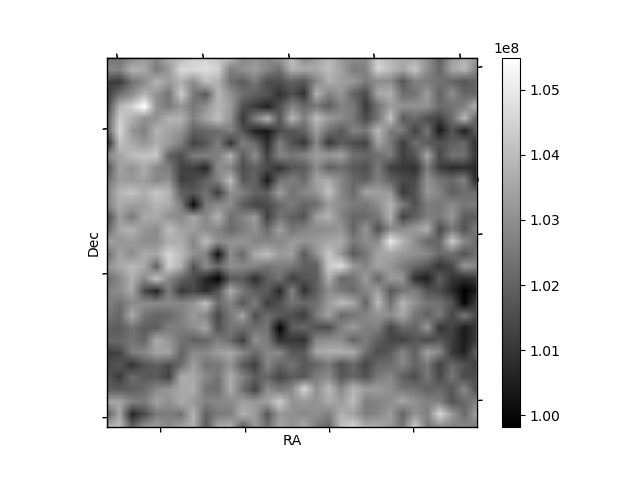
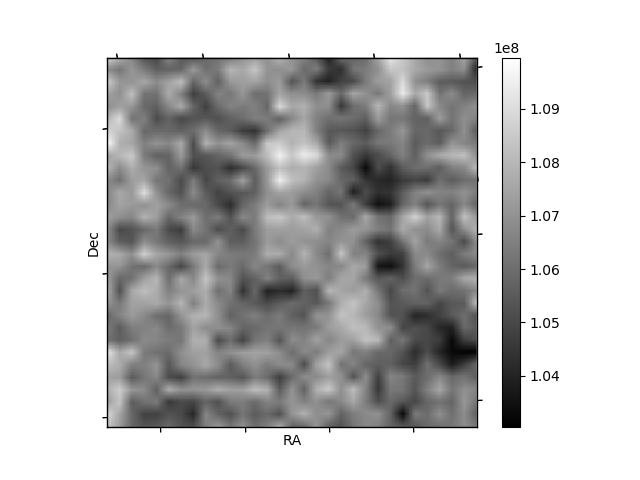
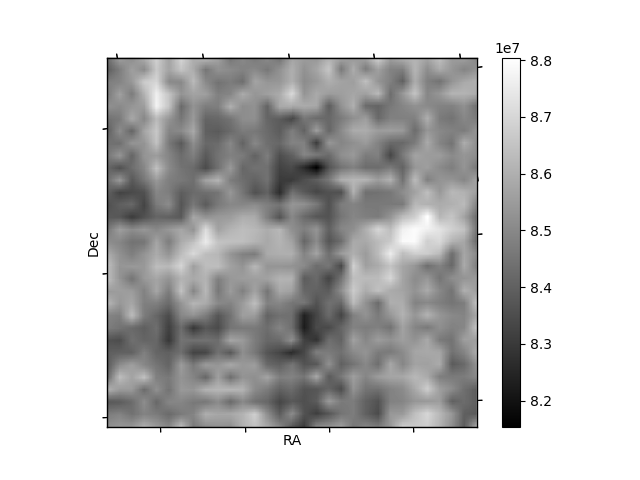
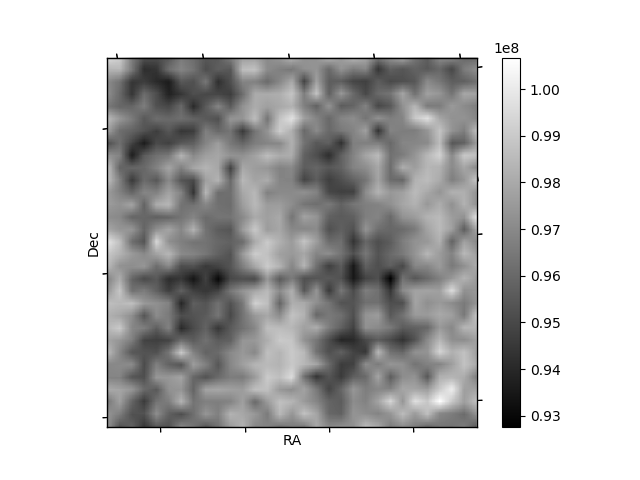
Histogram calculated using DETX and DETY for each event in the final _common_clean file
| Quadrant A | 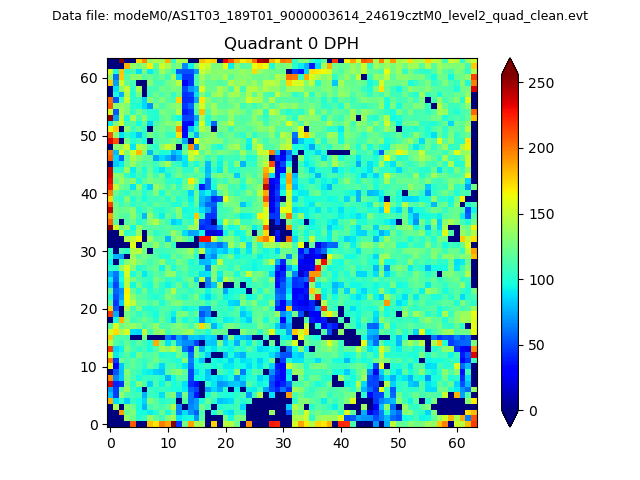 |
 |
Quadrant B |
|---|---|---|---|
| Quadrant D | 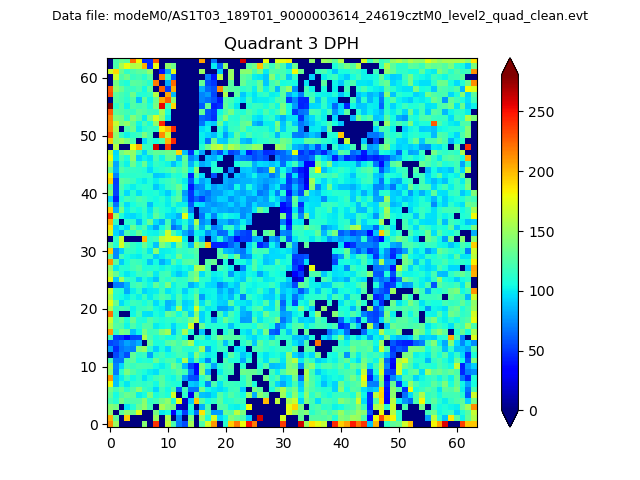 |
 |
Quadrant C |
| Plot type | Count rate plots | Images |
|---|---|---|
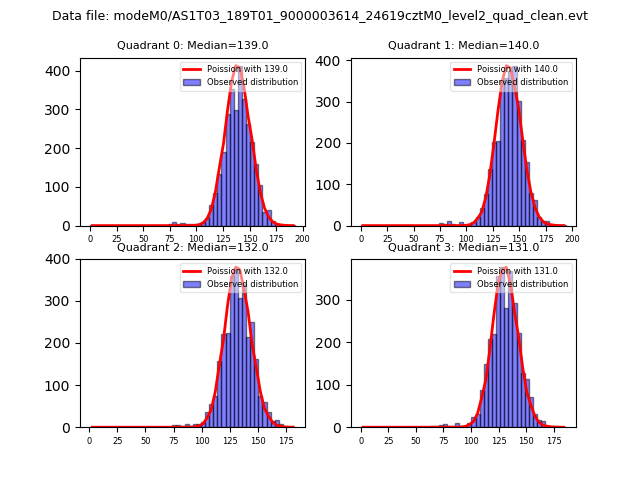
| Comparison with Poisson distribution Blue bars denote a histogram of data divided into 1 sec bins. Red curve is a Poisson curve with rate = median count rate of data. |
 |
 |
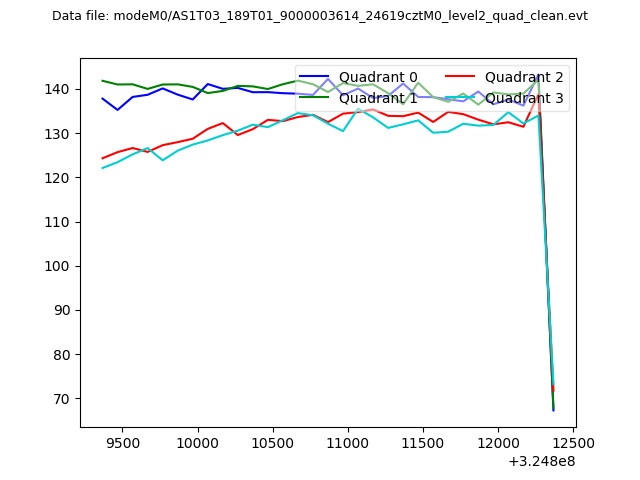
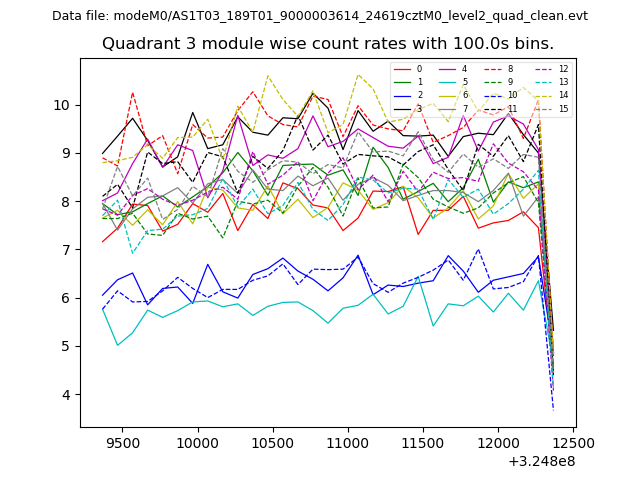
| Quadrant-wise count rates Data is divided into 100 sec bins |
 |
|
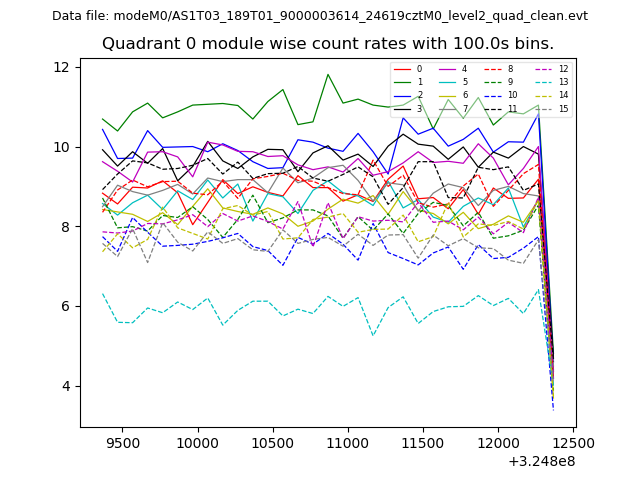
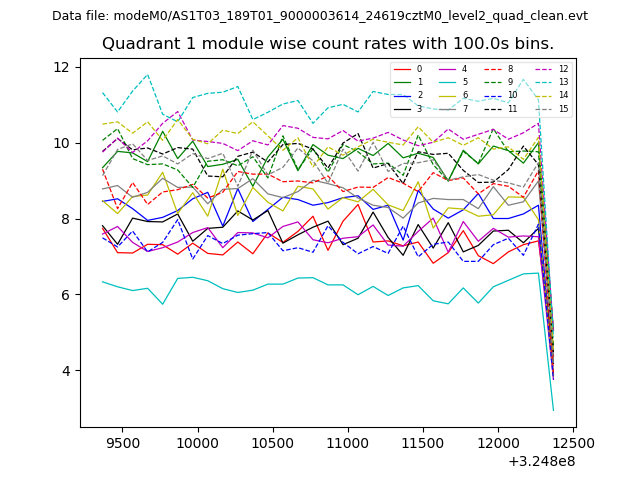
| Module-wise count rates for Quadrant A Data is divided into 100 sec bins |
 |
 |
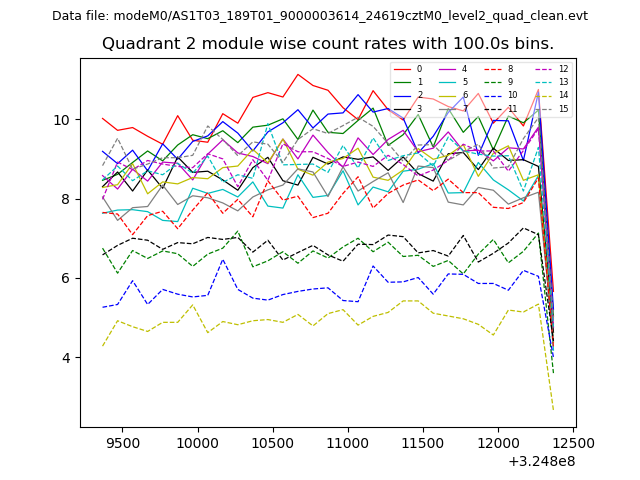
| Module-wise count rates for Quadrant B Data is divided into 100 sec bins |
 |
 |
| Module-wise count rates for Quadrant C Data is divided into 100 sec bins |
 |
 |
| Module-wise count rates for Quadrant D Data is divided into 100 sec bins |
 |
 |
| Parameter | Plot |
|---|---|
| CZT HV Monitor | 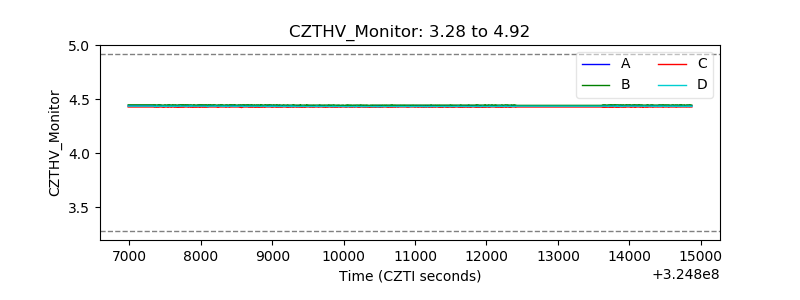 |
| D_VDD | 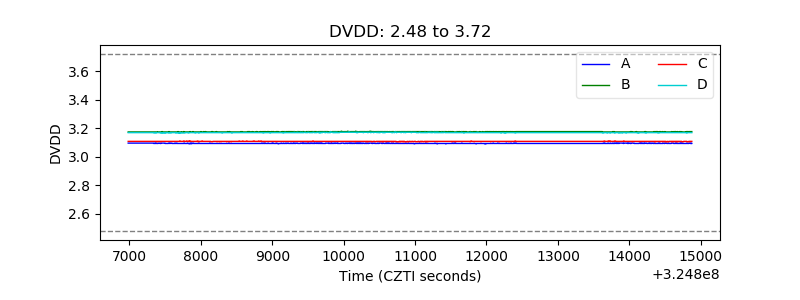 |
| Temperature 1 | 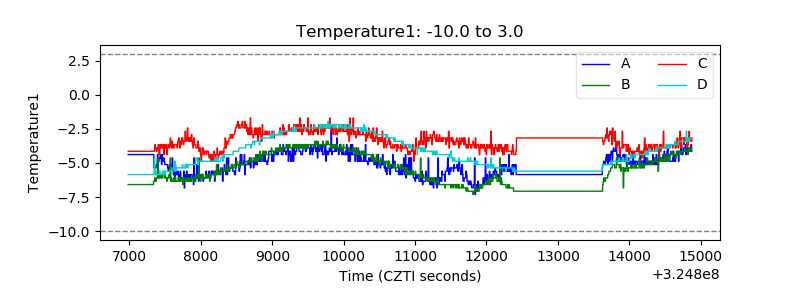 |
| Veto HV Monitor | 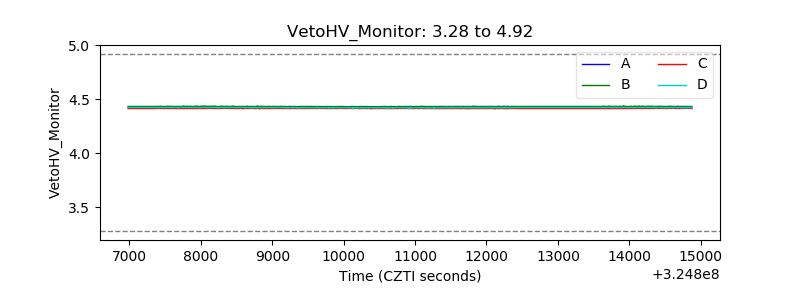 |
| Veto LLD | 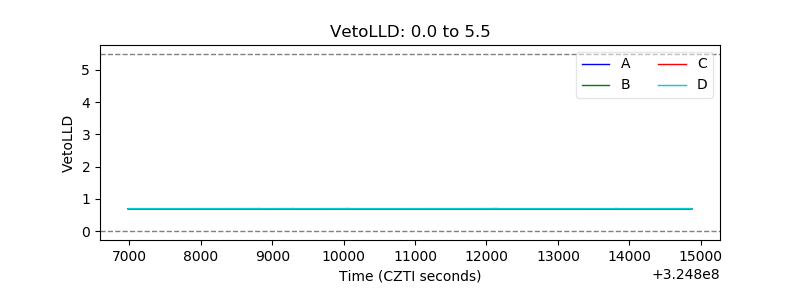 |
| Alpha Counter | 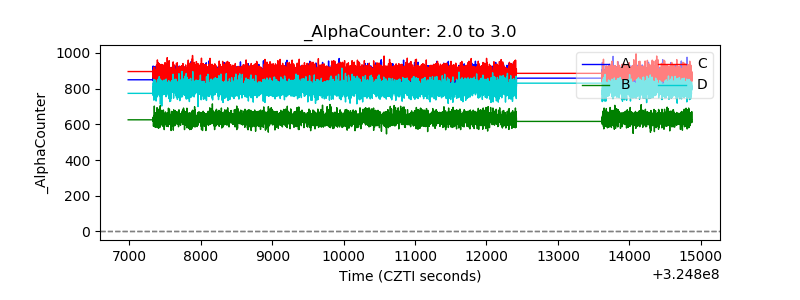 |
| _CPM_Rate | 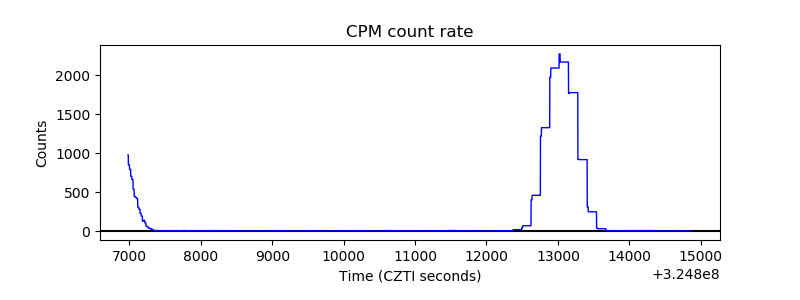 |
| CZT Counter | 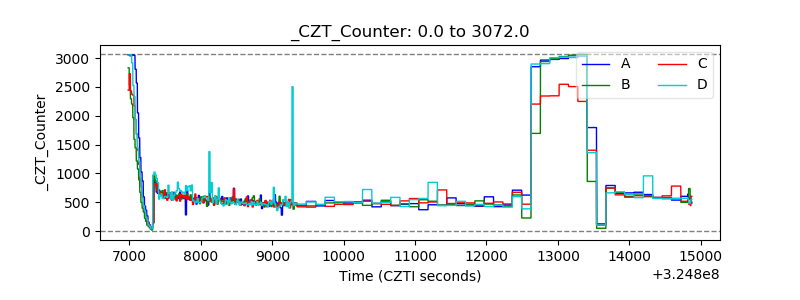 |
| +2.5 Volts monitor |  |
| +5 Volts monitor | 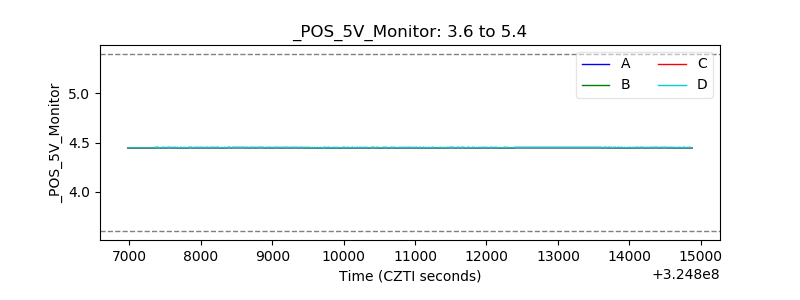 |
| _ROLL_ROT | 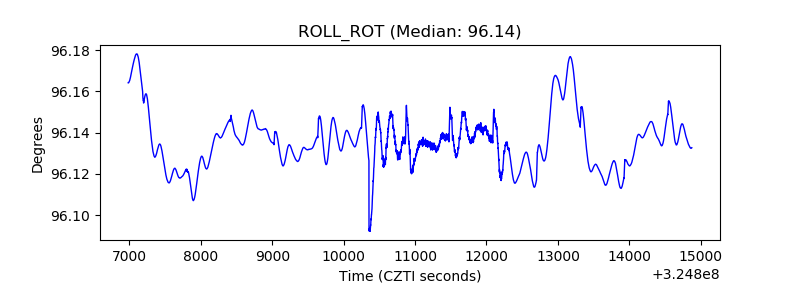 |
| _Roll_DEC | 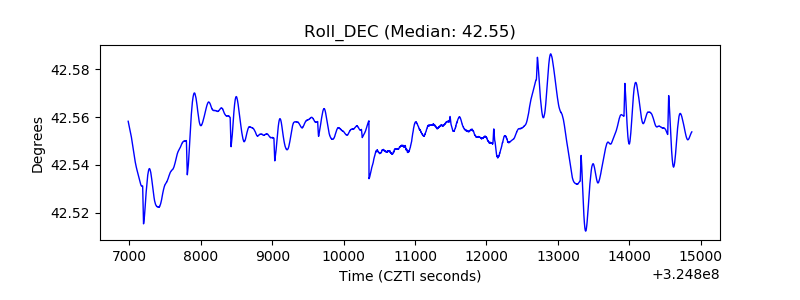 |
| _Roll_RA | 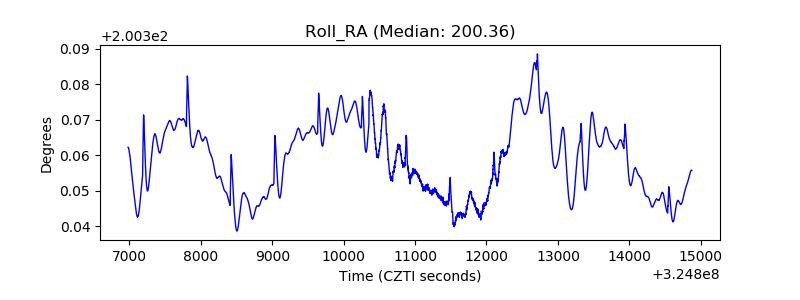 |
| Veto Counter | 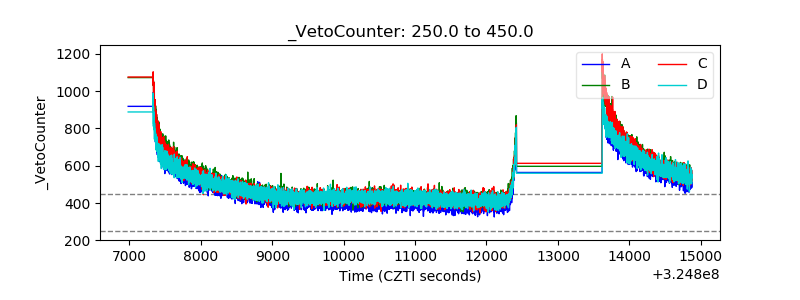 |