| Param | Original file | Final file |
|---|---|---|
| Filename | modeM0/AS1T03_189T01_9000003614_24622cztM0_level2.evt | modeM0/AS1T03_189T01_9000003614_24622cztM0_level2_quad_clean.evt |
| Size (bytes) | 451,154,880 | 110,551,680 |
| Size | 430.3 MB | 105.4 MB |
| Events in quadrant A | 3,065,432 | 757,946 |
| Events in quadrant B | 3,211,729 | 758,494 |
| Events in quadrant C | 3,755,772 | 719,810 |
| Events in quadrant D | 3,247,435 | 717,876 |
| Mode M9 | |||
|---|---|---|---|
| Quadrant | BADHDUFLAG | Total packets | Discarded packets |
| A | 0 | 13 | 0 |
| B | 0 | 13 | 0 |
| C | 0 | 13 | 0 |
| D | 0 | 13 | 0 |
| Mode M0 | |||
|---|---|---|---|
| Quadrant | BADHDUFLAG | Total packets | Discarded packets |
| A | 0 | 12601 | 1 |
| B | 0 | 12987 | 1 |
| C | 0 | 14890 | 1 |
| D | 0 | 13432 | 1 |
| Mode SS | |||
|---|---|---|---|
| Quadrant | BADHDUFLAG | Total packets | Discarded packets |
| A | 0 | 114 | 0 |
| B | 0 | 114 | 0 |
| C | 0 | 114 | 0 |
| D | 0 | 114 | 0 |
| Quadrant | Total seconds | Saturated seconds | Saturation percentage |
|---|---|---|---|
| A | 5639 | 128 | 2.269906% |
| B | 5639 | 171 | 3.032453% |
| C | 5639 | 237 | 4.202873% |
| D | 5639 | 113 | 2.003901% |
Noise dominated data is calculated using 1-second bins in cleaned event files. If a bin has >2000 counts, and if more than 50% of those come from <1% of pixels, then it is considered to be noise-dominated and hence unusable.
| Quadrant | # 1 sec bins | Bins with >0 counts | Bins with >2000 counts | High rate bins dominated by noise | Noise dominated (total time) | Noise dominated (detector-on time) | Marked lightcurve |
|---|---|---|---|---|---|---|---|
| A | 6944 | 5639 | 0 | 0 | 0.00% | 0.00% | 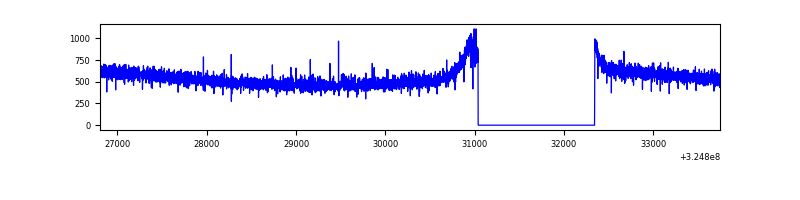 |
| B | 6944 | 5639 | 15 | 15 | 0.22% | 0.27% |  |
| C | 6944 | 5639 | 41 | 41 | 0.59% | 0.73% | 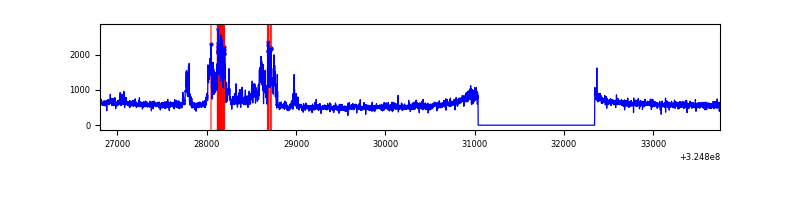 |
| D | 6944 | 5639 | 1 | 1 | 0.01% | 0.02% | 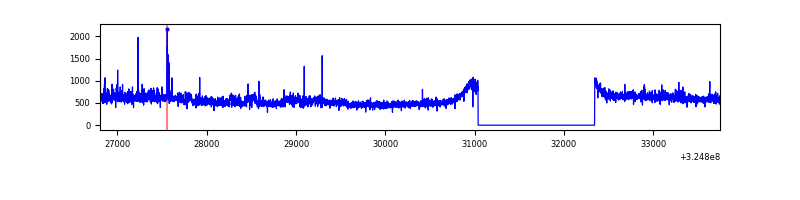 |
Top three noisy pixels from each quadrant. If the there are fewer than three noisy pixels in the level2.evt file, extra rows are filled as -1
| Pixel properties | Quadrant properties | ||||||
|---|---|---|---|---|---|---|---|
| Quadrant | DetID | PixID | Counts | Sigma | Mean | Median | Sigma |
| A | 13 | 254 | 7868 | 45.41 | 794 | 783 | 156.0 |
| A | 0 | 226 | 6863 | 38.97 | 794 | 783 | 156.0 |
| A | 3 | 137 | 6773 | 38.4 | 794 | 783 | 156.0 |
| B | 3 | 64 | 110712 | 767.39 | 771 | 753 | 143.3 |
| B | 0 | 190 | 61077 | 420.99 | 771 | 753 | 143.3 |
| B | 12 | 111 | 16898 | 112.67 | 771 | 753 | 143.3 |
| C | 7 | 247 | 608180 | 3458.36 | 763 | 770 | 175.6 |
| C | 14 | 238 | 122485 | 693.0 | 763 | 770 | 175.6 |
| C | 10 | 91 | 26347 | 145.63 | 763 | 770 | 175.6 |
| D | 1 | 52 | 236481 | 1272.18 | 779 | 759 | 185.3 |
| D | 8 | 195 | 71280 | 380.6 | 779 | 759 | 185.3 |
| D | 2 | 234 | 23354 | 121.94 | 779 | 759 | 185.3 |
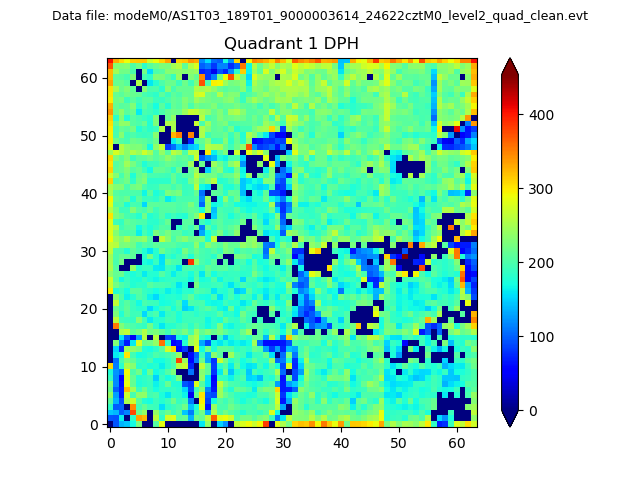
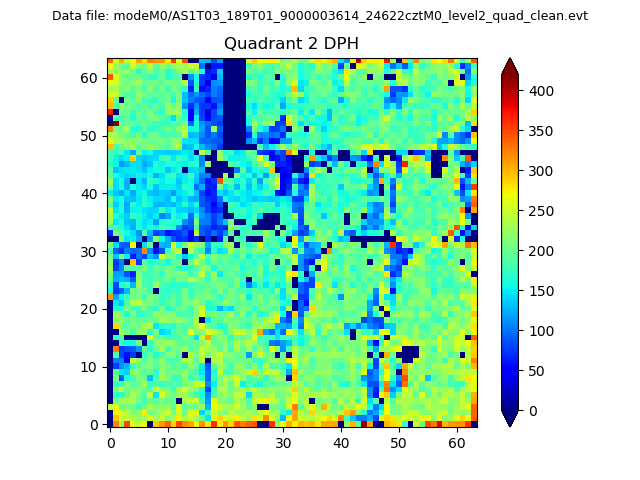
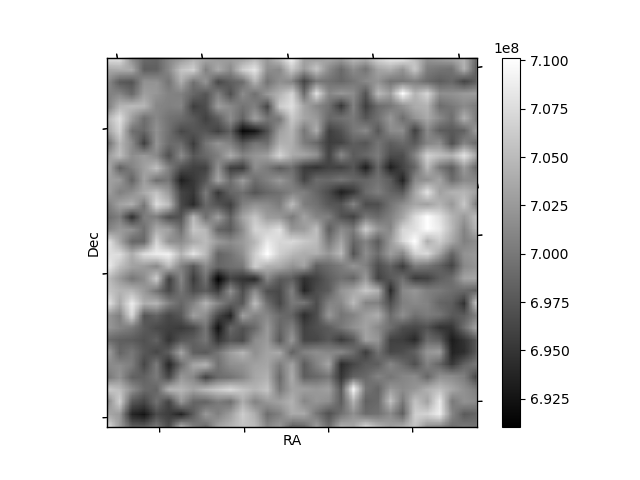
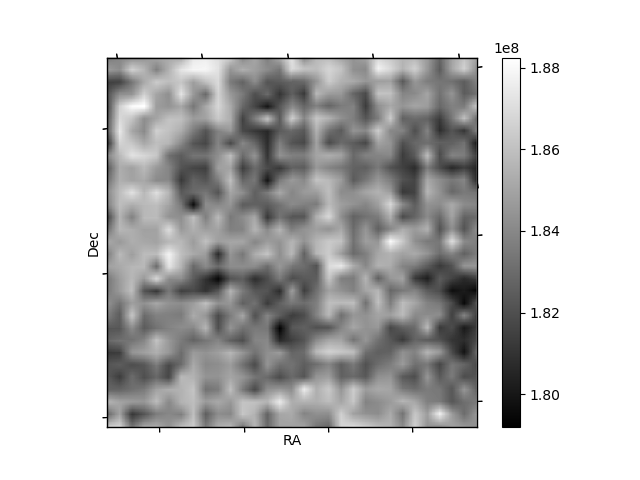
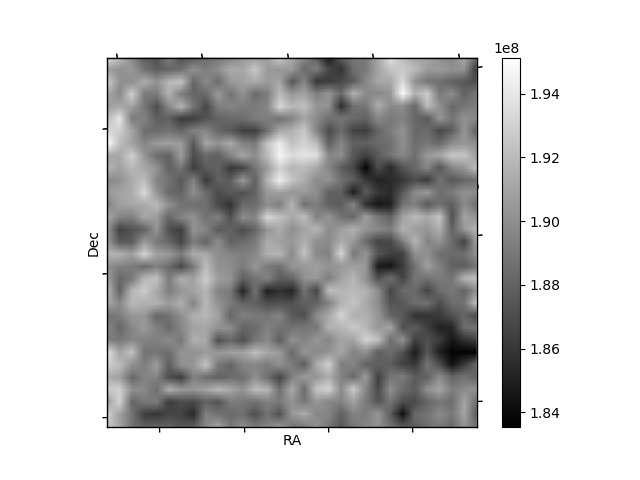
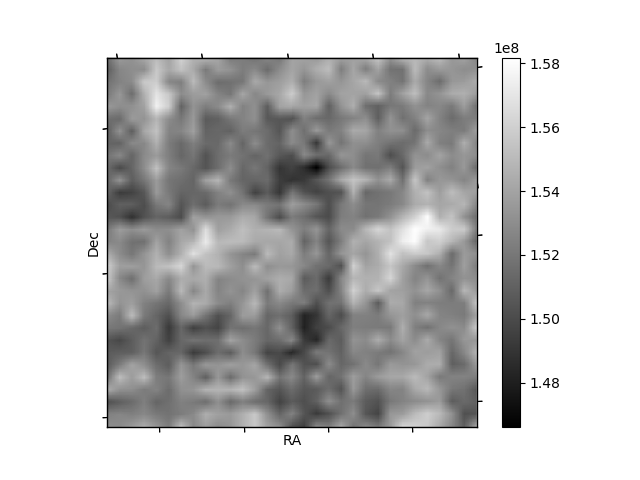
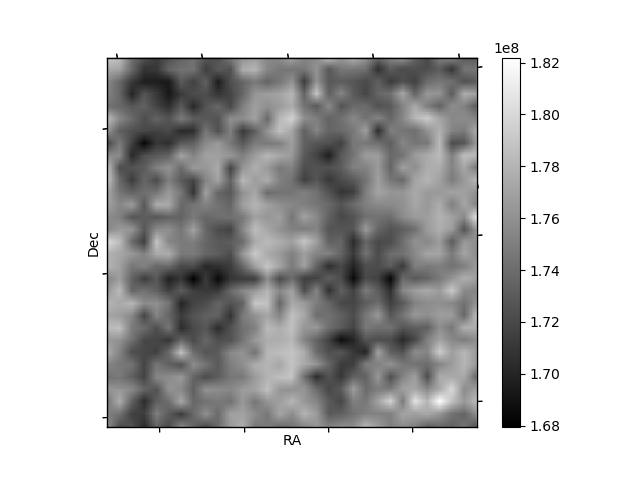
Histogram calculated using DETX and DETY for each event in the final _common_clean file
| Quadrant A | 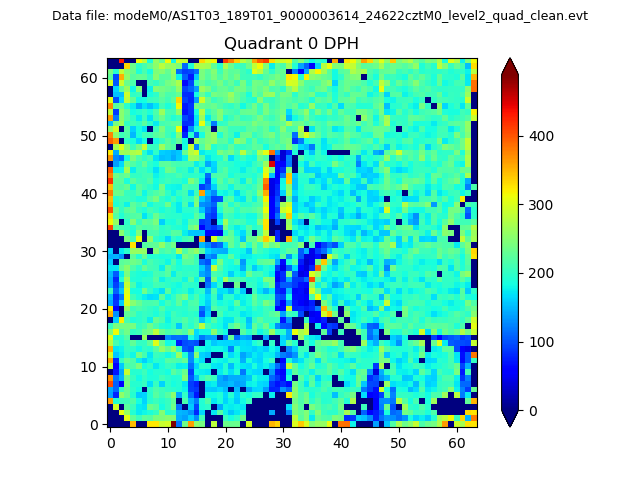 |
 |
Quadrant B |
|---|---|---|---|
| Quadrant D | 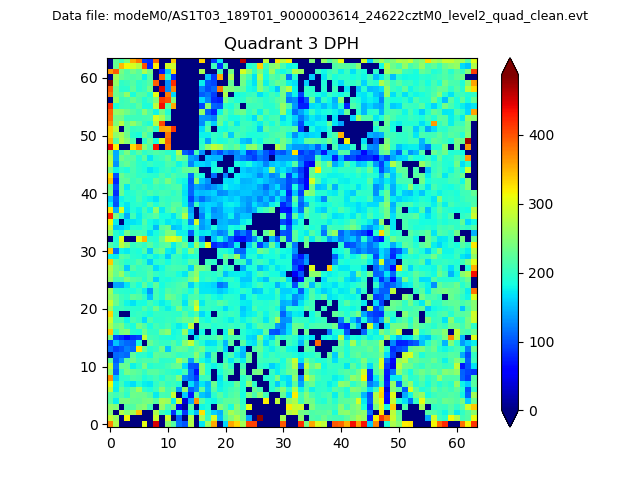 |
 |
Quadrant C |
| Plot type | Count rate plots | Images |
|---|---|---|
| Comparison with Poisson distribution Blue bars denote a histogram of data divided into 1 sec bins. Red curve is a Poisson curve with rate = median count rate of data. |
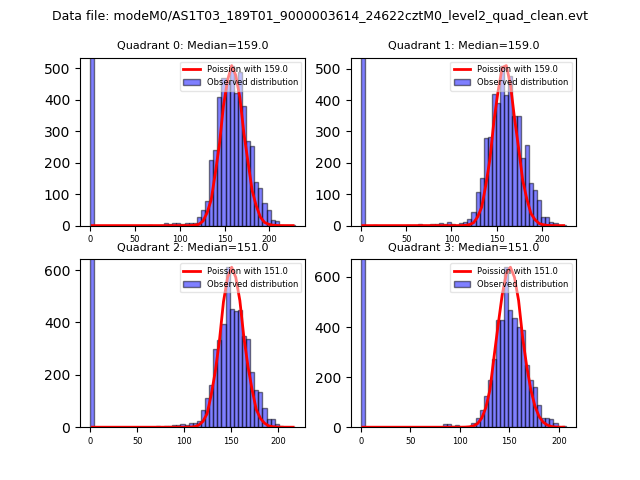 |
 |
| Quadrant-wise count rates Data is divided into 100 sec bins |
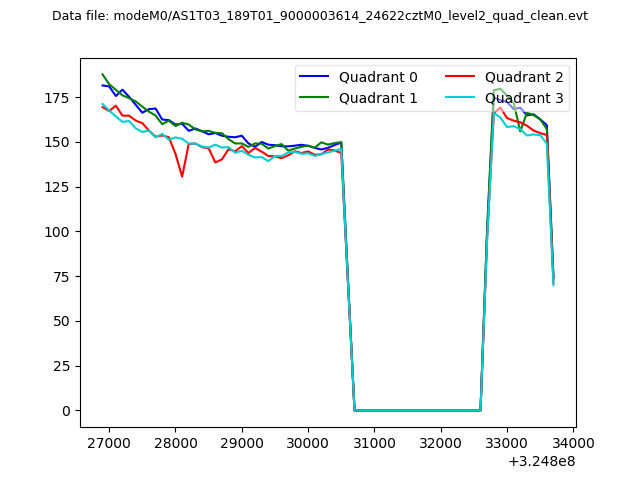 |
|
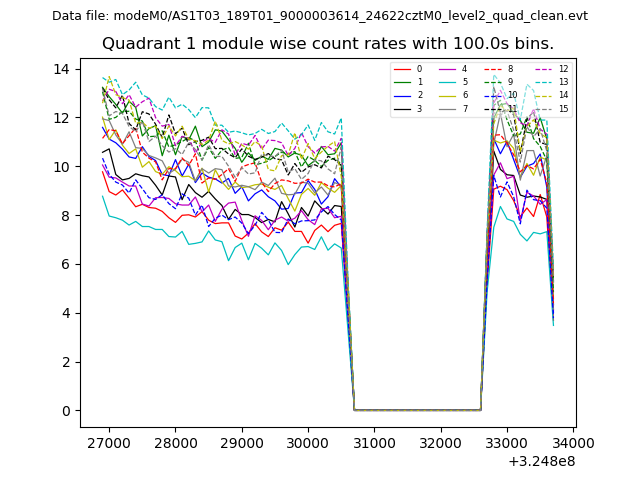
| Module-wise count rates for Quadrant A Data is divided into 100 sec bins |
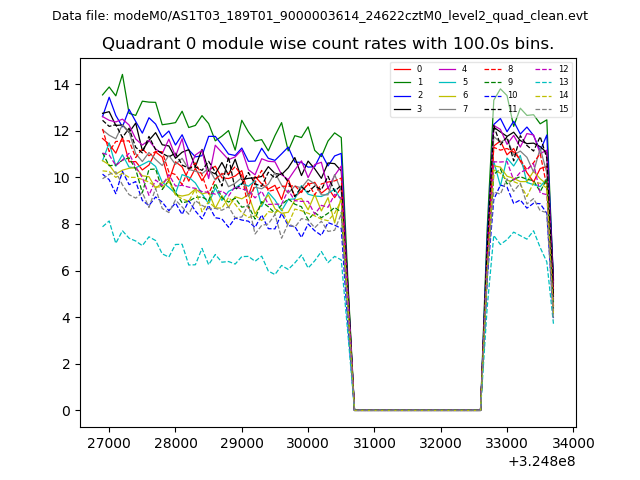 |
 |
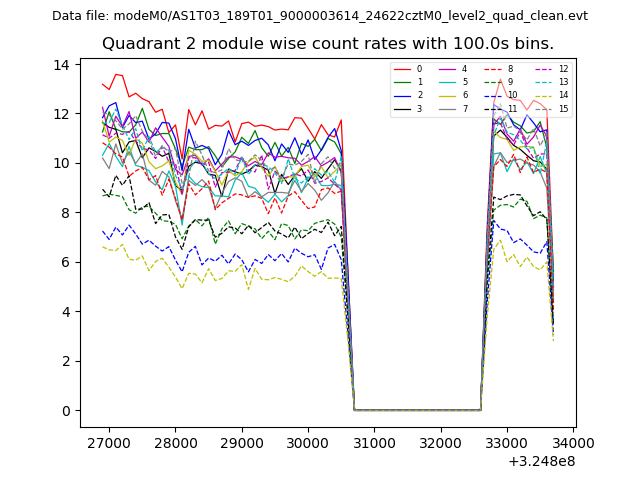
| Module-wise count rates for Quadrant B Data is divided into 100 sec bins |
 |
 |
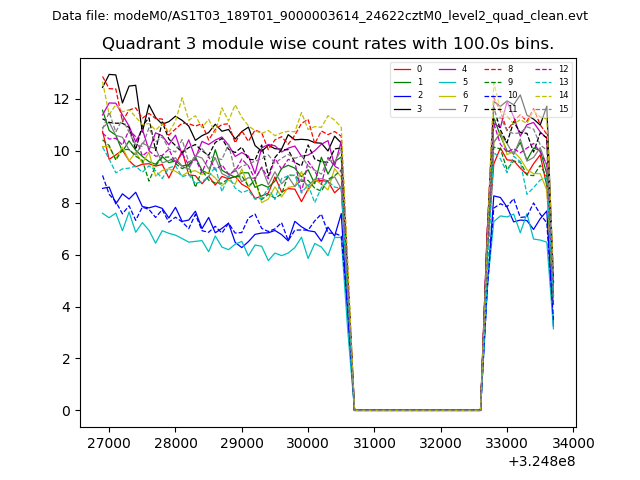
| Module-wise count rates for Quadrant C Data is divided into 100 sec bins |
 |
 |
| Module-wise count rates for Quadrant D Data is divided into 100 sec bins |
 |
 |
| Parameter | Plot |
|---|---|
| CZT HV Monitor | 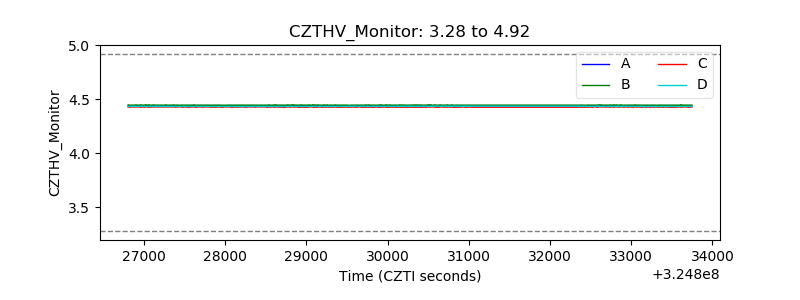 |
| D_VDD | 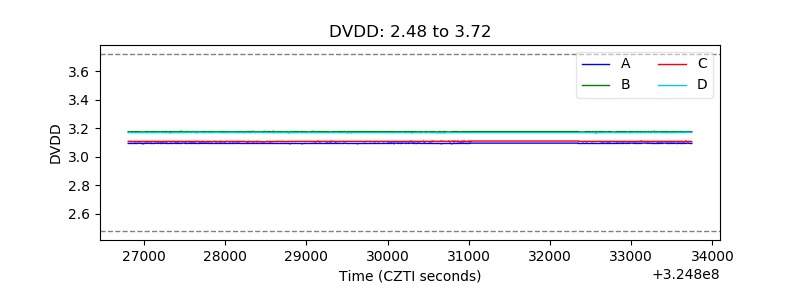 |
| Temperature 1 | 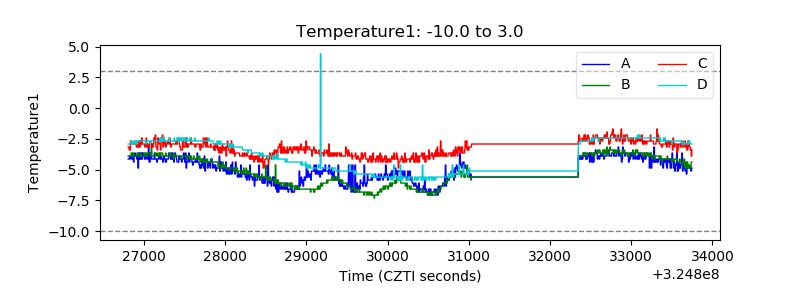 |
| Veto HV Monitor | 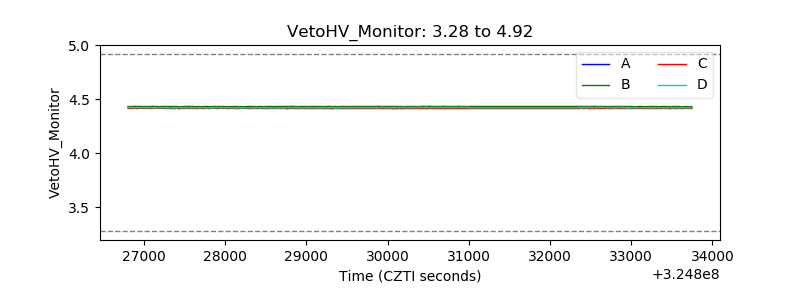 |
| Veto LLD | 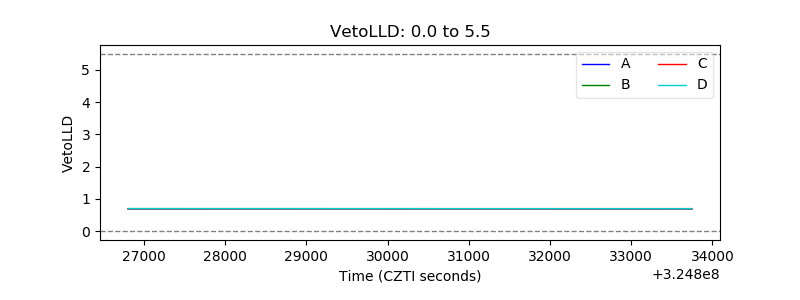 |
| Alpha Counter | 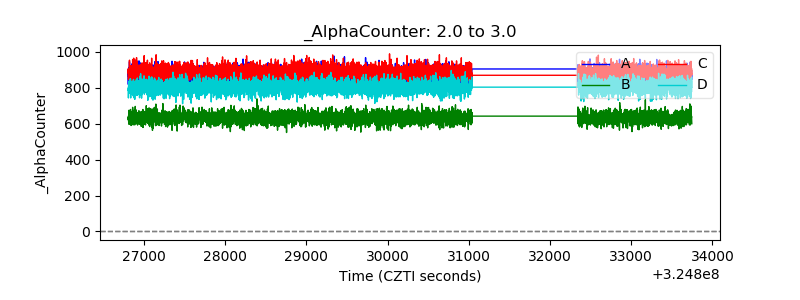 |
| _CPM_Rate | 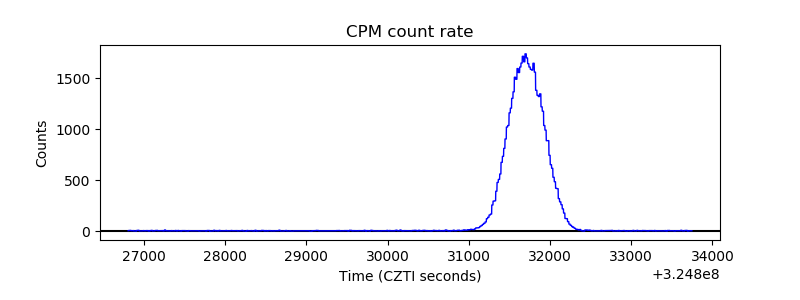 |
| CZT Counter | 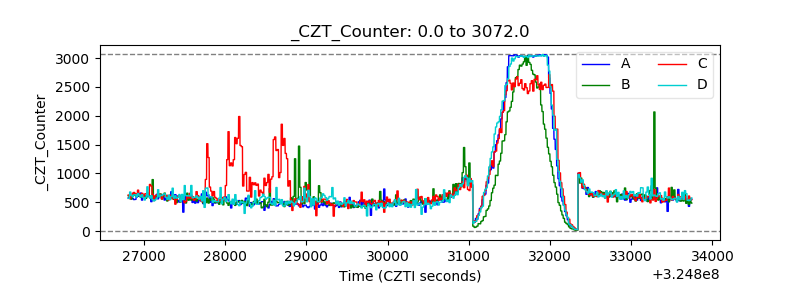 |
| +2.5 Volts monitor |  |
| +5 Volts monitor |  |
| _ROLL_ROT | 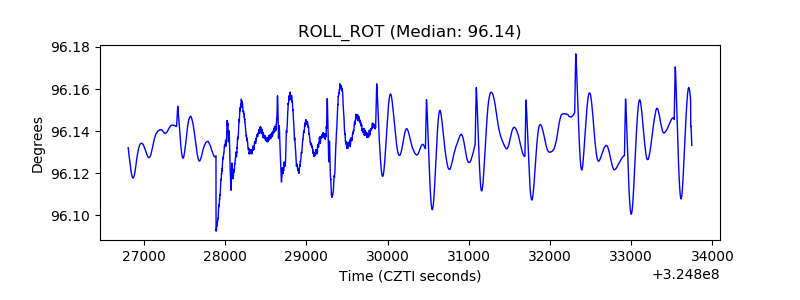 |
| _Roll_DEC | 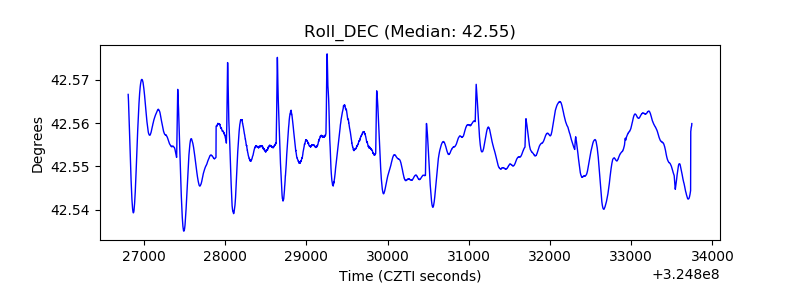 |
| _Roll_RA | 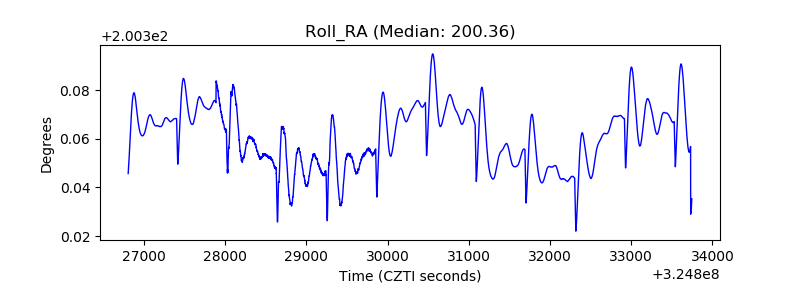 |
| Veto Counter | 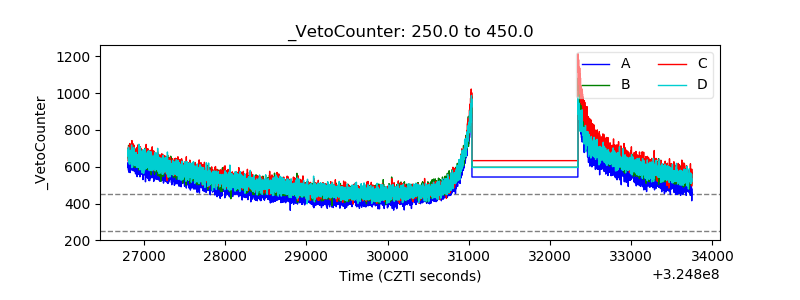 |