| Param | Original file | Final file |
|---|---|---|
| Filename | modeM0/AS1T03_189T01_9000003614_24623cztM0_level2.evt | modeM0/AS1T03_189T01_9000003614_24623cztM0_level2_quad_clean.evt |
| Size (bytes) | 496,198,080 | 114,652,800 |
| Size | 473.2 MB | 109.3 MB |
| Events in quadrant A | 3,284,348 | 775,164 |
| Events in quadrant B | 4,051,143 | 769,494 |
| Events in quadrant C | 3,416,626 | 750,954 |
| Events in quadrant D | 3,847,485 | 736,973 |
| Mode M9 | |||
|---|---|---|---|
| Quadrant | BADHDUFLAG | Total packets | Discarded packets |
| A | 0 | 12 | 0 |
| B | 0 | 12 | 0 |
| C | 0 | 12 | 0 |
| D | 0 | 12 | 0 |
| Mode M0 | |||
|---|---|---|---|
| Quadrant | BADHDUFLAG | Total packets | Discarded packets |
| A | 0 | 13696 | 1 |
| B | 0 | 16213 | 1 |
| C | 0 | 14115 | 1 |
| D | 0 | 15637 | 1 |
| Mode SS | |||
|---|---|---|---|
| Quadrant | BADHDUFLAG | Total packets | Discarded packets |
| A | 0 | 128 | 0 |
| B | 0 | 128 | 0 |
| C | 0 | 128 | 0 |
| D | 0 | 128 | 0 |
| Quadrant | Total seconds | Saturated seconds | Saturation percentage |
|---|---|---|---|
| A | 6303 | 111 | 1.761066% |
| B | 6303 | 211 | 3.347612% |
| C | 6304 | 167 | 2.649112% |
| D | 6303 | 172 | 2.728859% |
Noise dominated data is calculated using 1-second bins in cleaned event files. If a bin has >2000 counts, and if more than 50% of those come from <1% of pixels, then it is considered to be noise-dominated and hence unusable.
| Quadrant | # 1 sec bins | Bins with >0 counts | Bins with >2000 counts | High rate bins dominated by noise | Noise dominated (total time) | Noise dominated (detector-on time) | Marked lightcurve |
|---|---|---|---|---|---|---|---|
| A | 7528 | 6303 | 0 | 0 | 0.00% | 0.00% | 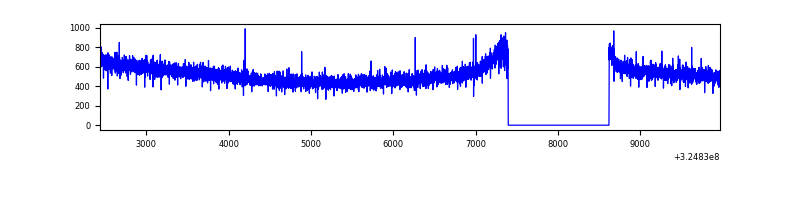 |
| B | 7528 | 6303 | 49 | 49 | 0.65% | 0.78% | 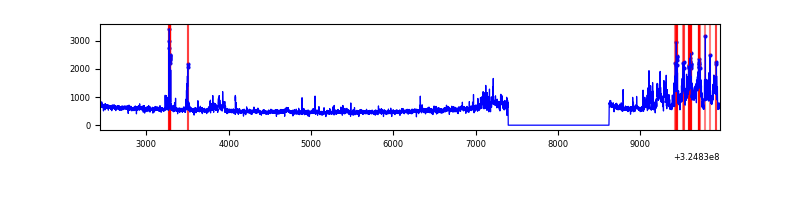 |
| C | 7529 | 6304 | 0 | 0 | 0.00% | 0.00% |  |
| D | 7528 | 6304 | 92 | 92 | 1.22% | 1.46% | 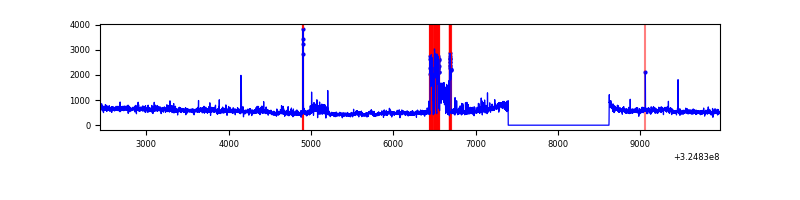 |
Top three noisy pixels from each quadrant. If the there are fewer than three noisy pixels in the level2.evt file, extra rows are filled as -1
| Pixel properties | Quadrant properties | ||||||
|---|---|---|---|---|---|---|---|
| Quadrant | DetID | PixID | Counts | Sigma | Mean | Median | Sigma |
| A | 13 | 254 | 9548 | 51.95 | 850 | 833 | 167.8 |
| A | 3 | 137 | 7460 | 39.5 | 850 | 833 | 167.8 |
| A | 0 | 226 | 7330 | 38.73 | 850 | 833 | 167.8 |
| B | 3 | 64 | 709702 | 4534.55 | 834 | 816 | 156.3 |
| B | 0 | 190 | 64033 | 404.38 | 834 | 816 | 156.3 |
| B | 12 | 111 | 18552 | 113.45 | 834 | 816 | 156.3 |
| C | 14 | 238 | 132152 | 689.39 | 823 | 832 | 190.5 |
| C | 7 | 247 | 38324 | 196.82 | 823 | 832 | 190.5 |
| C | 3 | 233 | 20412 | 102.79 | 823 | 832 | 190.5 |
| D | 1 | 52 | 535278 | 2660.42 | 837 | 815 | 200.9 |
| D | 8 | 195 | 120892 | 597.71 | 837 | 815 | 200.9 |
| D | 2 | 234 | 25495 | 122.85 | 837 | 815 | 200.9 |
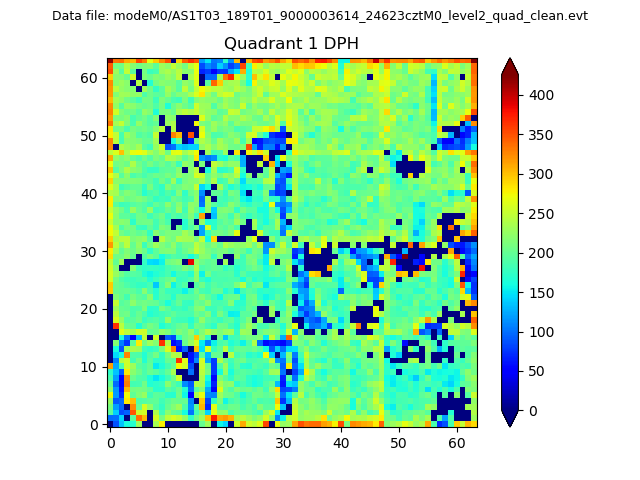
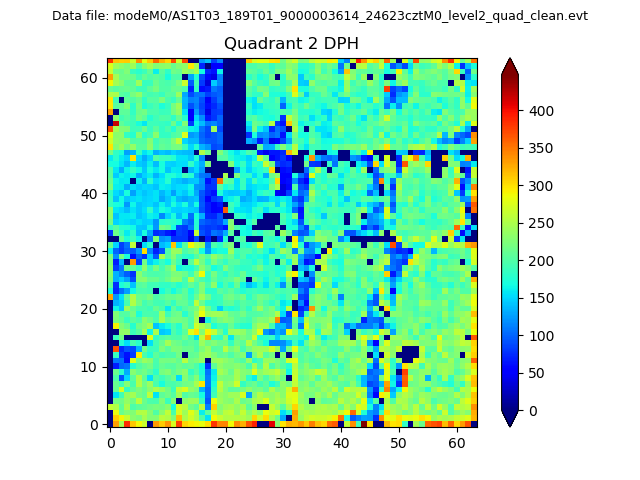
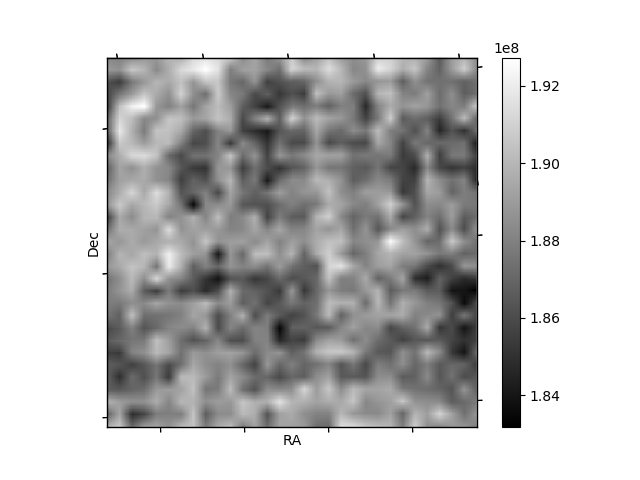
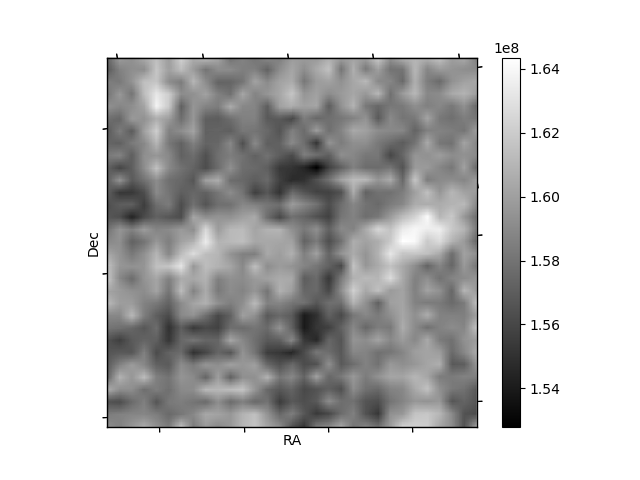
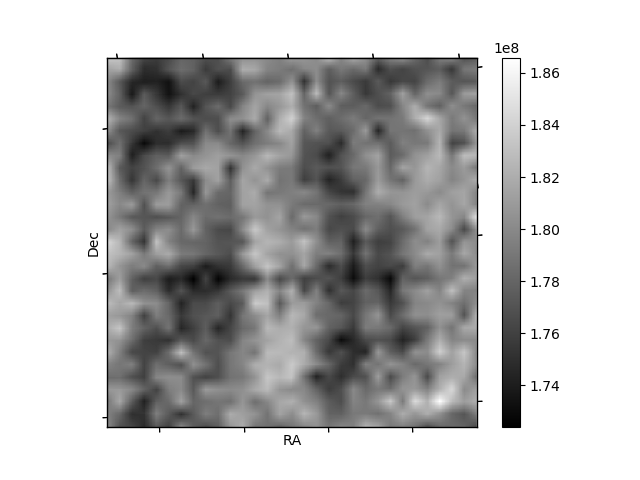
Histogram calculated using DETX and DETY for each event in the final _common_clean file
| Quadrant A | 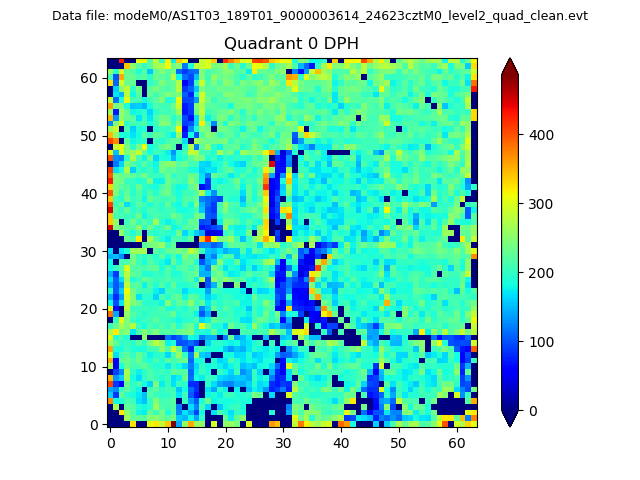 |
 |
Quadrant B |
|---|---|---|---|
| Quadrant D | 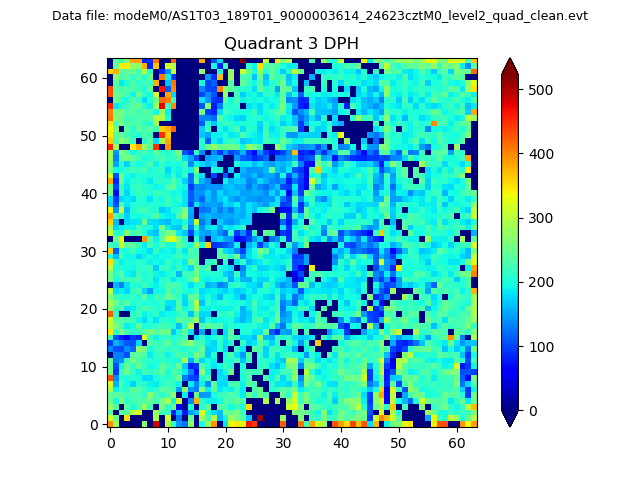 |
 |
Quadrant C |
| Plot type | Count rate plots | Images |
|---|---|---|
| Comparison with Poisson distribution Blue bars denote a histogram of data divided into 1 sec bins. Red curve is a Poisson curve with rate = median count rate of data. |
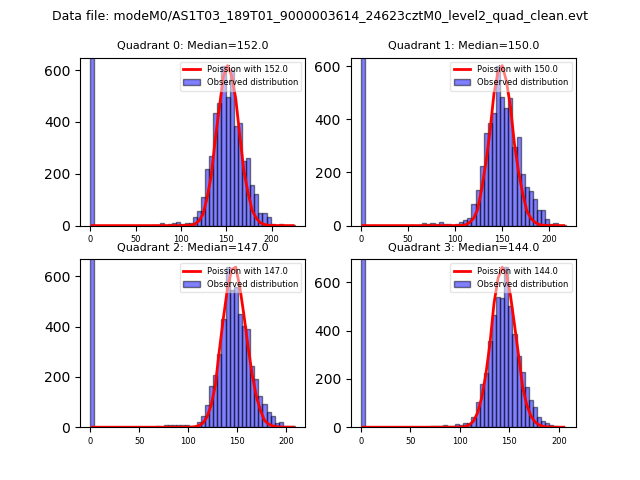 |
 |
| Quadrant-wise count rates Data is divided into 100 sec bins |
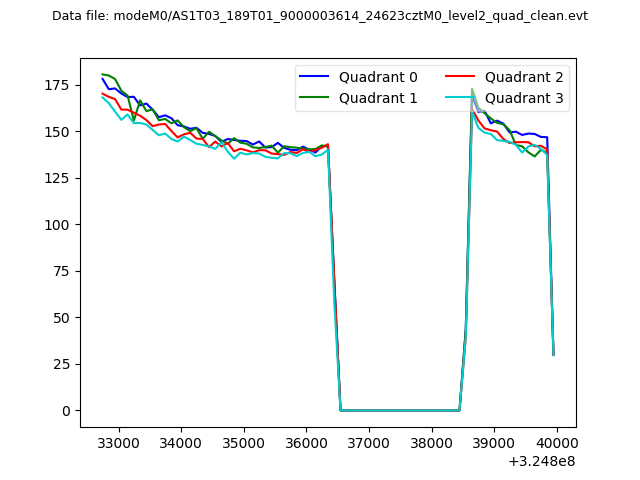 |
|
| Module-wise count rates for Quadrant A Data is divided into 100 sec bins |
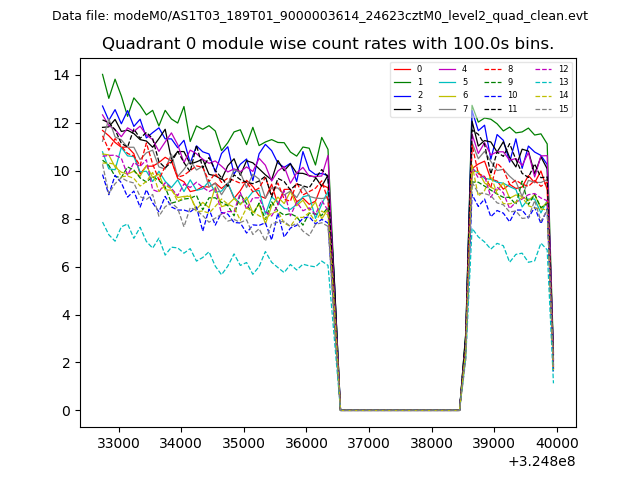 |
 |
| Module-wise count rates for Quadrant B Data is divided into 100 sec bins |
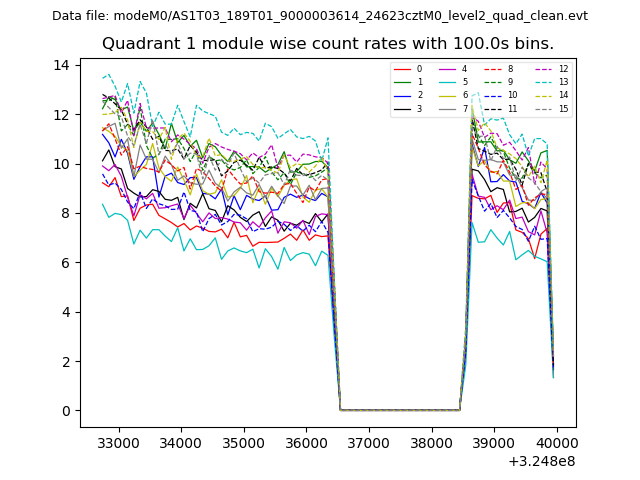 |
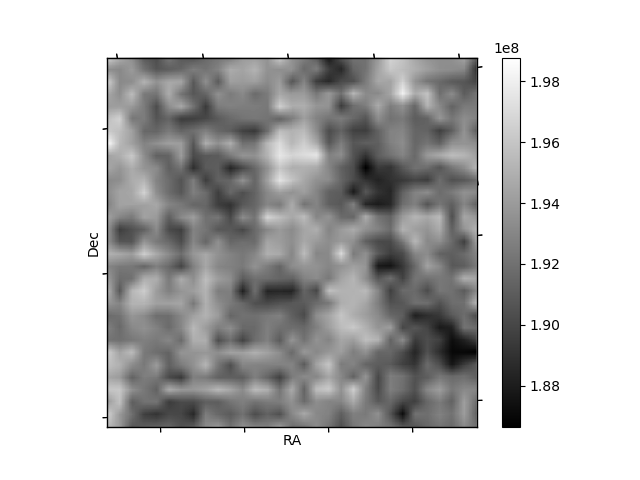 |
| Module-wise count rates for Quadrant C Data is divided into 100 sec bins |
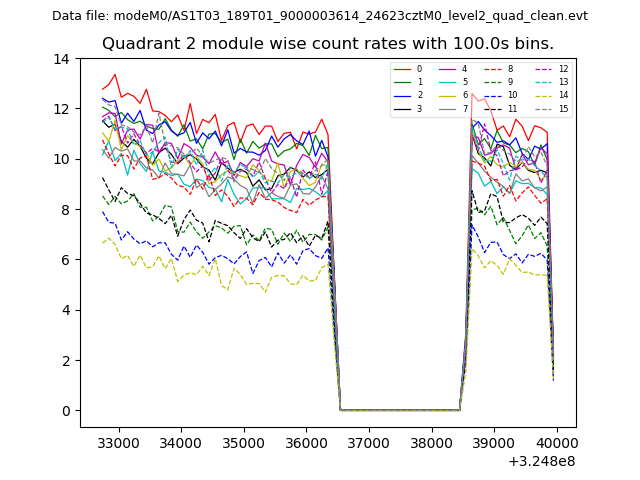 |
 |
| Module-wise count rates for Quadrant D Data is divided into 100 sec bins |
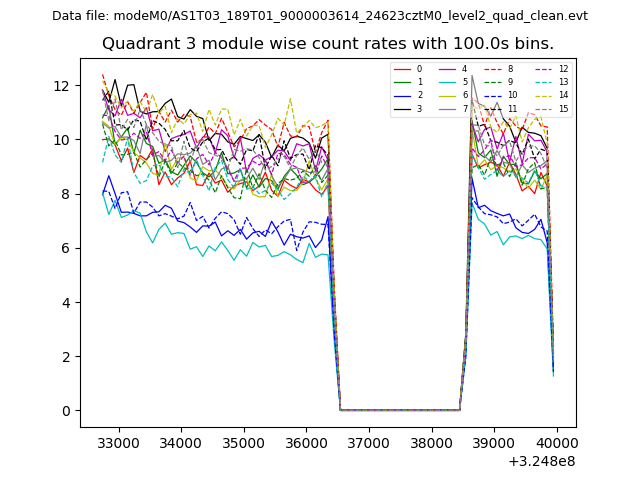 |
 |
| Parameter | Plot |
|---|---|
| CZT HV Monitor | 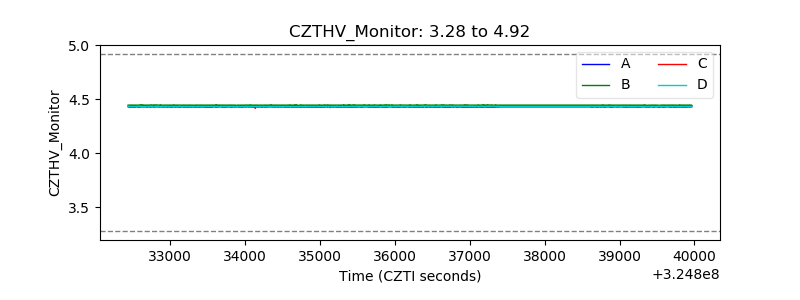 |
| D_VDD |  |
| Temperature 1 | 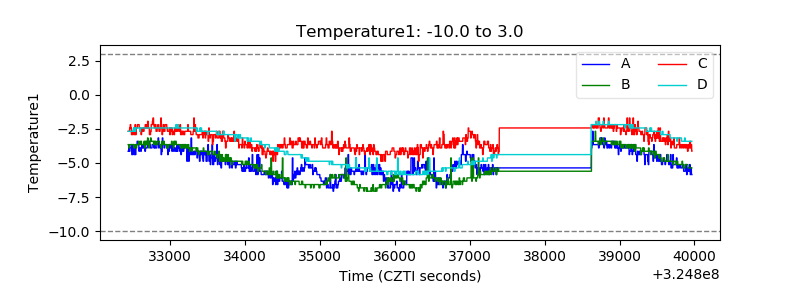 |
| Veto HV Monitor | 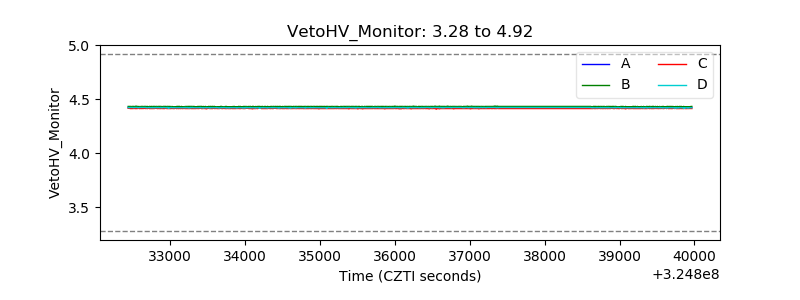 |
| Veto LLD | 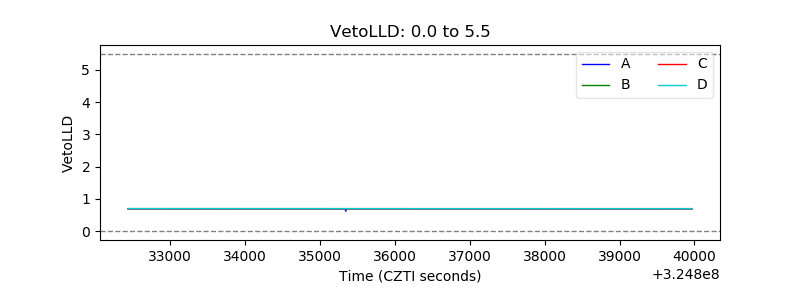 |
| Alpha Counter | 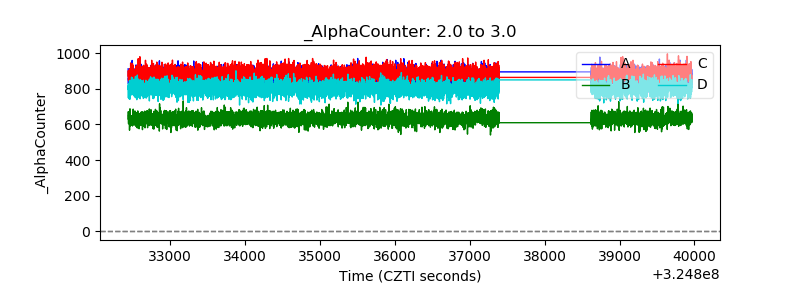 |
| _CPM_Rate | 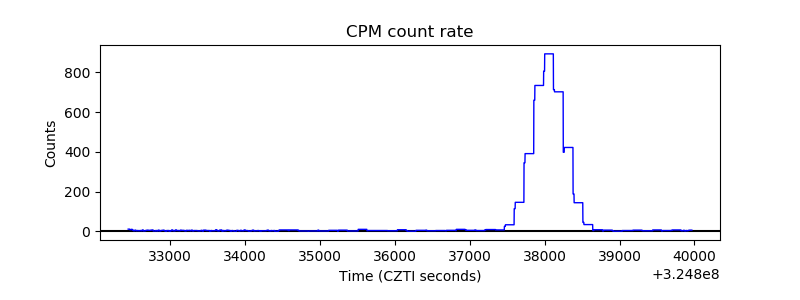 |
| CZT Counter | 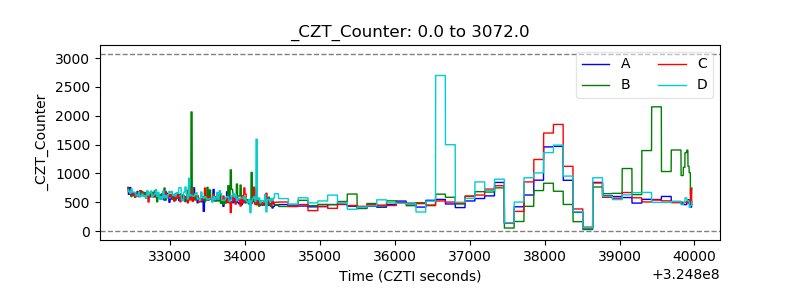 |
| +2.5 Volts monitor |  |
| +5 Volts monitor | 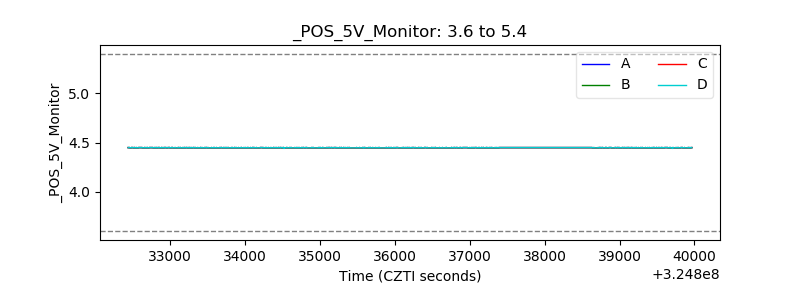 |
| _ROLL_ROT | 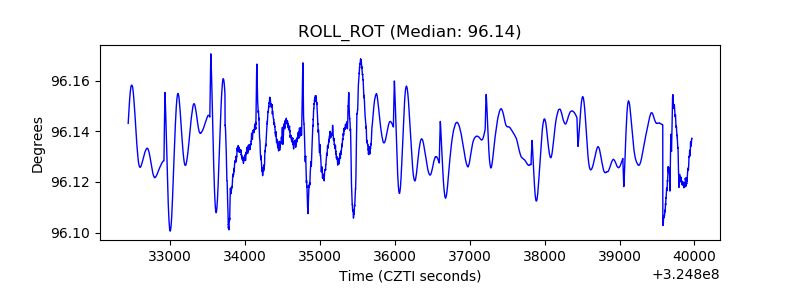 |
| _Roll_DEC | 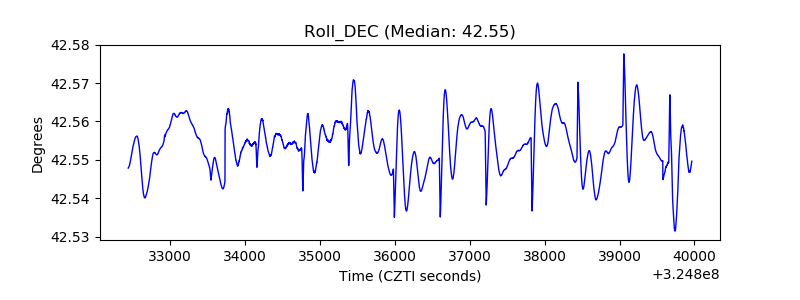 |
| _Roll_RA | 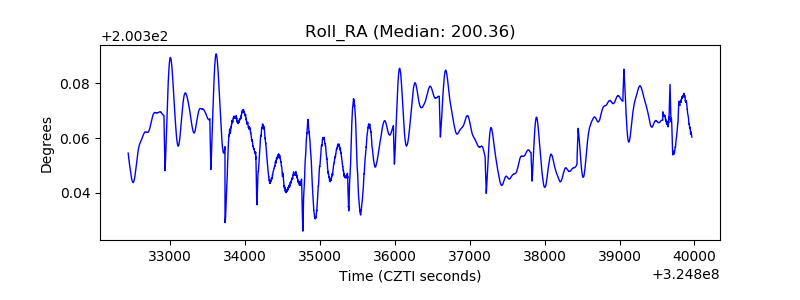 |
| Veto Counter | 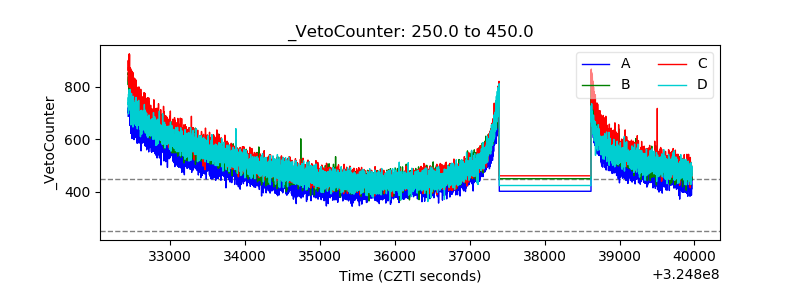 |