| Param | Original file | Final file |
|---|---|---|
| Filename | modeM0/AS1T03_189T01_9000003614_24626cztM0_level2.evt | modeM0/AS1T03_189T01_9000003614_24626cztM0_level2_quad_clean.evt |
| Size (bytes) | 574,073,280 | 118,454,400 |
| Size | 547.5 MB | 113.0 MB |
| Events in quadrant A | 3,969,065 | 768,711 |
| Events in quadrant B | 4,285,214 | 771,990 |
| Events in quadrant C | 4,635,759 | 742,448 |
| Events in quadrant D | 3,944,773 | 739,957 |
| Mode M9 | |||
|---|---|---|---|
| Quadrant | BADHDUFLAG | Total packets | Discarded packets |
| A | 0 | 6 | 0 |
| B | 0 | 6 | 0 |
| C | 0 | 6 | 0 |
| D | 0 | 6 | 0 |
| Mode M0 | |||
|---|---|---|---|
| Quadrant | BADHDUFLAG | Total packets | Discarded packets |
| A | 0 | 17149 | 3 |
| B | 0 | 17935 | 3 |
| C | 0 | 19126 | 3 |
| D | 0 | 17271 | 3 |
| Mode SS | |||
|---|---|---|---|
| Quadrant | BADHDUFLAG | Total packets | Discarded packets |
| A | 0 | 168 | 0 |
| B | 0 | 168 | 0 |
| C | 0 | 168 | 0 |
| D | 0 | 168 | 0 |
| Quadrant | Total seconds | Saturated seconds | Saturation percentage |
|---|---|---|---|
| A | 8113 | 86 | 1.060027% |
| B | 8114 | 199 | 2.452551% |
| C | 8114 | 290 | 3.574070% |
| D | 8114 | 51 | 0.628543% |
Noise dominated data is calculated using 1-second bins in cleaned event files. If a bin has >2000 counts, and if more than 50% of those come from <1% of pixels, then it is considered to be noise-dominated and hence unusable.
| Quadrant | # 1 sec bins | Bins with >0 counts | Bins with >2000 counts | High rate bins dominated by noise | Noise dominated (total time) | Noise dominated (detector-on time) | Marked lightcurve |
|---|---|---|---|---|---|---|---|
| A | 8758 | 8116 | 0 | 0 | 0.00% | 0.00% | 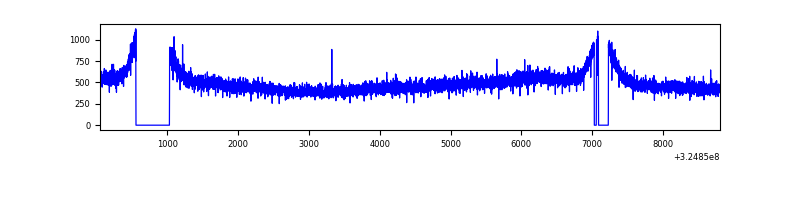 |
| B | 8759 | 8117 | 26 | 26 | 0.30% | 0.32% | 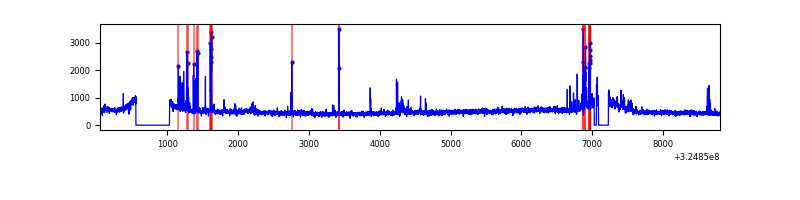 |
| C | 8759 | 8117 | 27 | 27 | 0.31% | 0.33% |  |
| D | 8759 | 8117 | 6 | 6 | 0.07% | 0.07% | 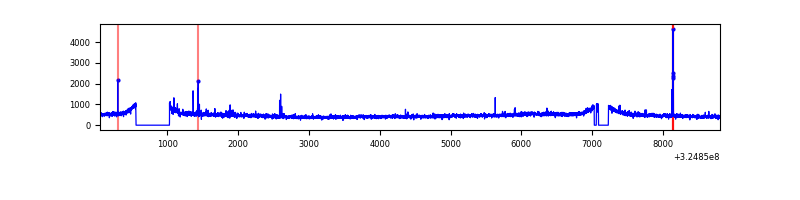 |
Top three noisy pixels from each quadrant. If the there are fewer than three noisy pixels in the level2.evt file, extra rows are filled as -1
| Pixel properties | Quadrant properties | ||||||
|---|---|---|---|---|---|---|---|
| Quadrant | DetID | PixID | Counts | Sigma | Mean | Median | Sigma |
| A | 13 | 254 | 12700 | 57.02 | 1025 | 1002 | 205.2 |
| A | 6 | 16 | 10116 | 44.42 | 1025 | 1002 | 205.2 |
| A | 3 | 137 | 10002 | 43.87 | 1025 | 1002 | 205.2 |
| B | 3 | 64 | 293694 | 1487.36 | 1010 | 981 | 196.8 |
| B | 12 | 111 | 24624 | 120.14 | 1010 | 981 | 196.8 |
| B | 4 | 216 | 23444 | 114.14 | 1010 | 981 | 196.8 |
| C | 7 | 247 | 384187 | 1647.88 | 984 | 992 | 232.5 |
| C | 9 | 54 | 223745 | 957.92 | 984 | 992 | 232.5 |
| C | 14 | 238 | 155075 | 662.61 | 984 | 992 | 232.5 |
| D | 8 | 195 | 78087 | 314.71 | 1004 | 976 | 245.0 |
| D | 2 | 234 | 40130 | 159.8 | 1004 | 976 | 245.0 |
| D | 1 | 52 | 20254 | 78.68 | 1004 | 976 | 245.0 |
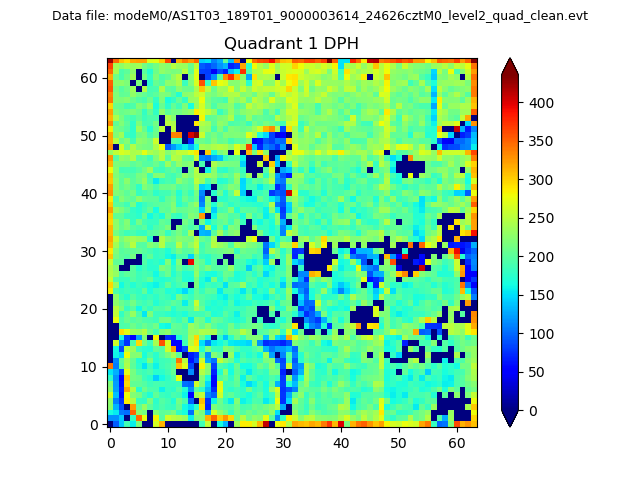
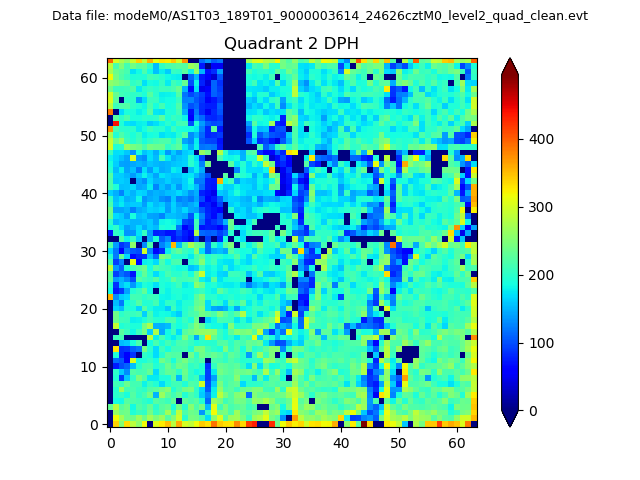
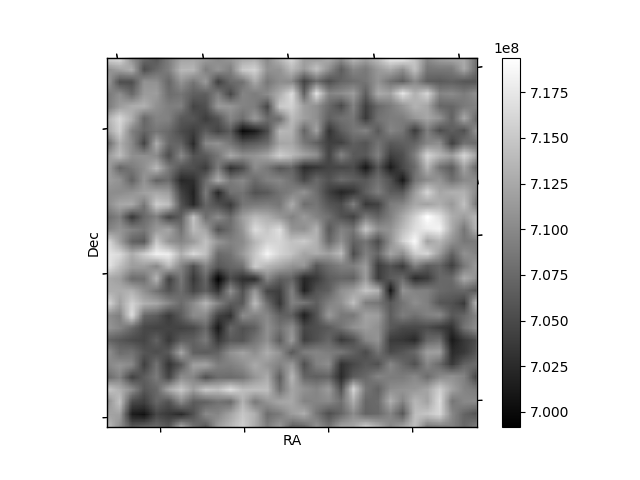
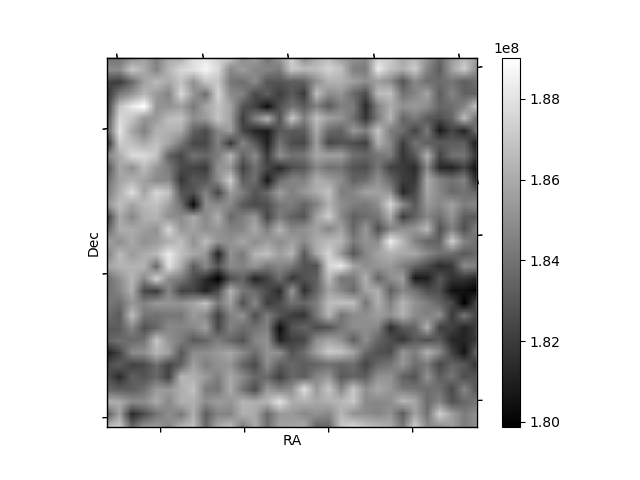
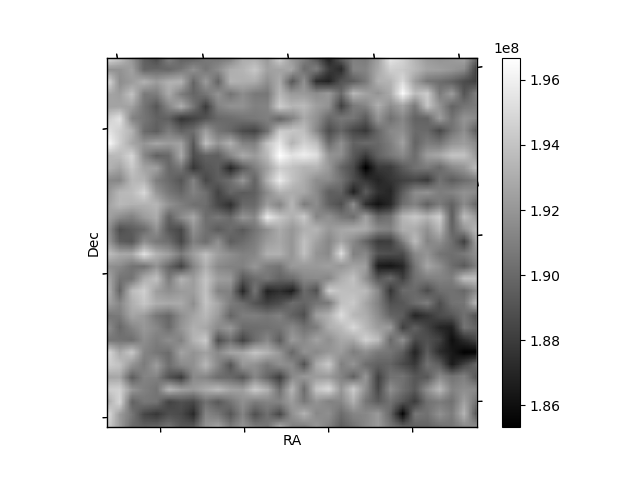
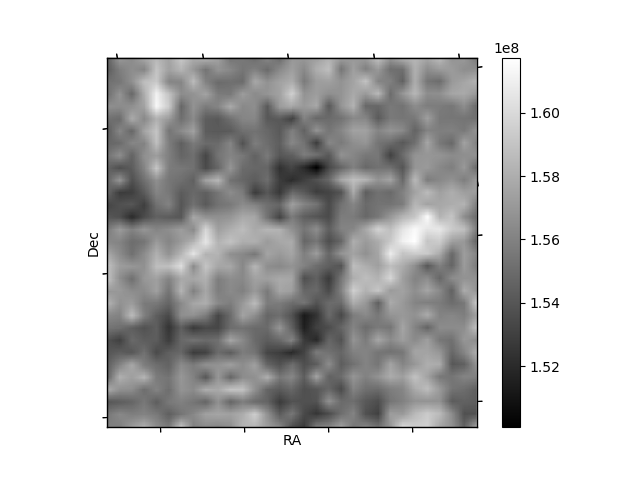
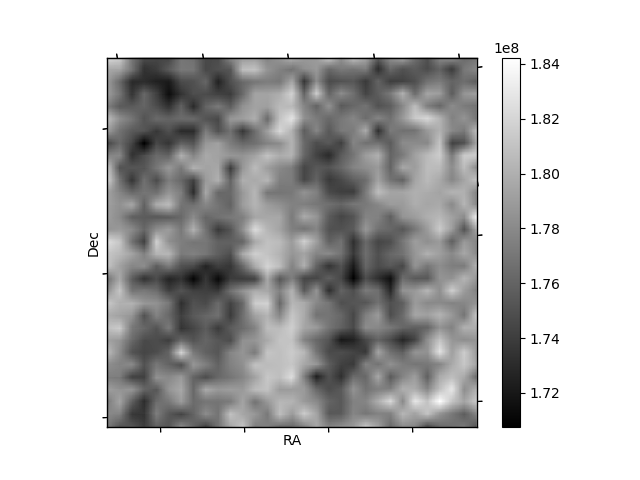
Histogram calculated using DETX and DETY for each event in the final _common_clean file
| Quadrant A | 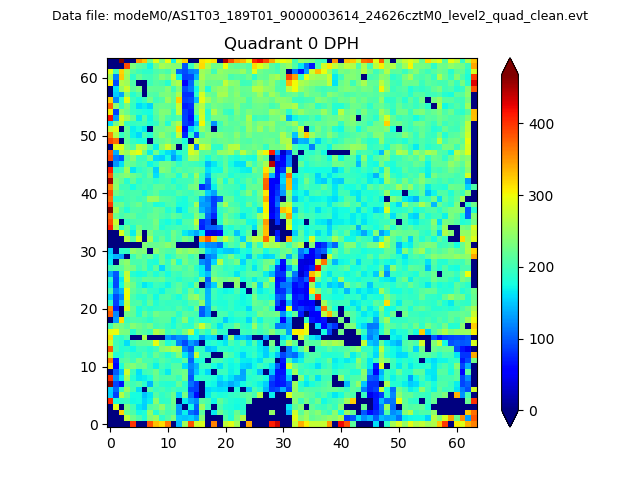 |
 |
Quadrant B |
|---|---|---|---|
| Quadrant D | 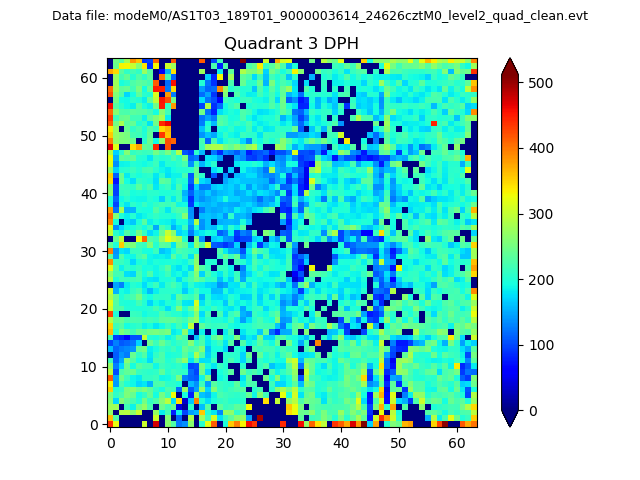 |
 |
Quadrant C |
| Plot type | Count rate plots | Images |
|---|---|---|
| Comparison with Poisson distribution Blue bars denote a histogram of data divided into 1 sec bins. Red curve is a Poisson curve with rate = median count rate of data. |
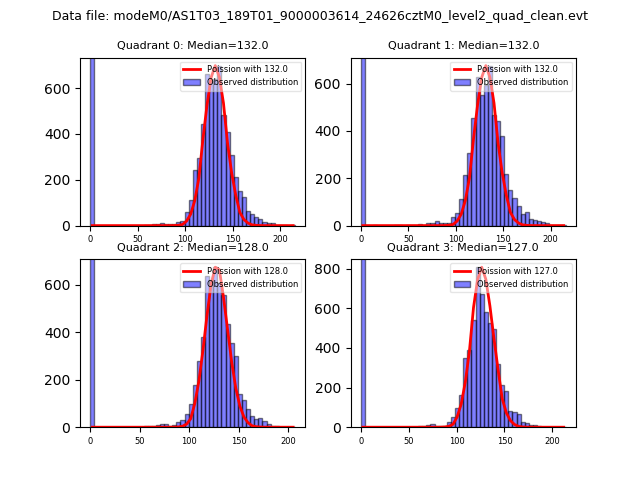 |
 |
| Quadrant-wise count rates Data is divided into 100 sec bins |
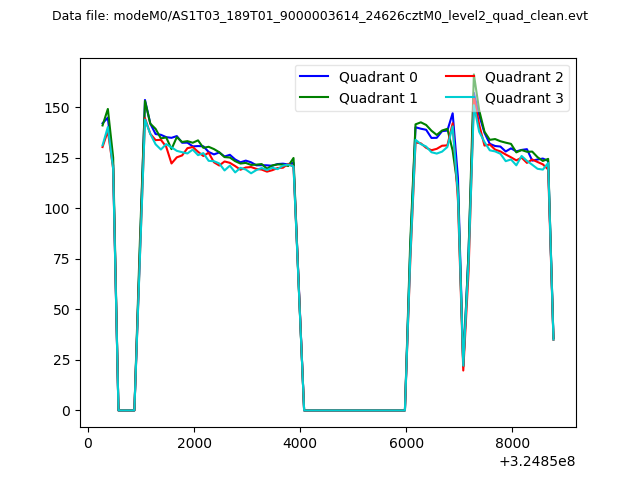 |
|
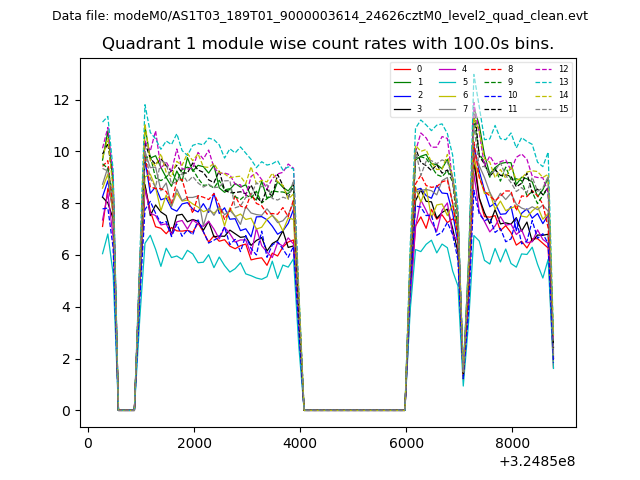
| Module-wise count rates for Quadrant A Data is divided into 100 sec bins |
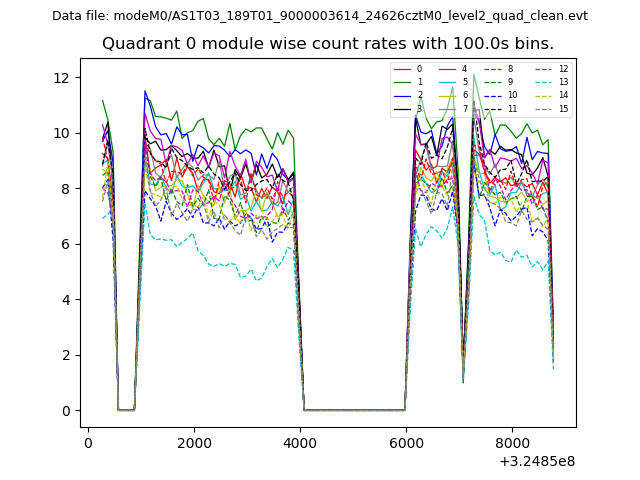 |
 |
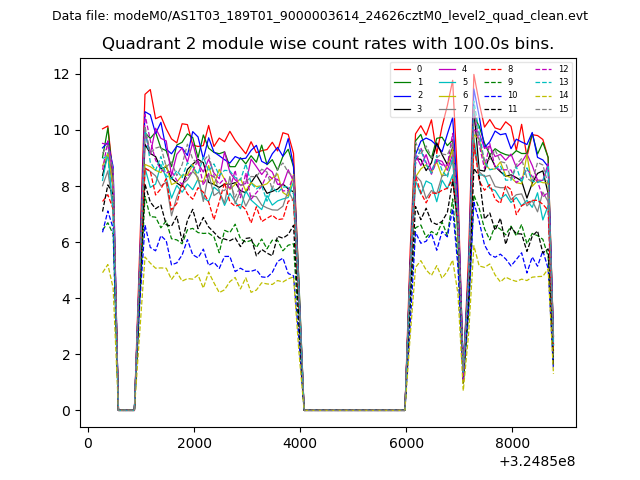
| Module-wise count rates for Quadrant B Data is divided into 100 sec bins |
 |
 |
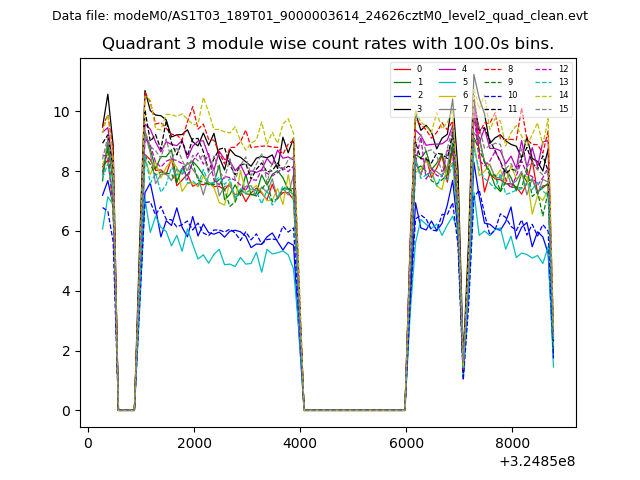
| Module-wise count rates for Quadrant C Data is divided into 100 sec bins |
 |
 |
| Module-wise count rates for Quadrant D Data is divided into 100 sec bins |
 |
 |
| Parameter | Plot |
|---|---|
| CZT HV Monitor | 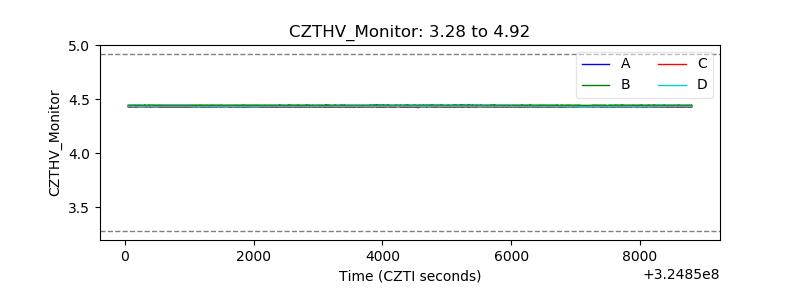 |
| D_VDD | 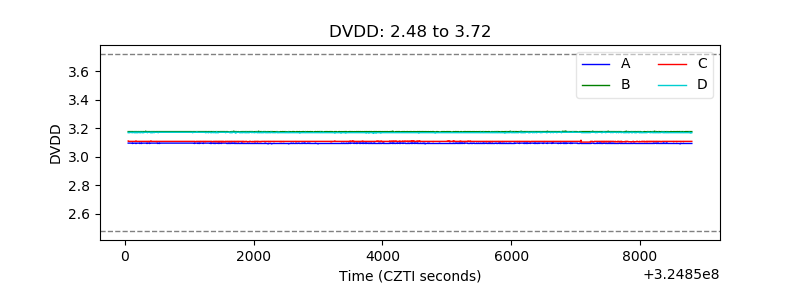 |
| Temperature 1 | 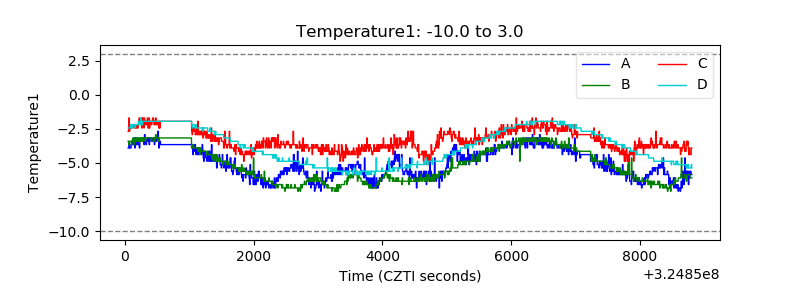 |
| Veto HV Monitor |  |
| Veto LLD | 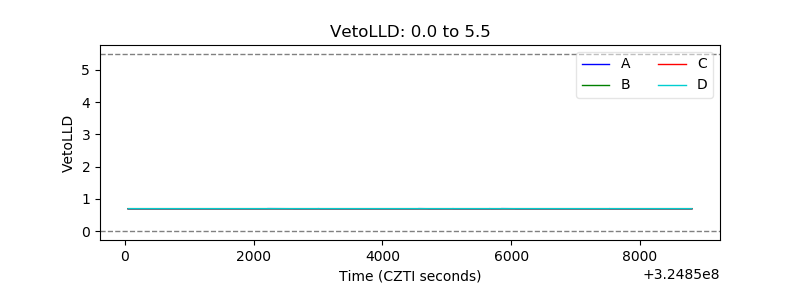 |
| Alpha Counter | 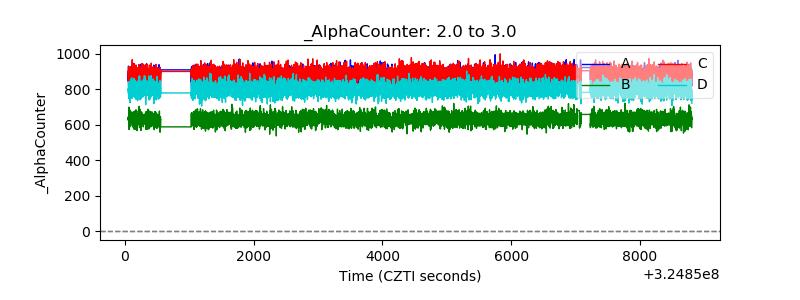 |
| _CPM_Rate | 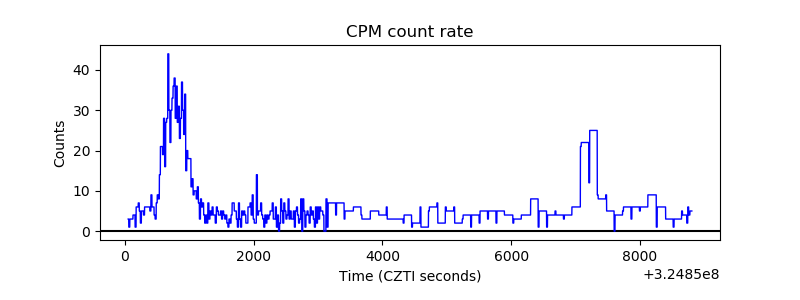 |
| CZT Counter | 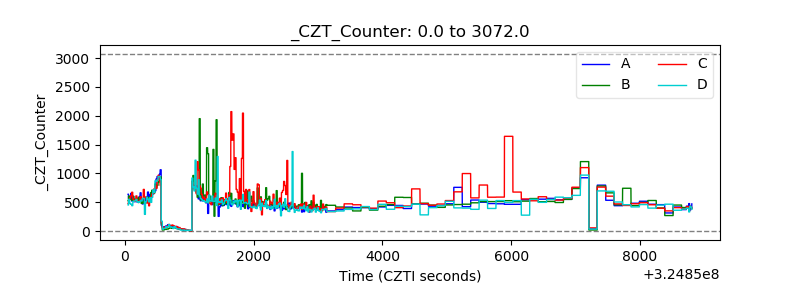 |
| +2.5 Volts monitor |  |
| +5 Volts monitor |  |
| _ROLL_ROT | 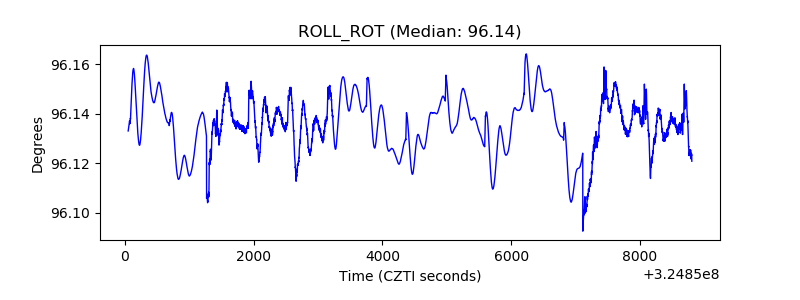 |
| _Roll_DEC | 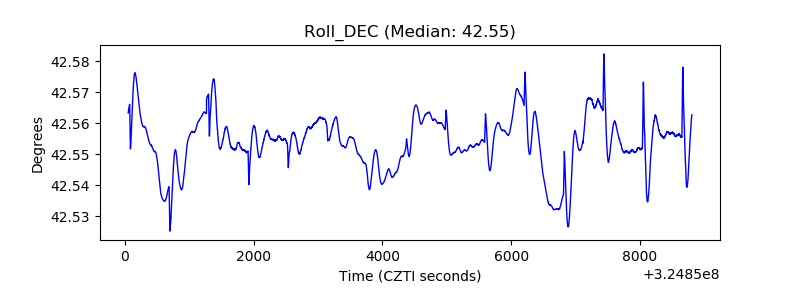 |
| _Roll_RA | 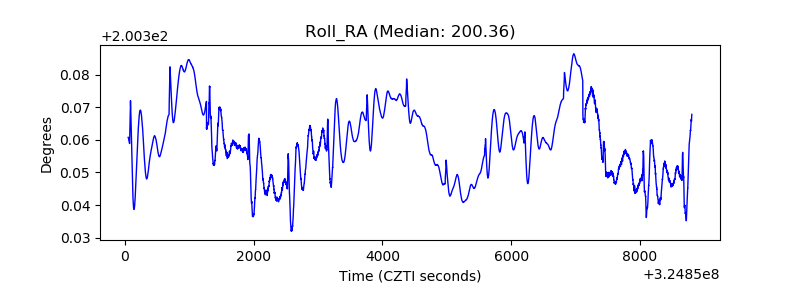 |
| Veto Counter | 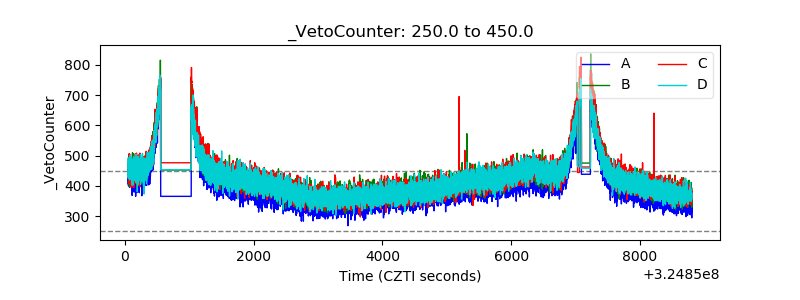 |