| Param | Original file | Final file |
|---|---|---|
| Filename | modeM0/AS1T03_189T01_9000003614_24627cztM0_level2.evt | modeM0/AS1T03_189T01_9000003614_24627cztM0_level2_quad_clean.evt |
| Size (bytes) | 703,391,040 | 121,881,600 |
| Size | 670.8 MB | 116.2 MB |
| Events in quadrant A | 3,959,098 | 807,468 |
| Events in quadrant B | 4,823,415 | 810,729 |
| Events in quadrant C | 7,483,871 | 725,672 |
| Events in quadrant D | 4,476,966 | 773,742 |
| Mode M9 | |||
|---|---|---|---|
| Quadrant | BADHDUFLAG | Total packets | Discarded packets |
| A | 0 | 3 | 0 |
| B | 0 | 3 | 0 |
| C | 0 | 3 | 0 |
| D | 0 | 3 | 0 |
| Mode M0 | |||
|---|---|---|---|
| Quadrant | BADHDUFLAG | Total packets | Discarded packets |
| A | 0 | 17293 | 3 |
| B | 0 | 19811 | 3 |
| C | 0 | 27918 | 3 |
| D | 0 | 18897 | 3 |
| Mode SS | |||
|---|---|---|---|
| Quadrant | BADHDUFLAG | Total packets | Discarded packets |
| A | 0 | 172 | 0 |
| B | 0 | 172 | 0 |
| C | 0 | 172 | 0 |
| D | 0 | 172 | 0 |
| Quadrant | Total seconds | Saturated seconds | Saturation percentage |
|---|---|---|---|
| A | 8239 | 60 | 0.728244% |
| B | 8240 | 383 | 4.648058% |
| C | 8240 | 1496 | 18.155340% |
| D | 8240 | 173 | 2.099515% |
Noise dominated data is calculated using 1-second bins in cleaned event files. If a bin has >2000 counts, and if more than 50% of those come from <1% of pixels, then it is considered to be noise-dominated and hence unusable.
| Quadrant | # 1 sec bins | Bins with >0 counts | Bins with >2000 counts | High rate bins dominated by noise | Noise dominated (total time) | Noise dominated (detector-on time) | Marked lightcurve |
|---|---|---|---|---|---|---|---|
| A | 8694 | 8242 | 0 | 0 | 0.00% | 0.00% | 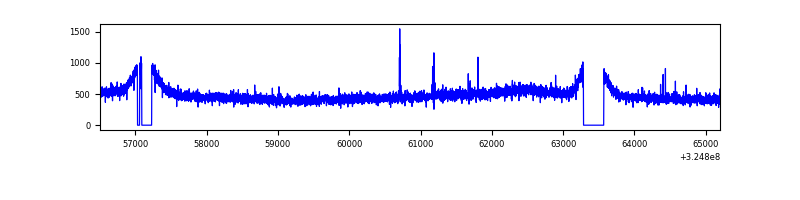 |
| B | 8695 | 8243 | 156 | 156 | 1.79% | 1.89% | 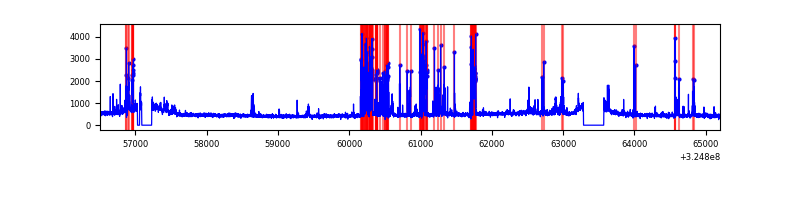 |
| C | 8695 | 8243 | 653 | 653 | 7.51% | 7.92% | 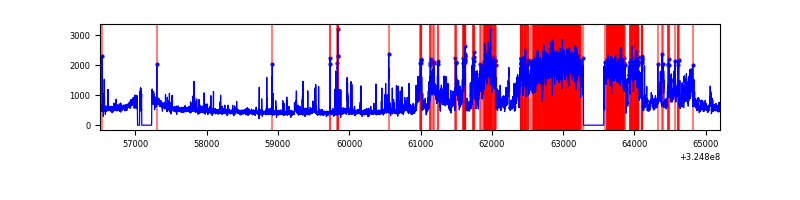 |
| D | 8695 | 8243 | 117 | 117 | 1.35% | 1.42% | 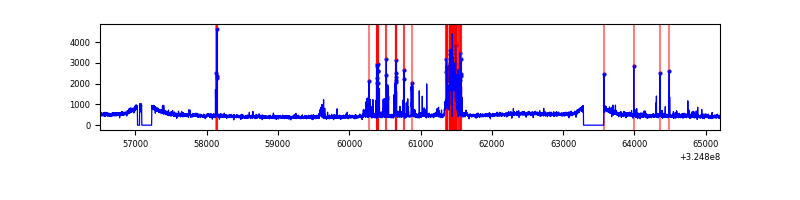 |
Top three noisy pixels from each quadrant. If the there are fewer than three noisy pixels in the level2.evt file, extra rows are filled as -1
| Pixel properties | Quadrant properties | ||||||
|---|---|---|---|---|---|---|---|
| Quadrant | DetID | PixID | Counts | Sigma | Mean | Median | Sigma |
| A | 12 | 96 | 13923 | 62.93 | 1020 | 997 | 205.4 |
| A | 13 | 254 | 11685 | 52.03 | 1020 | 997 | 205.4 |
| A | 6 | 16 | 10967 | 48.54 | 1020 | 997 | 205.4 |
| B | 3 | 64 | 873113 | 4489.13 | 997 | 968 | 194.3 |
| B | 5 | 172 | 28551 | 141.97 | 997 | 968 | 194.3 |
| B | 12 | 111 | 24334 | 120.27 | 997 | 968 | 194.3 |
| C | 7 | 247 | 3638993 | 16479.39 | 938 | 947 | 220.8 |
| C | 14 | 238 | 146487 | 659.26 | 938 | 947 | 220.8 |
| C | 3 | 233 | 25888 | 112.98 | 938 | 947 | 220.8 |
| D | 7 | 238 | 357891 | 1471.45 | 993 | 963 | 242.6 |
| D | 9 | 1 | 175704 | 720.37 | 993 | 963 | 242.6 |
| D | 8 | 195 | 127512 | 521.7 | 993 | 963 | 242.6 |
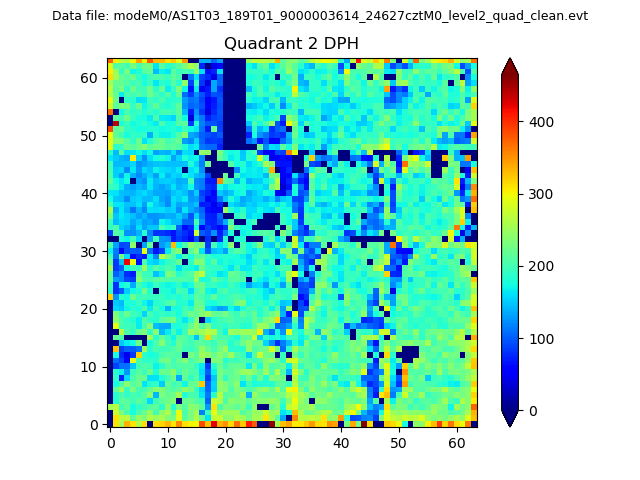
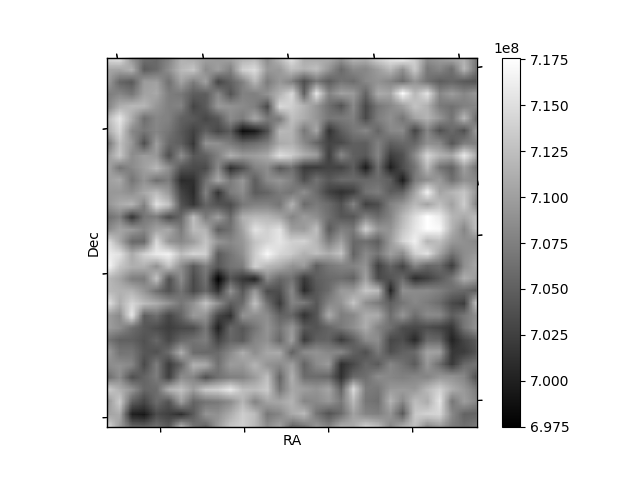
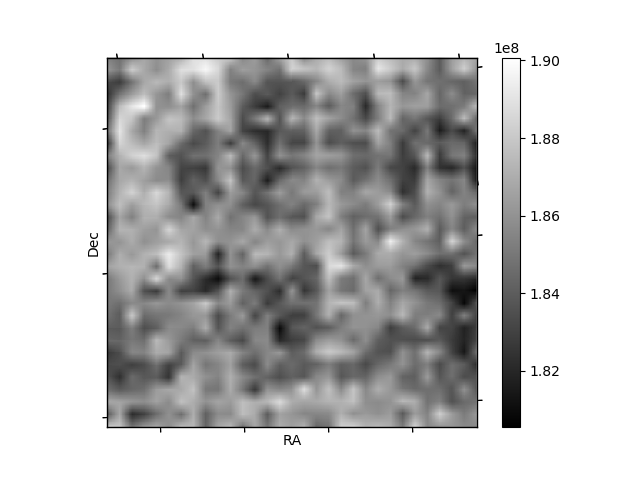
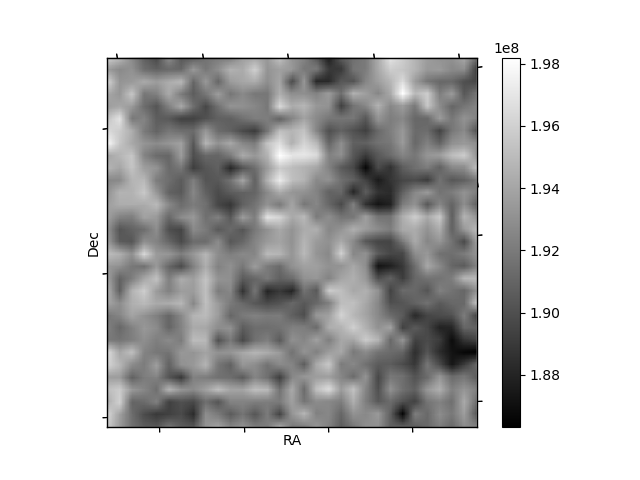
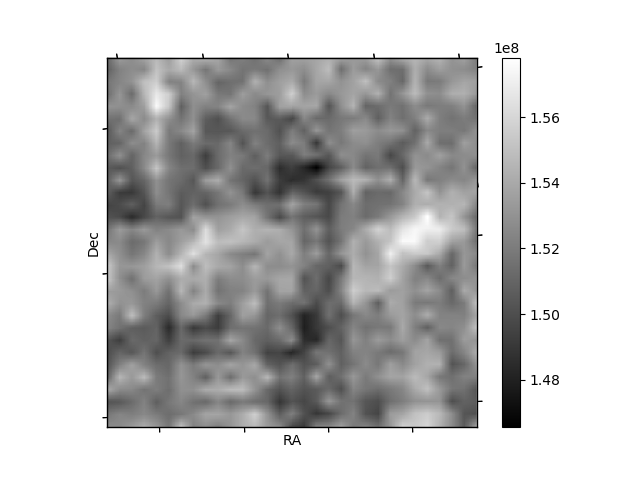
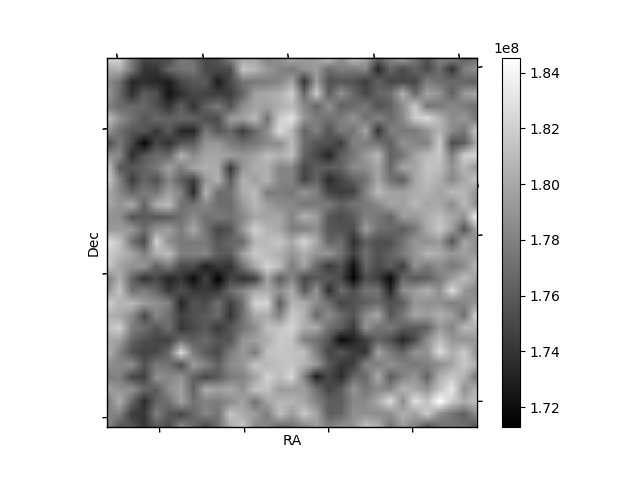
Histogram calculated using DETX and DETY for each event in the final _common_clean file
| Quadrant A | 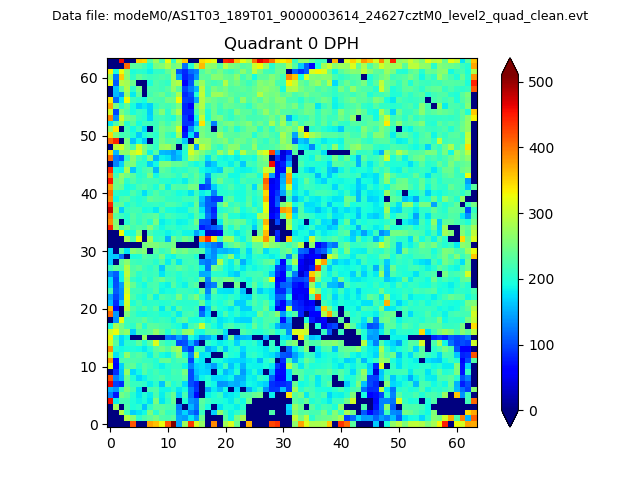 |
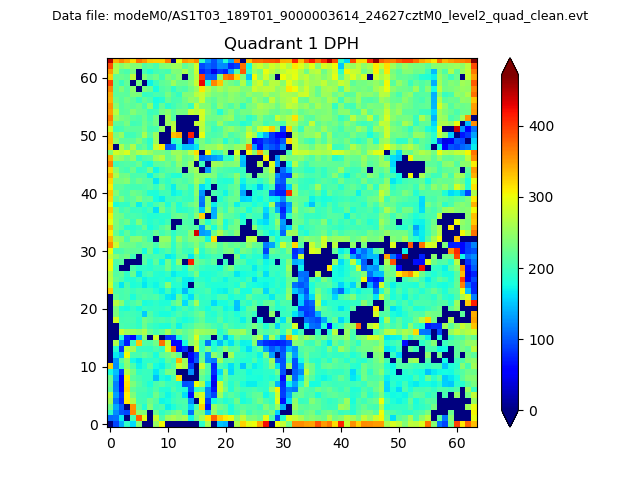 |
Quadrant B |
|---|---|---|---|
| Quadrant D | 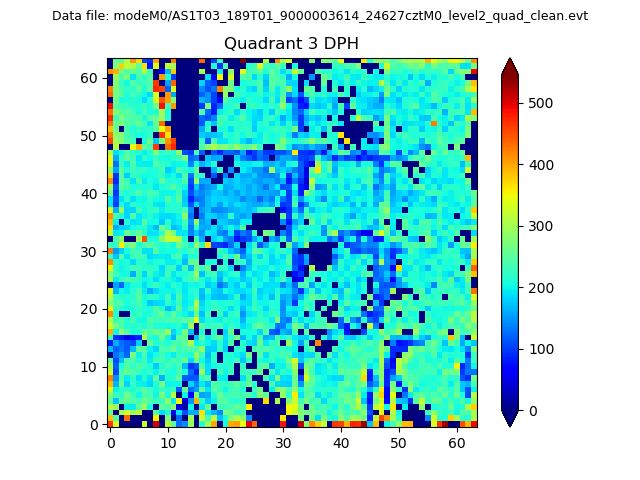 |
 |
Quadrant C |
| Plot type | Count rate plots | Images |
|---|---|---|
| Comparison with Poisson distribution Blue bars denote a histogram of data divided into 1 sec bins. Red curve is a Poisson curve with rate = median count rate of data. |
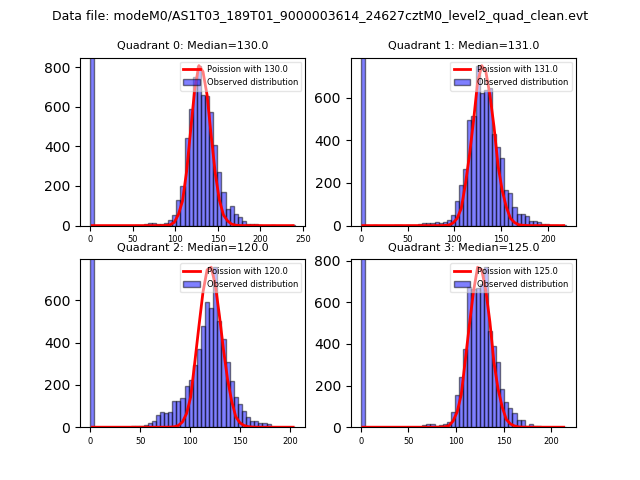 |
 |
| Quadrant-wise count rates Data is divided into 100 sec bins |
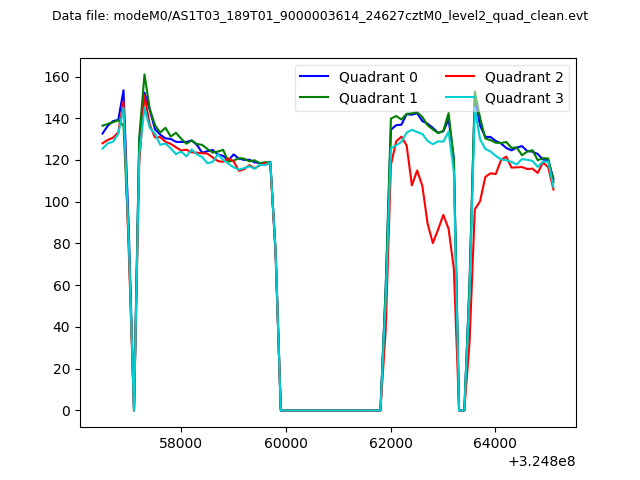 |
|
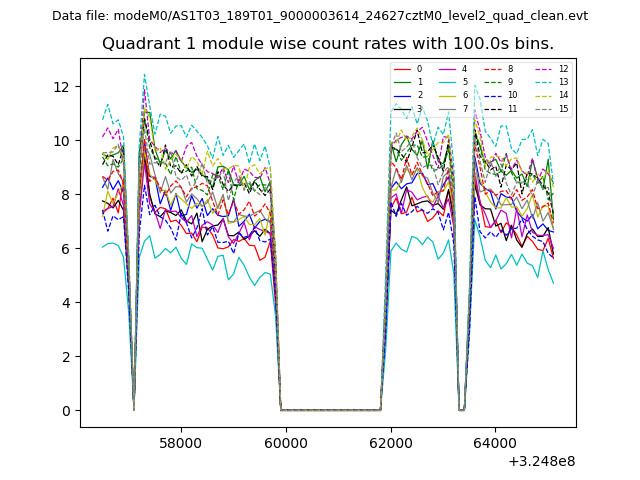
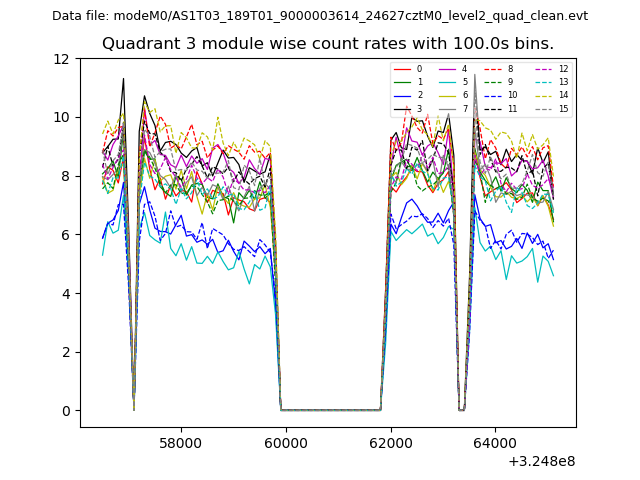
| Module-wise count rates for Quadrant A Data is divided into 100 sec bins |
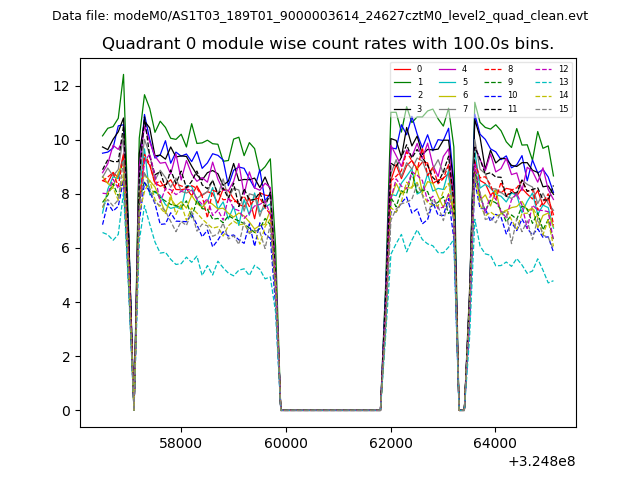 |
 |
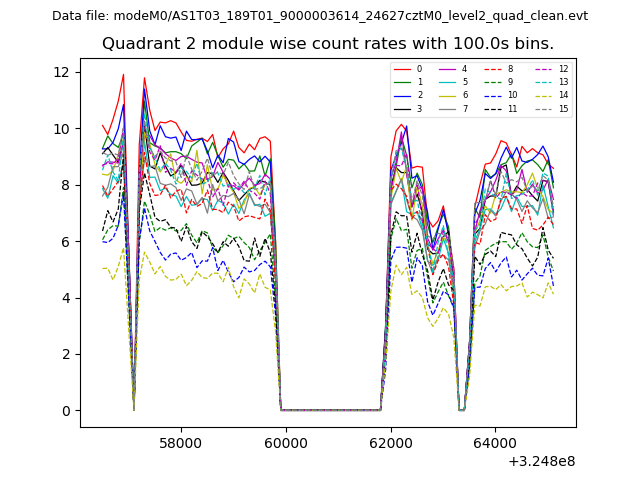
| Module-wise count rates for Quadrant B Data is divided into 100 sec bins |
 |
 |
| Module-wise count rates for Quadrant C Data is divided into 100 sec bins |
 |
 |
| Module-wise count rates for Quadrant D Data is divided into 100 sec bins |
 |
 |
| Parameter | Plot |
|---|---|
| CZT HV Monitor | 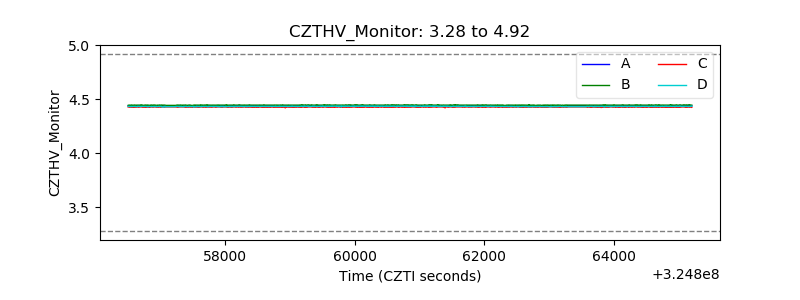 |
| D_VDD | 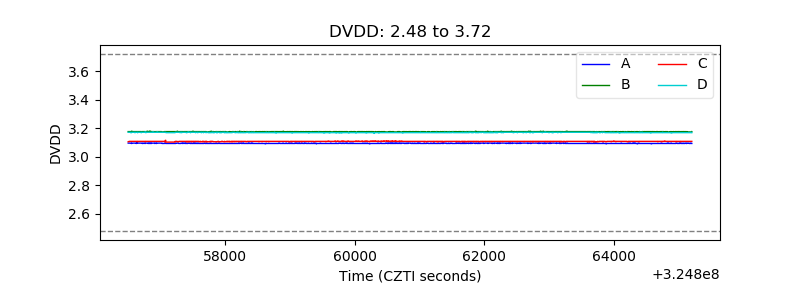 |
| Temperature 1 | 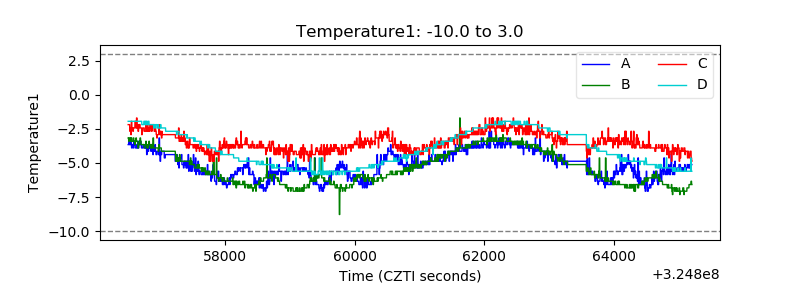 |
| Veto HV Monitor | 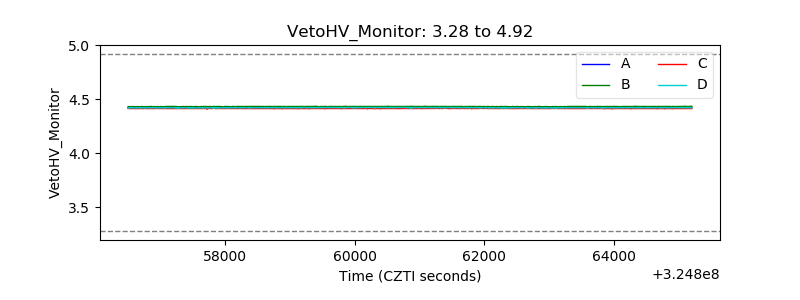 |
| Veto LLD | 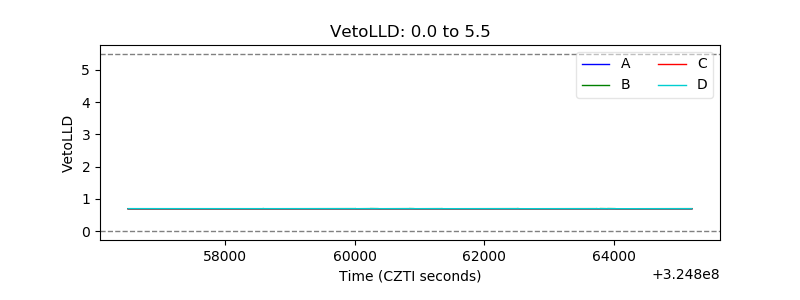 |
| Alpha Counter | 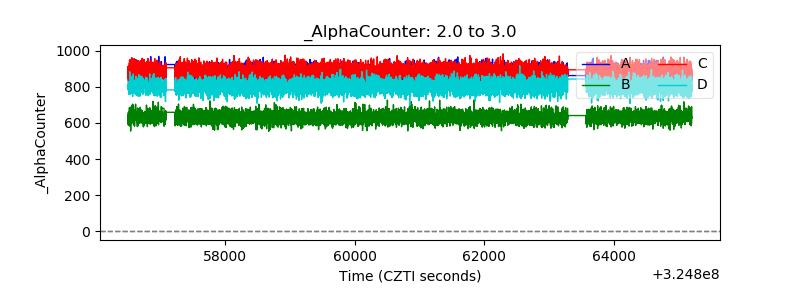 |
| _CPM_Rate | 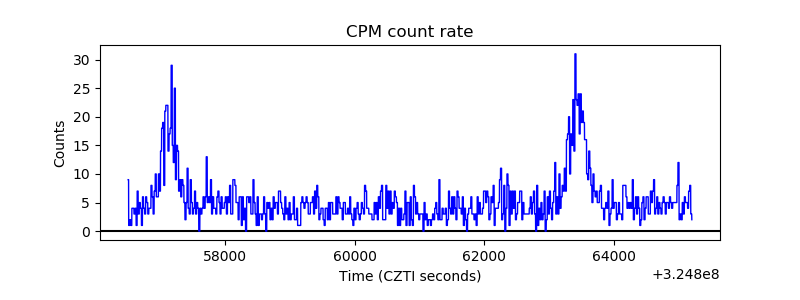 |
| CZT Counter | 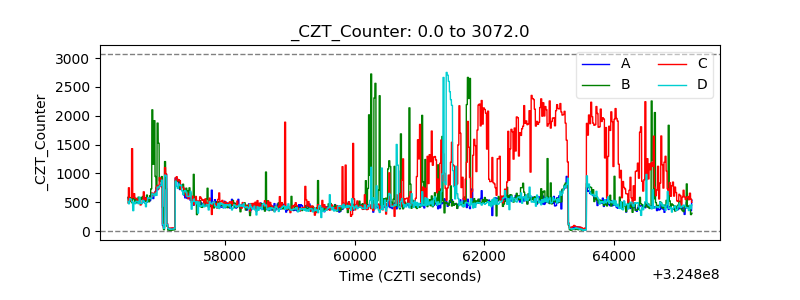 |
| +2.5 Volts monitor |  |
| +5 Volts monitor |  |
| _ROLL_ROT | 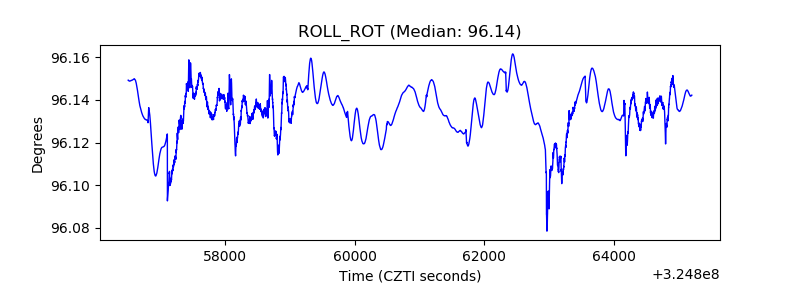 |
| _Roll_DEC | 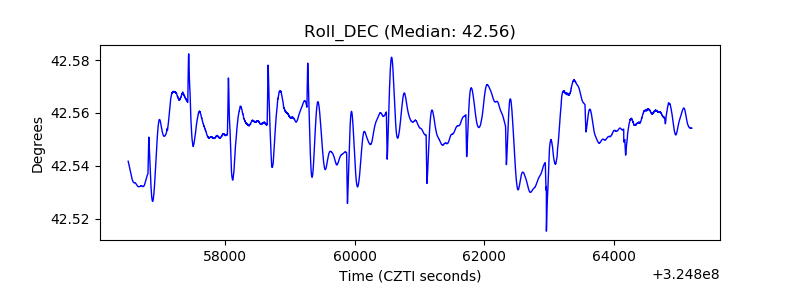 |
| _Roll_RA | 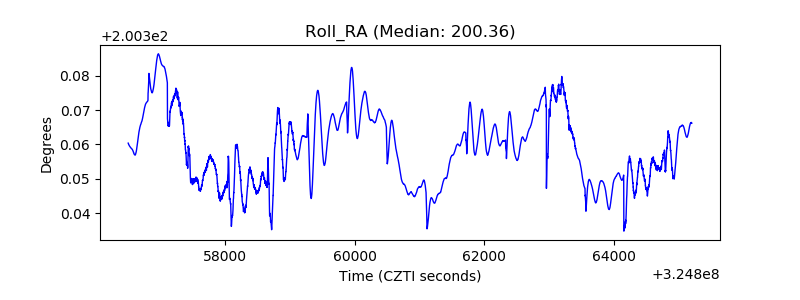 |
| Veto Counter | 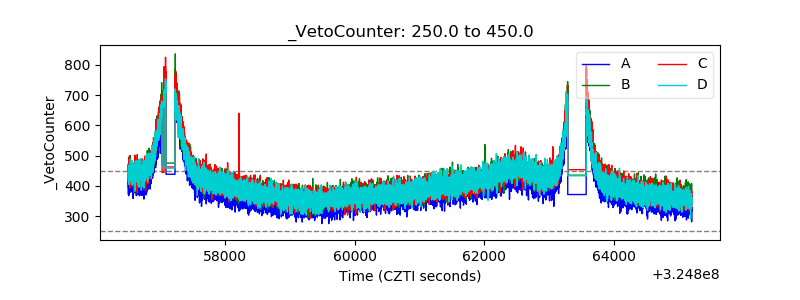 |