| Param | Original file | Final file |
|---|---|---|
| Filename | modeM0/AS1C05_012T06_9000003616_24631cztM0_level2.evt | modeM0/AS1C05_012T06_9000003616_24631cztM0_level2_quad_clean.evt |
| Size (bytes) | 599,875,200 | 107,605,440 |
| Size | 572.1 MB | 102.6 MB |
| Events in quadrant A | 2,779,718 | 738,534 |
| Events in quadrant B | 2,888,403 | 748,262 |
| Events in quadrant C | 8,708,223 | 654,067 |
| Events in quadrant D | 3,389,518 | 702,844 |
| Mode M0 | |||
|---|---|---|---|
| Quadrant | BADHDUFLAG | Total packets | Discarded packets |
| A | 0 | 12064 | 1 |
| B | 0 | 12307 | 1 |
| C | 0 | 30046 | 6 |
| D | 0 | 13864 | 1 |
| Mode SS | |||
|---|---|---|---|
| Quadrant | BADHDUFLAG | Total packets | Discarded packets |
| A | 0 | 120 | 0 |
| B | 0 | 120 | 0 |
| C | 0 | 120 | 0 |
| D | 0 | 120 | 0 |
| Mode M9 | |||
|---|---|---|---|
| Quadrant | BADHDUFLAG | Total packets | Discarded packets |
| A | 0 | 10 | 0 |
| B | 0 | 10 | 0 |
| C | 0 | 10 | 0 |
| D | 0 | 10 | 0 |
| Quadrant | Total seconds | Saturated seconds | Saturation percentage |
|---|---|---|---|
| A | 5942 | 47 | 0.790979% |
| B | 5943 | 71 | 1.194683% |
| C | 5942 | 952 | 16.021542% |
| D | 5942 | 116 | 1.952205% |
Noise dominated data is calculated using 1-second bins in cleaned event files. If a bin has >2000 counts, and if more than 50% of those come from <1% of pixels, then it is considered to be noise-dominated and hence unusable.
| Quadrant | # 1 sec bins | Bins with >0 counts | Bins with >2000 counts | High rate bins dominated by noise | Noise dominated (total time) | Noise dominated (detector-on time) | Marked lightcurve |
|---|---|---|---|---|---|---|---|
| A | 6912 | 5942 | 1 | 1 | 0.01% | 0.02% | 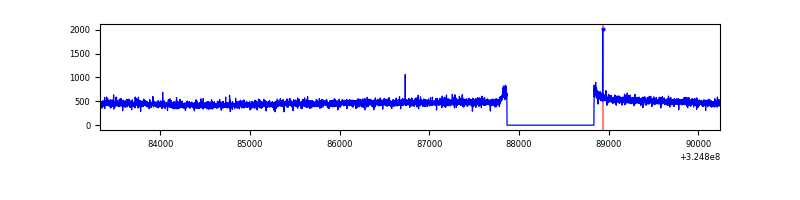 |
| B | 6913 | 5943 | 5 | 5 | 0.07% | 0.08% | 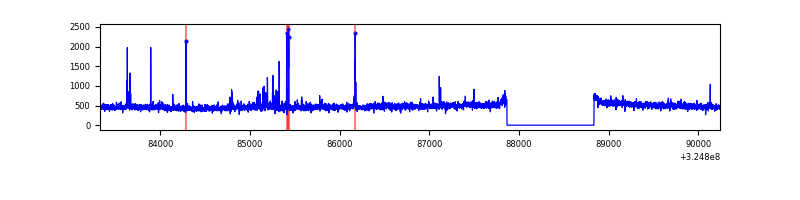 |
| C | 6912 | 5942 | 321 | 321 | 4.64% | 5.40% | 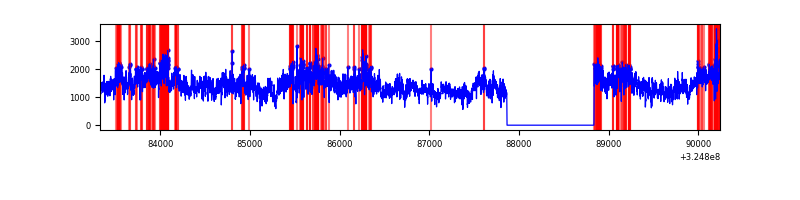 |
| D | 6912 | 5942 | 70 | 70 | 1.01% | 1.18% | 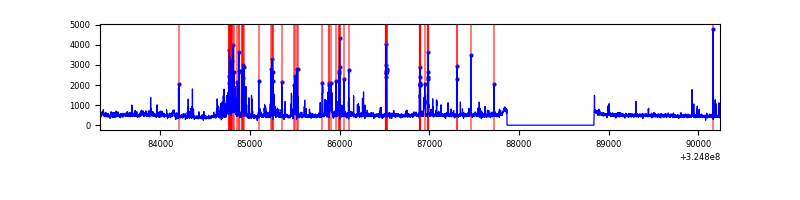 |
Top three noisy pixels from each quadrant. If the there are fewer than three noisy pixels in the level2.evt file, extra rows are filled as -1
| Pixel properties | Quadrant properties | ||||||
|---|---|---|---|---|---|---|---|
| Quadrant | DetID | PixID | Counts | Sigma | Mean | Median | Sigma |
| A | 6 | 16 | 16530 | 110.01 | 715 | 702 | 143.9 |
| A | 13 | 254 | 9929 | 64.13 | 715 | 702 | 143.9 |
| A | 3 | 137 | 6491 | 40.24 | 715 | 702 | 143.9 |
| B | 3 | 64 | 36009 | 259.08 | 710 | 693 | 136.3 |
| B | 0 | 230 | 22851 | 162.55 | 710 | 693 | 136.3 |
| B | 12 | 111 | 16512 | 116.05 | 710 | 693 | 136.3 |
| C | 7 | 247 | 5854428 | 38790.42 | 655 | 658 | 150.9 |
| C | 14 | 238 | 104287 | 686.7 | 655 | 658 | 150.9 |
| C | 10 | 91 | 101157 | 665.96 | 655 | 658 | 150.9 |
| D | 1 | 52 | 403090 | 2408.89 | 690 | 668 | 167.1 |
| D | 9 | 1 | 245185 | 1463.68 | 690 | 668 | 167.1 |
| D | 8 | 195 | 59803 | 353.98 | 690 | 668 | 167.1 |
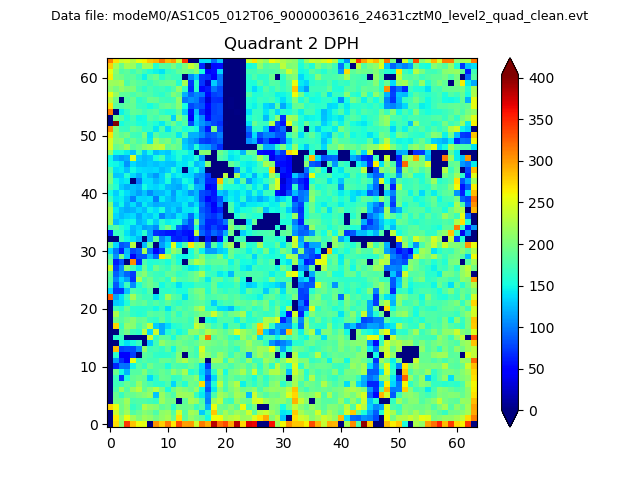
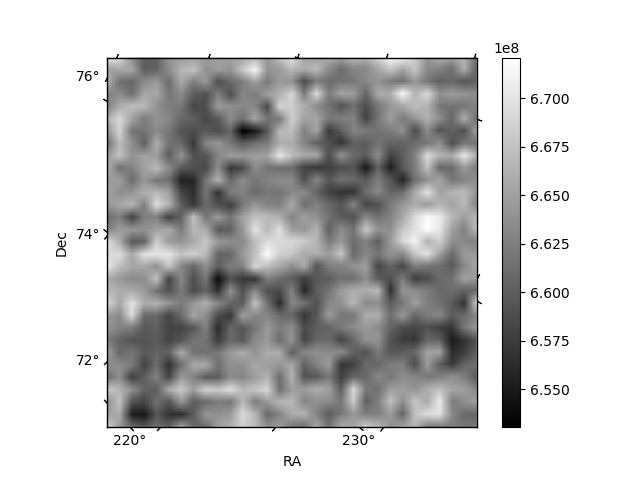
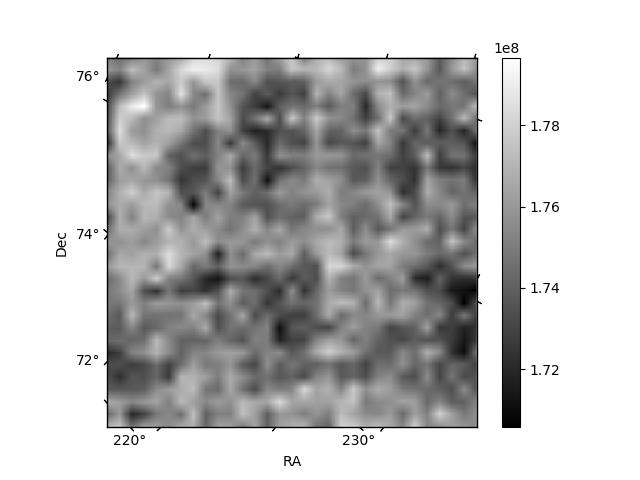
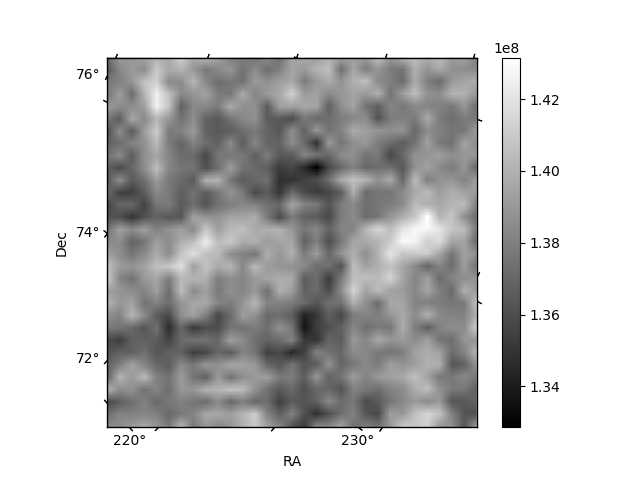
Histogram calculated using DETX and DETY for each event in the final _common_clean file
| Quadrant A | 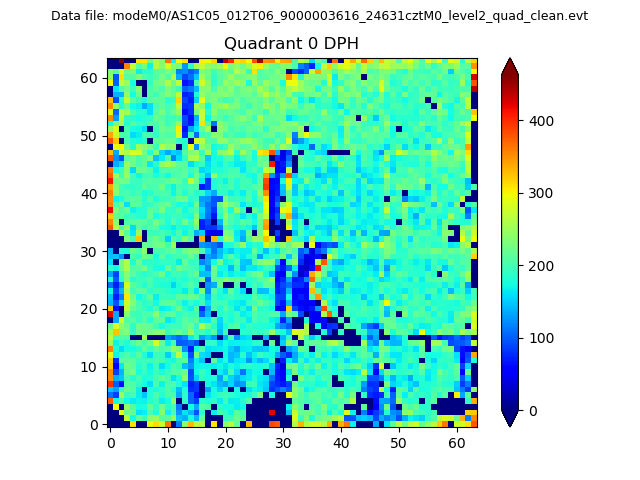 |
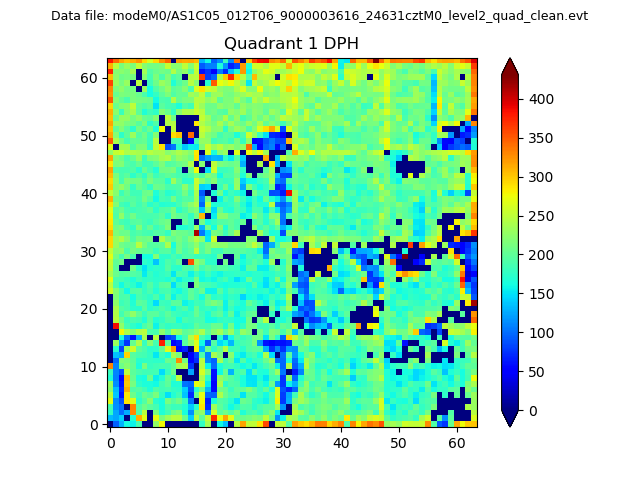 |
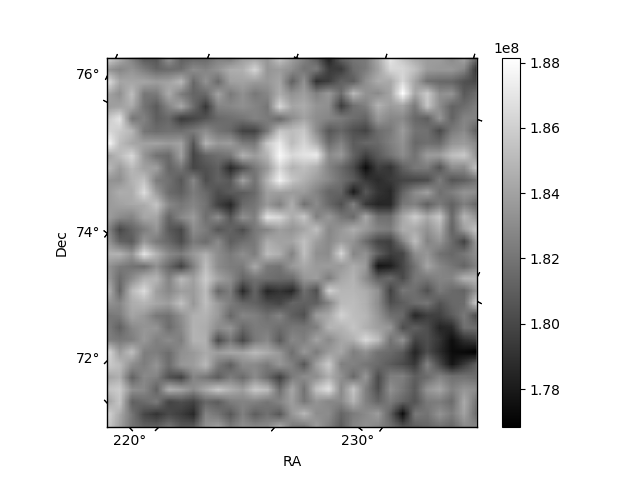
Quadrant B |
|---|---|---|---|
| Quadrant D | 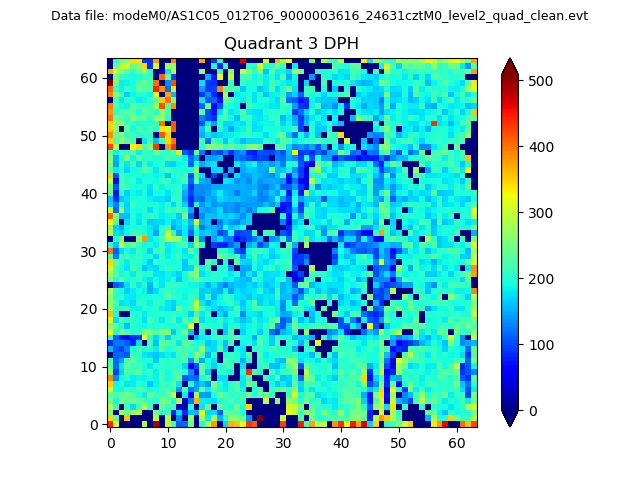 |
 |
Quadrant C |
| Plot type | Count rate plots | Images |
|---|---|---|
| Comparison with Poisson distribution Blue bars denote a histogram of data divided into 1 sec bins. Red curve is a Poisson curve with rate = median count rate of data. |
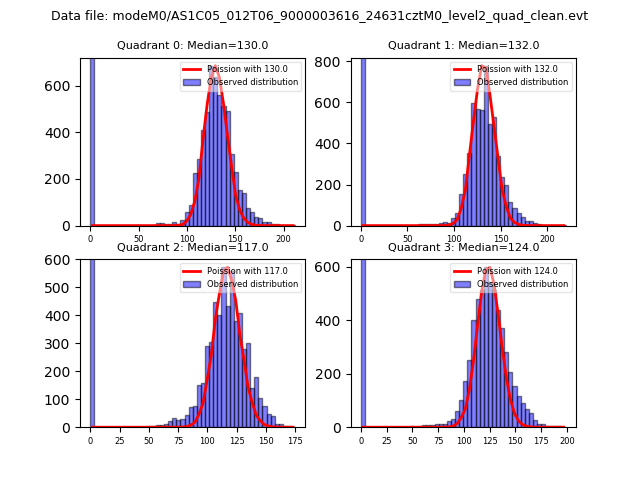 |
 |
| Quadrant-wise count rates Data is divided into 100 sec bins |
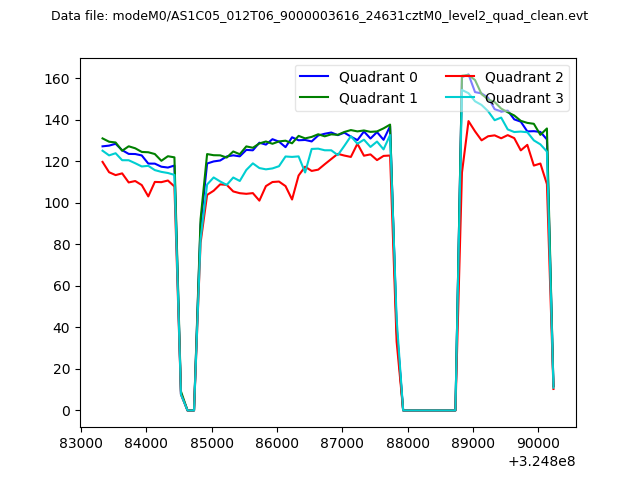 |
|
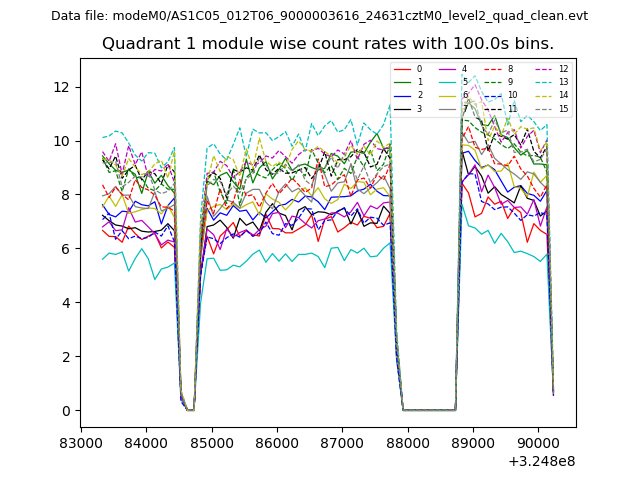
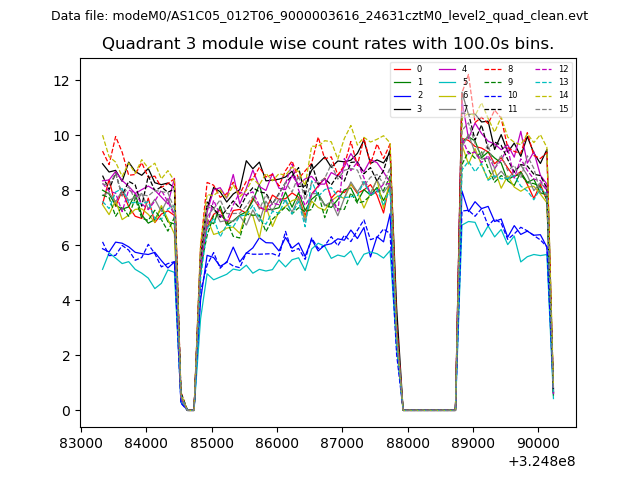
| Module-wise count rates for Quadrant A Data is divided into 100 sec bins |
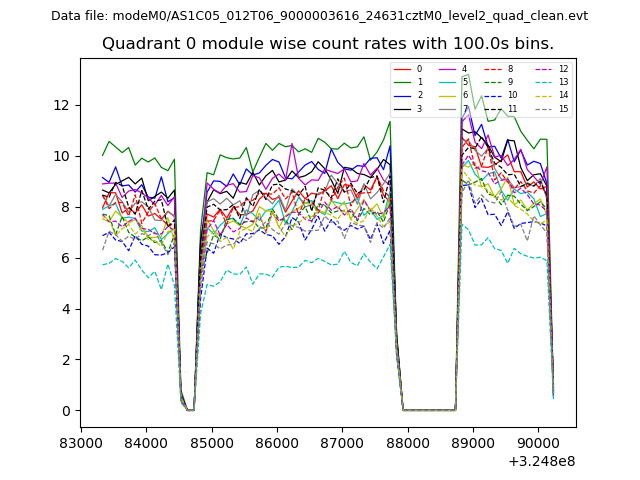 |
 |
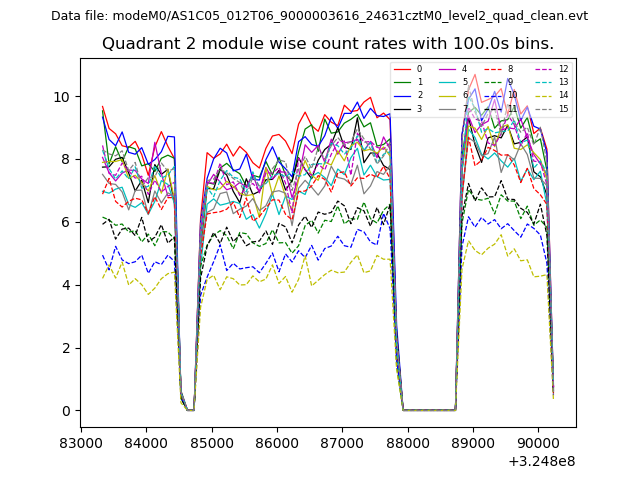
| Module-wise count rates for Quadrant B Data is divided into 100 sec bins |
 |
 |
| Module-wise count rates for Quadrant C Data is divided into 100 sec bins |
 |
 |
| Module-wise count rates for Quadrant D Data is divided into 100 sec bins |
 |
 |
| Parameter | Plot |
|---|---|
| CZT HV Monitor | 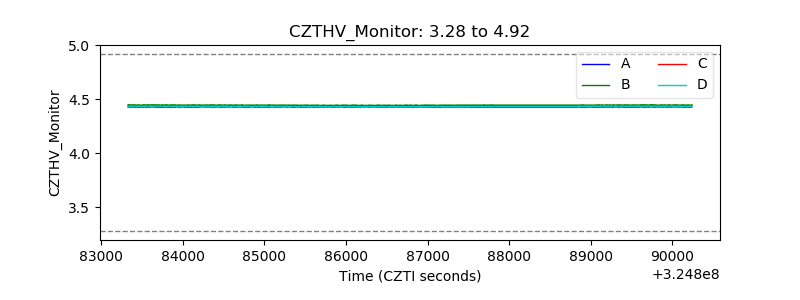 |
| D_VDD | 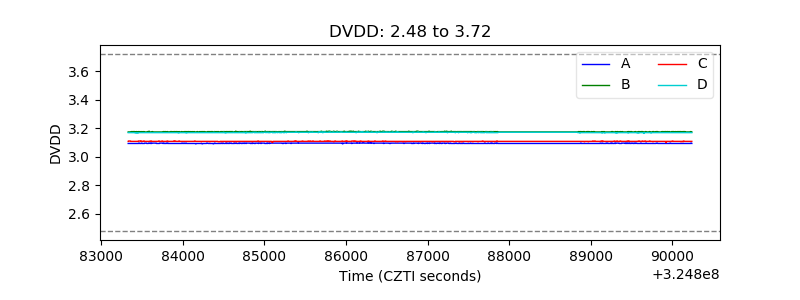 |
| Temperature 1 |  |
| Veto HV Monitor | 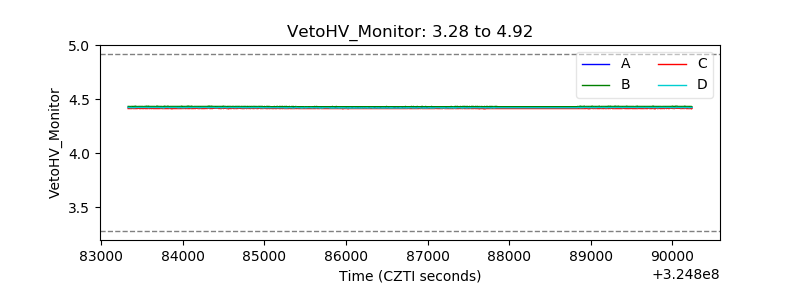 |
| Veto LLD | 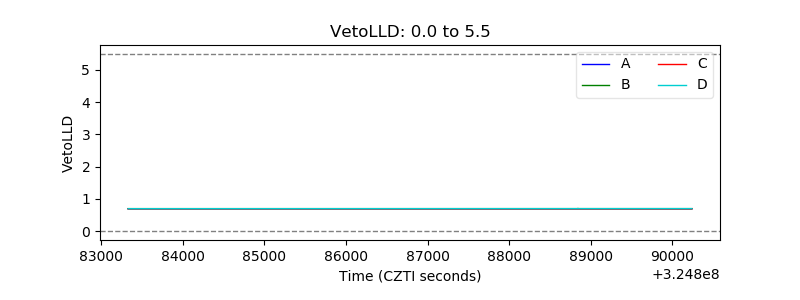 |
| Alpha Counter | 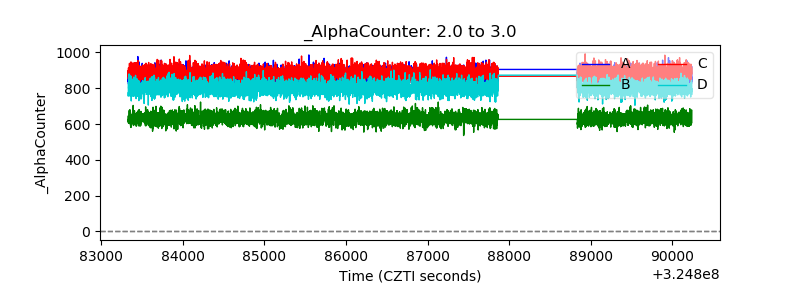 |
| _CPM_Rate | 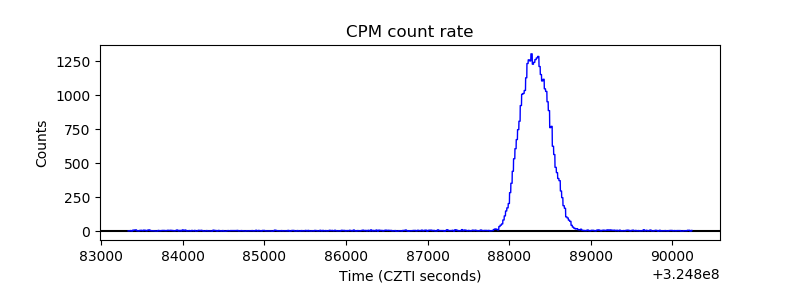 |
| CZT Counter | 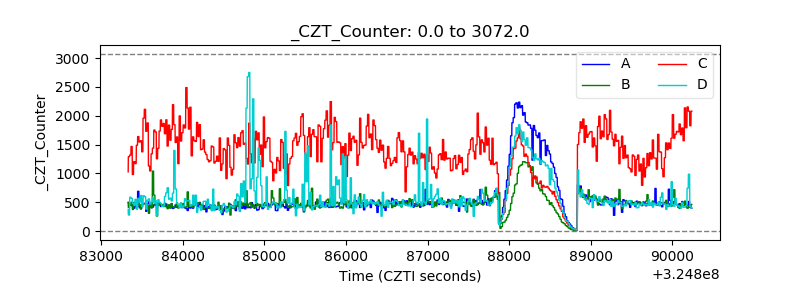 |
| +2.5 Volts monitor |  |
| +5 Volts monitor |  |
| _ROLL_ROT | 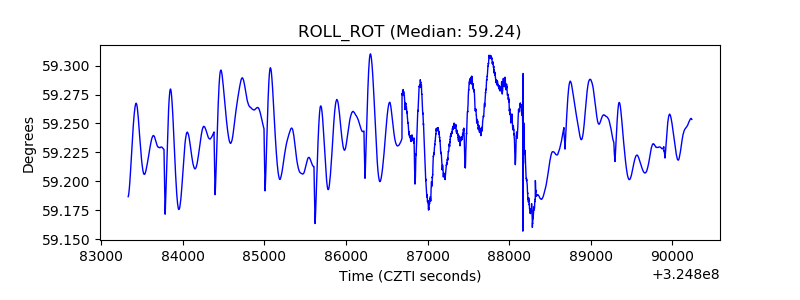 |
| _Roll_DEC |  |
| _Roll_RA | 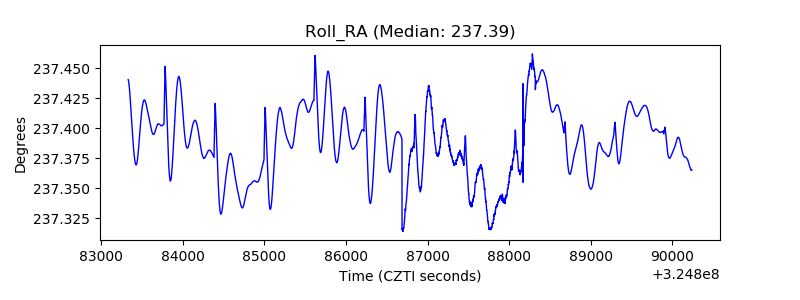 |
| Veto Counter | 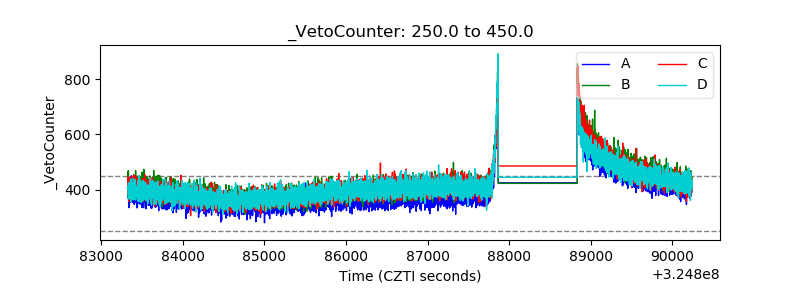 |