| Param | Original file | Final file |
|---|---|---|
| Filename | modeM0/AS1C05_012T06_9000003616_24633cztM0_level2.evt | modeM0/AS1C05_012T06_9000003616_24633cztM0_level2_quad_clean.evt |
| Size (bytes) | 716,342,400 | 106,035,840 |
| Size | 683.2 MB | 101.1 MB |
| Events in quadrant A | 2,877,731 | 764,130 |
| Events in quadrant B | 2,983,826 | 766,038 |
| Events in quadrant C | 11,330,981 | 574,395 |
| Events in quadrant D | 4,100,321 | 690,650 |
| Mode M0 | |||
|---|---|---|---|
| Quadrant | BADHDUFLAG | Total packets | Discarded packets |
| A | 0 | 12316 | 1 |
| B | 0 | 12588 | 2 |
| C | 0 | 37744 | 1 |
| D | 0 | 16013 | 1 |
| Mode SS | |||
|---|---|---|---|
| Quadrant | BADHDUFLAG | Total packets | Discarded packets |
| A | 0 | 120 | 0 |
| B | 0 | 120 | 0 |
| C | 0 | 120 | 0 |
| D | 0 | 120 | 0 |
| Mode M9 | |||
|---|---|---|---|
| Quadrant | BADHDUFLAG | Total packets | Discarded packets |
| A | 0 | 11 | 0 |
| B | 0 | 11 | 0 |
| C | 0 | 11 | 0 |
| D | 0 | 11 | 0 |
| Quadrant | Total seconds | Saturated seconds | Saturation percentage |
|---|---|---|---|
| A | 5938 | 41 | 0.690468% |
| B | 5938 | 72 | 1.212529% |
| C | 5938 | 3421 | 57.611991% |
| D | 5938 | 398 | 6.702593% |
Noise dominated data is calculated using 1-second bins in cleaned event files. If a bin has >2000 counts, and if more than 50% of those come from <1% of pixels, then it is considered to be noise-dominated and hence unusable.
| Quadrant | # 1 sec bins | Bins with >0 counts | Bins with >2000 counts | High rate bins dominated by noise | Noise dominated (total time) | Noise dominated (detector-on time) | Marked lightcurve |
|---|---|---|---|---|---|---|---|
| A | 7063 | 5939 | 0 | 0 | 0.00% | 0.00% | 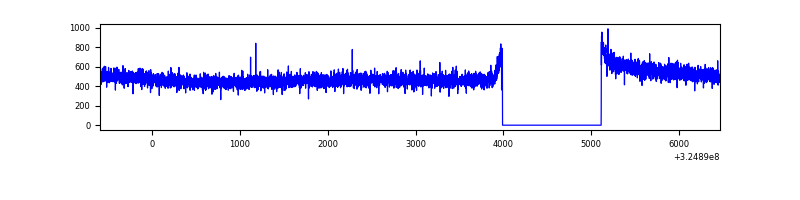 |
| B | 7063 | 5939 | 20 | 20 | 0.28% | 0.34% | 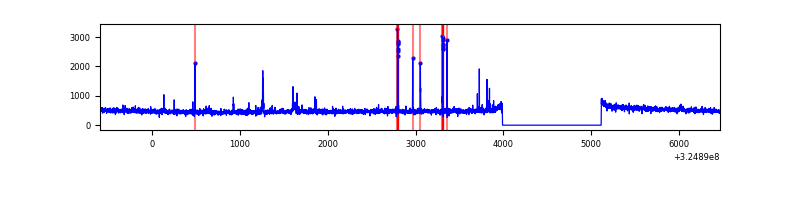 |
| C | 7063 | 5938 | 2689 | 2689 | 38.07% | 45.28% | 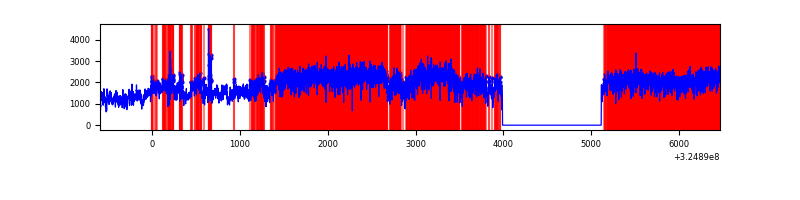 |
| D | 7063 | 5938 | 356 | 356 | 5.04% | 6.00% | 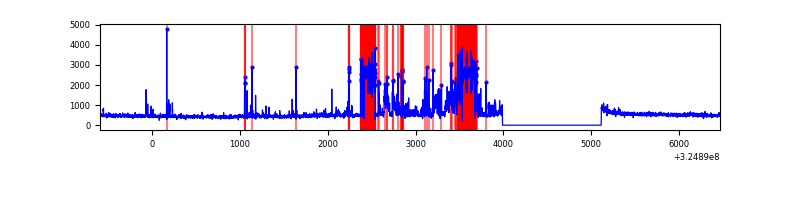 |
Top three noisy pixels from each quadrant. If the there are fewer than three noisy pixels in the level2.evt file, extra rows are filled as -1
| Pixel properties | Quadrant properties | ||||||
|---|---|---|---|---|---|---|---|
| Quadrant | DetID | PixID | Counts | Sigma | Mean | Median | Sigma |
| A | 13 | 254 | 9811 | 61.15 | 746 | 732 | 148.5 |
| A | 3 | 137 | 6569 | 39.31 | 746 | 732 | 148.5 |
| A | 0 | 226 | 6296 | 37.48 | 746 | 732 | 148.5 |
| B | 5 | 172 | 63091 | 458.95 | 730 | 713 | 135.9 |
| B | 3 | 64 | 21914 | 155.99 | 730 | 713 | 135.9 |
| B | 12 | 111 | 16693 | 117.58 | 730 | 713 | 135.9 |
| C | 7 | 247 | 8296817 | 60008.05 | 603 | 608 | 138.3 |
| C | 0 | 79 | 259036 | 1869.26 | 603 | 608 | 138.3 |
| C | 10 | 91 | 153093 | 1102.95 | 603 | 608 | 138.3 |
| D | 7 | 238 | 1094291 | 6458.6 | 695 | 674 | 169.3 |
| D | 1 | 52 | 230552 | 1357.6 | 695 | 674 | 169.3 |
| D | 8 | 195 | 96497 | 565.9 | 695 | 674 | 169.3 |
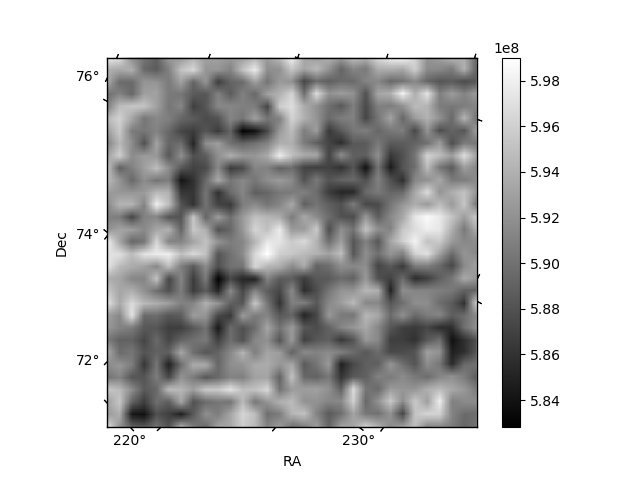
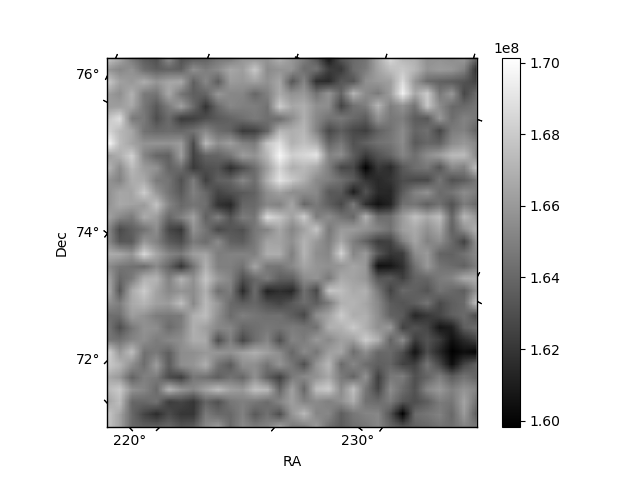
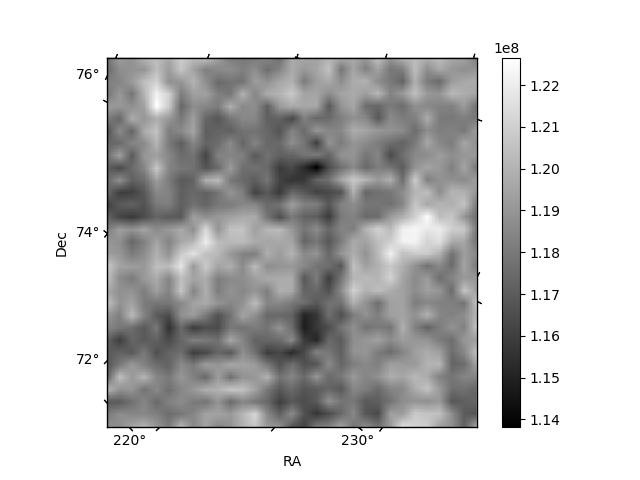
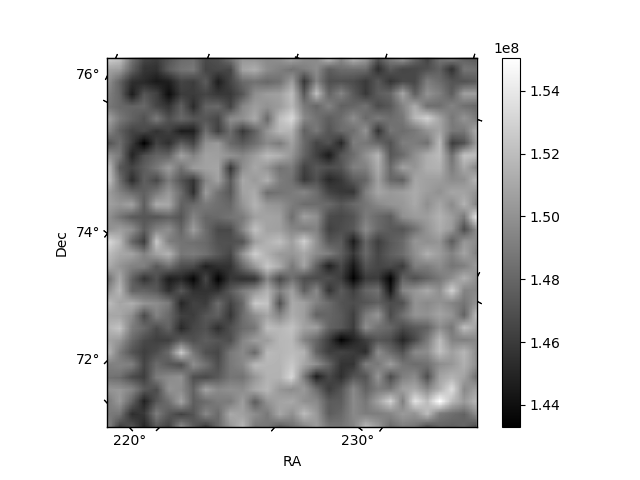
Histogram calculated using DETX and DETY for each event in the final _common_clean file
| Quadrant A | 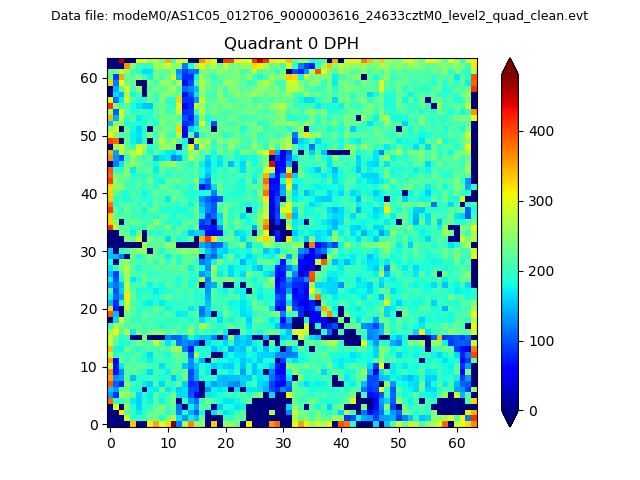 |
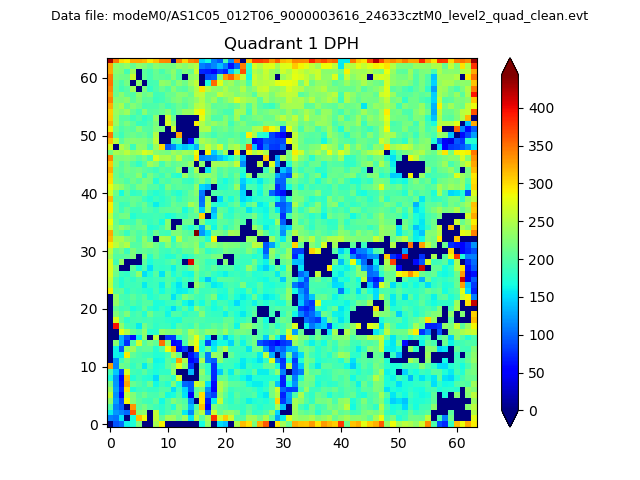 |
Quadrant B |
|---|---|---|---|
| Quadrant D | 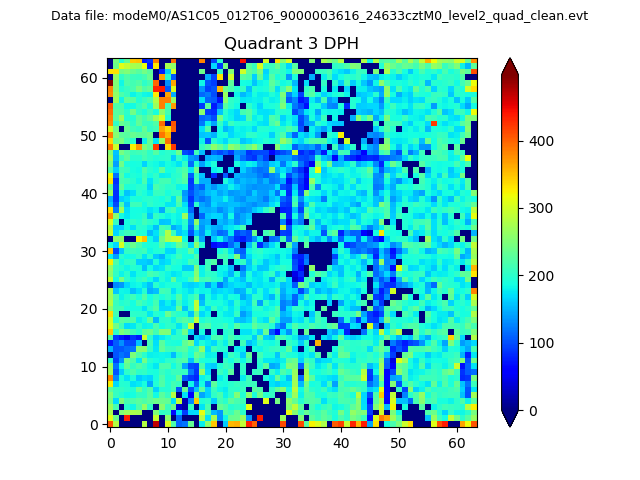 |
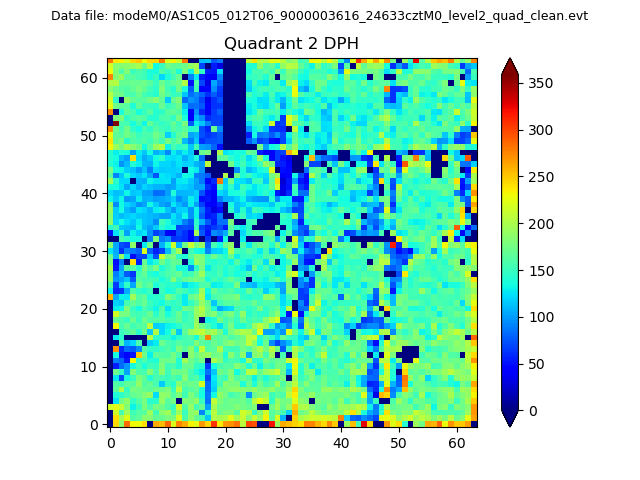 |
Quadrant C |
| Plot type | Count rate plots | Images |
|---|---|---|
| Comparison with Poisson distribution Blue bars denote a histogram of data divided into 1 sec bins. Red curve is a Poisson curve with rate = median count rate of data. |
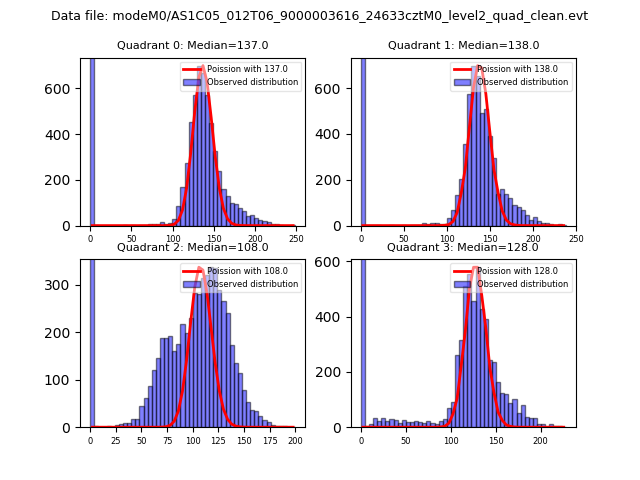 |
 |
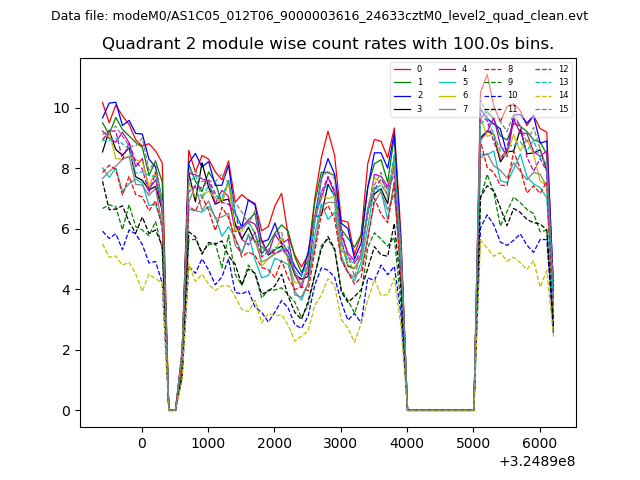
| Quadrant-wise count rates Data is divided into 100 sec bins |
 |
|
| Module-wise count rates for Quadrant A Data is divided into 100 sec bins |
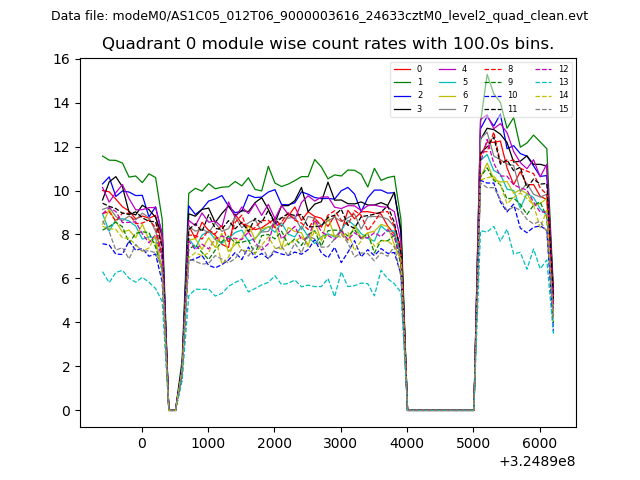 |
 |
| Module-wise count rates for Quadrant B Data is divided into 100 sec bins |
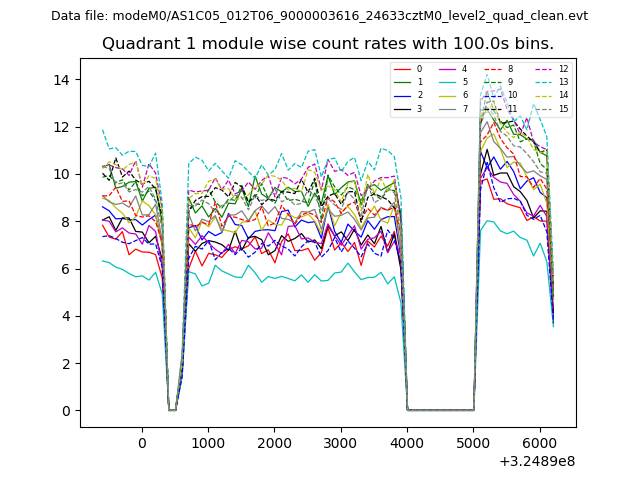 |
 |
| Module-wise count rates for Quadrant C Data is divided into 100 sec bins |
 |
 |
| Module-wise count rates for Quadrant D Data is divided into 100 sec bins |
 |
 |
| Parameter | Plot |
|---|---|
| CZT HV Monitor | 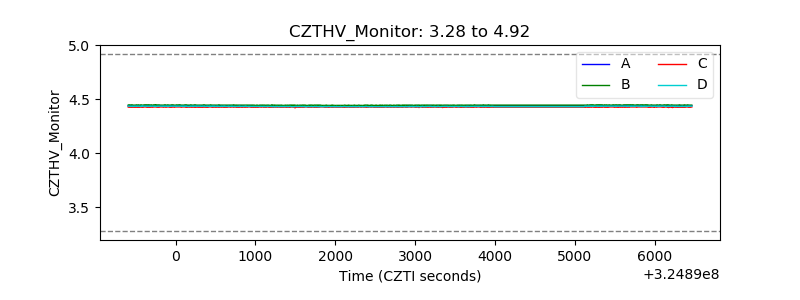 |
| D_VDD | 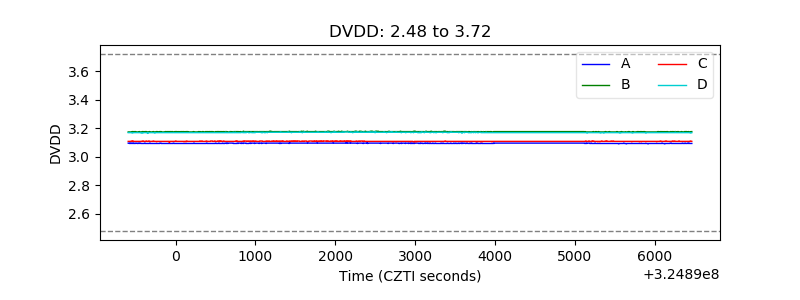 |
| Temperature 1 |  |
| Veto HV Monitor | 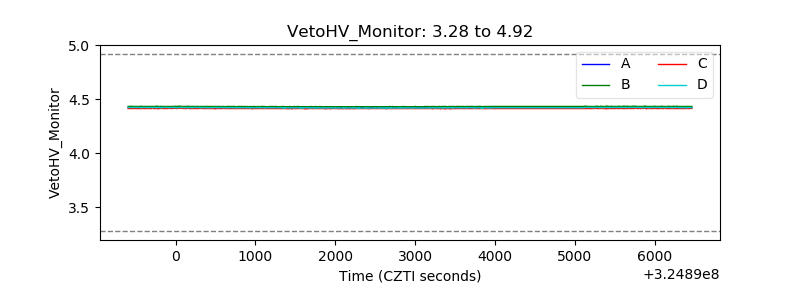 |
| Veto LLD |  |
| Alpha Counter | 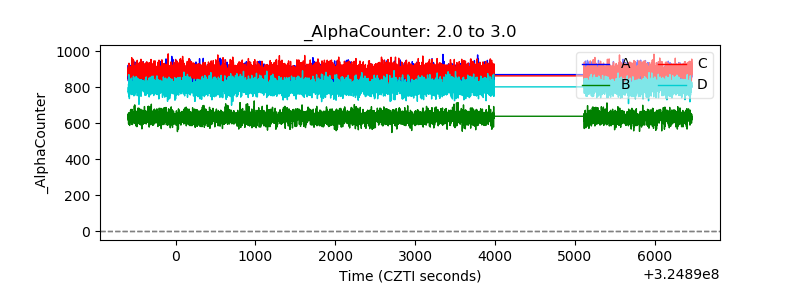 |
| _CPM_Rate | 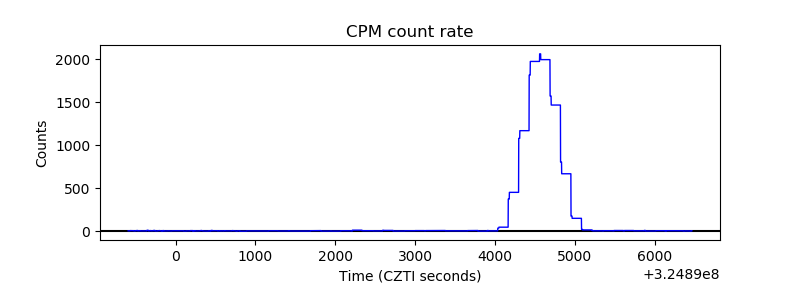 |
| CZT Counter | 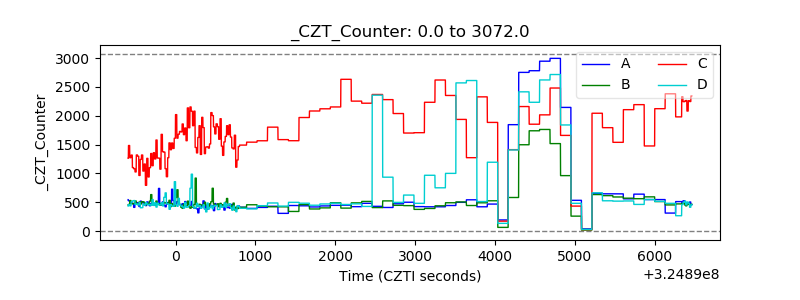 |
| +2.5 Volts monitor |  |
| +5 Volts monitor |  |
| _ROLL_ROT |  |
| _Roll_DEC | 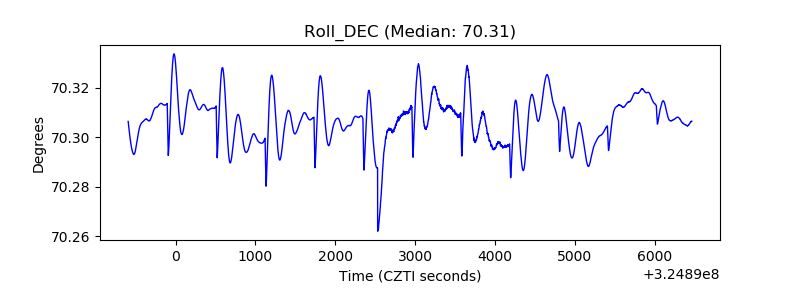 |
| _Roll_RA | 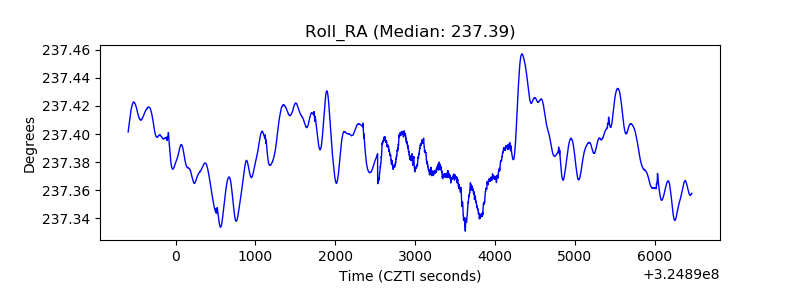 |
| Veto Counter |  |