| Param | Original file | Final file |
|---|---|---|
| Filename | modeM0/AS1C05_012T06_9000003616_24634cztM0_level2.evt | modeM0/AS1C05_012T06_9000003616_24634cztM0_level2_quad_clean.evt |
| Size (bytes) | 707,840,640 | 121,766,400 |
| Size | 675.0 MB | 116.1 MB |
| Events in quadrant A | 3,169,560 | 868,674 |
| Events in quadrant B | 3,311,703 | 870,294 |
| Events in quadrant C | 9,512,506 | 738,932 |
| Events in quadrant D | 5,024,200 | 775,914 |
| Mode M0 | |||
|---|---|---|---|
| Quadrant | BADHDUFLAG | Total packets | Discarded packets |
| A | 0 | 13287 | 1 |
| B | 0 | 13736 | 1 |
| C | 0 | 32628 | 1 |
| D | 0 | 18951 | 1 |
| Mode SS | |||
|---|---|---|---|
| Quadrant | BADHDUFLAG | Total packets | Discarded packets |
| A | 0 | 124 | 0 |
| B | 0 | 124 | 0 |
| C | 0 | 126 | 0 |
| D | 0 | 126 | 0 |
| Mode M9 | |||
|---|---|---|---|
| Quadrant | BADHDUFLAG | Total packets | Discarded packets |
| A | 0 | 13 | 0 |
| B | 0 | 13 | 0 |
| C | 0 | 13 | 0 |
| D | 0 | 13 | 0 |
| Quadrant | Total seconds | Saturated seconds | Saturation percentage |
|---|---|---|---|
| A | 6212 | 46 | 0.740502% |
| B | 6212 | 55 | 0.885383% |
| C | 6212 | 1862 | 29.974243% |
| D | 6213 | 587 | 9.447932% |
Noise dominated data is calculated using 1-second bins in cleaned event files. If a bin has >2000 counts, and if more than 50% of those come from <1% of pixels, then it is considered to be noise-dominated and hence unusable.
| Quadrant | # 1 sec bins | Bins with >0 counts | Bins with >2000 counts | High rate bins dominated by noise | Noise dominated (total time) | Noise dominated (detector-on time) | Marked lightcurve |
|---|---|---|---|---|---|---|---|
| A | 7462 | 6212 | 0 | 0 | 0.00% | 0.00% | 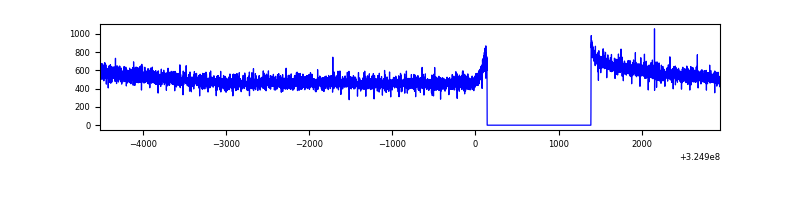 |
| B | 7462 | 6213 | 5 | 5 | 0.07% | 0.08% | 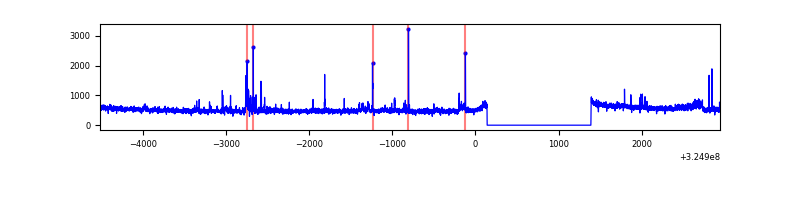 |
| C | 7462 | 6212 | 1287 | 1287 | 17.25% | 20.72% | 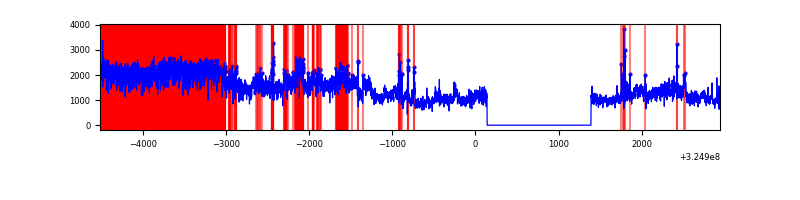 |
| D | 7463 | 6214 | 513 | 513 | 6.87% | 8.26% | 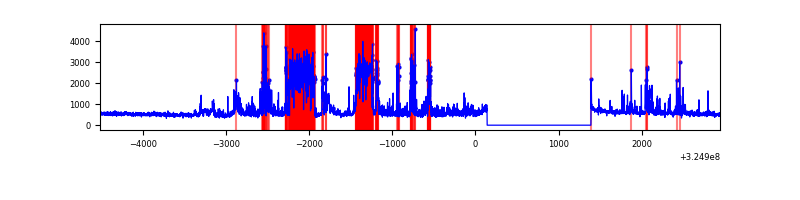 |
Top three noisy pixels from each quadrant. If the there are fewer than three noisy pixels in the level2.evt file, extra rows are filled as -1
| Pixel properties | Quadrant properties | ||||||
|---|---|---|---|---|---|---|---|
| Quadrant | DetID | PixID | Counts | Sigma | Mean | Median | Sigma |
| A | 13 | 254 | 10098 | 57.46 | 821 | 809 | 161.7 |
| A | 0 | 226 | 7121 | 39.04 | 821 | 809 | 161.7 |
| A | 3 | 137 | 6919 | 37.79 | 821 | 809 | 161.7 |
| B | 0 | 189 | 35403 | 233.37 | 802 | 784 | 148.3 |
| B | 0 | 230 | 34304 | 225.96 | 802 | 784 | 148.3 |
| B | 5 | 172 | 30570 | 200.79 | 802 | 784 | 148.3 |
| C | 7 | 247 | 6123694 | 36782.76 | 729 | 736 | 166.5 |
| C | 2 | 16 | 196902 | 1178.44 | 729 | 736 | 166.5 |
| C | 0 | 79 | 152915 | 914.19 | 729 | 736 | 166.5 |
| D | 7 | 238 | 1256208 | 6864.7 | 764 | 743 | 182.9 |
| D | 1 | 52 | 408973 | 2232.14 | 764 | 743 | 182.9 |
| D | 8 | 195 | 334045 | 1822.45 | 764 | 743 | 182.9 |
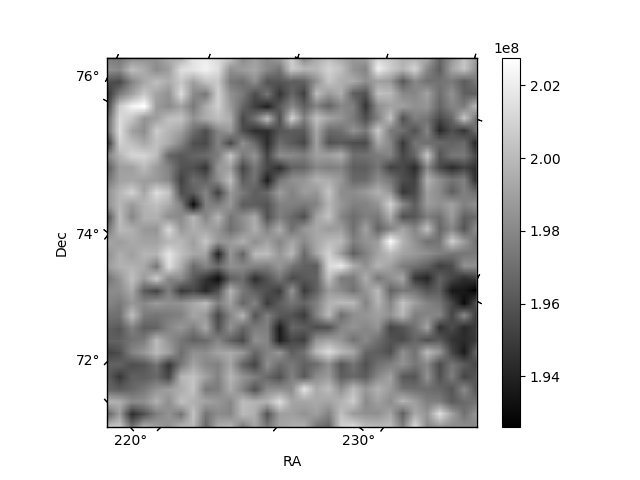
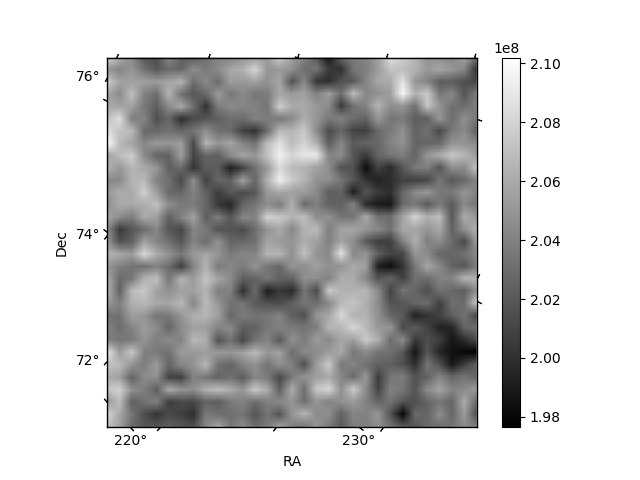
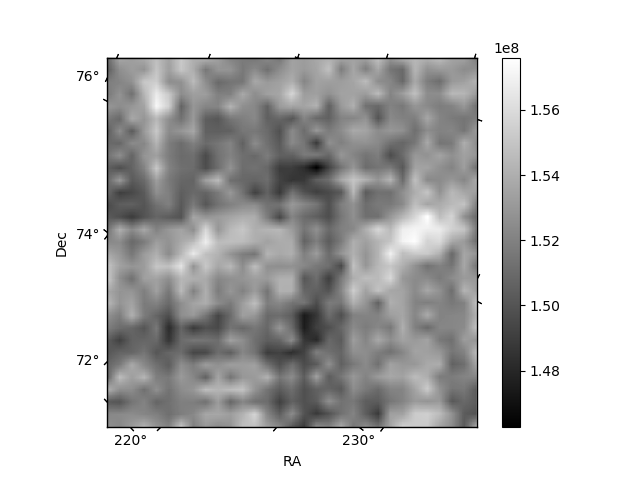
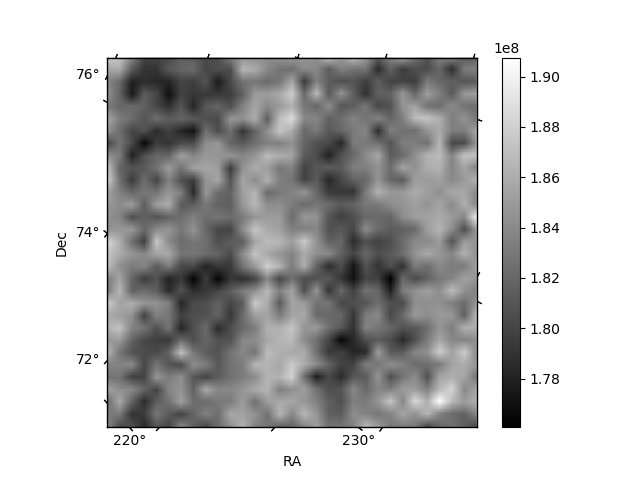
Histogram calculated using DETX and DETY for each event in the final _common_clean file
| Quadrant A | 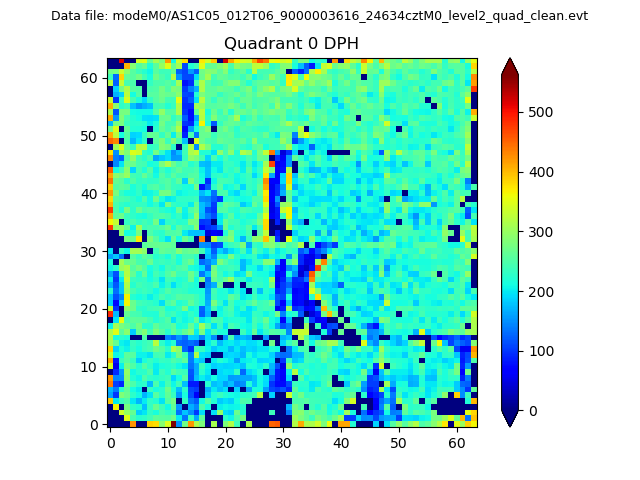 |
 |
Quadrant B |
|---|---|---|---|
| Quadrant D | 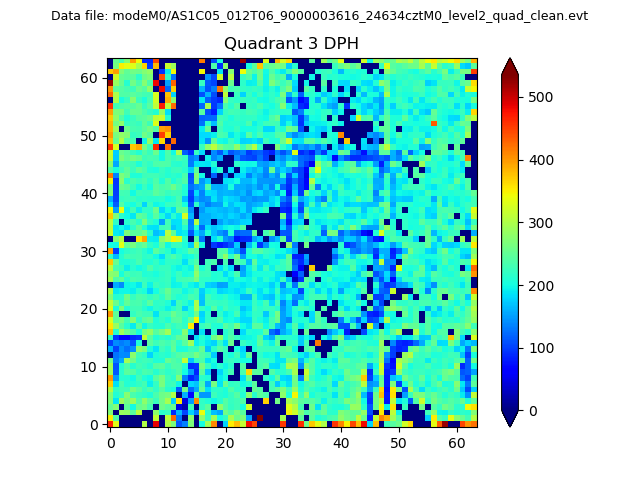 |
 |
Quadrant C |
| Plot type | Count rate plots | Images |
|---|---|---|
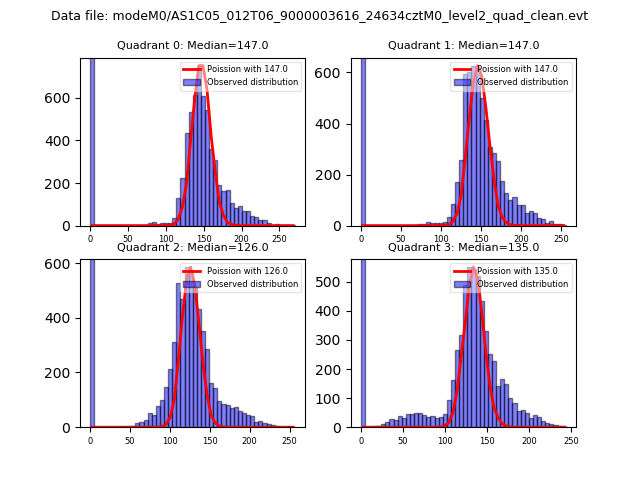
| Comparison with Poisson distribution Blue bars denote a histogram of data divided into 1 sec bins. Red curve is a Poisson curve with rate = median count rate of data. |
 |
 |
| Quadrant-wise count rates Data is divided into 100 sec bins |
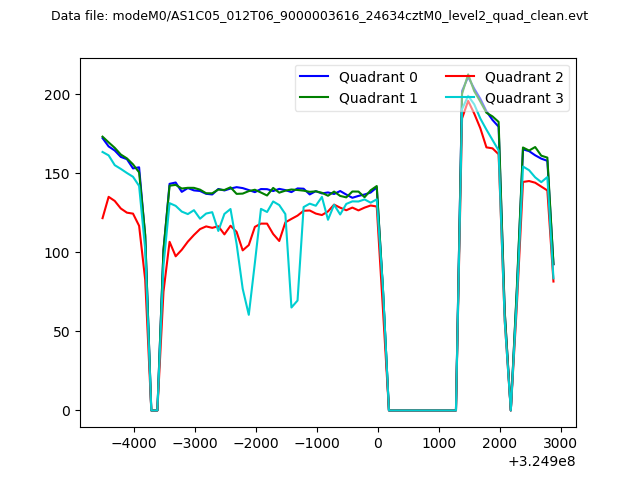 |
|
| Module-wise count rates for Quadrant A Data is divided into 100 sec bins |
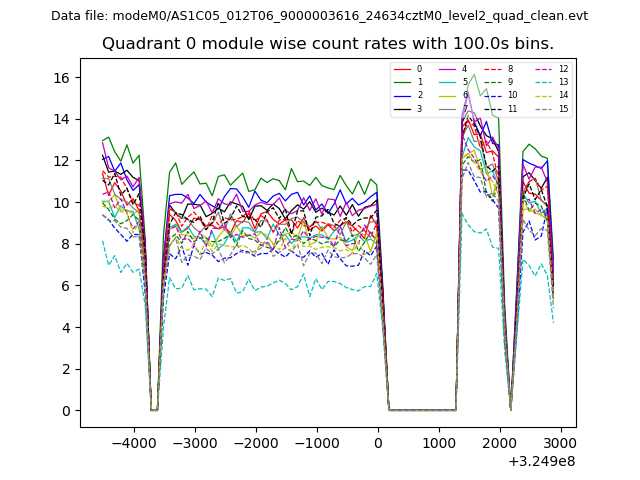 |
 |
| Module-wise count rates for Quadrant B Data is divided into 100 sec bins |
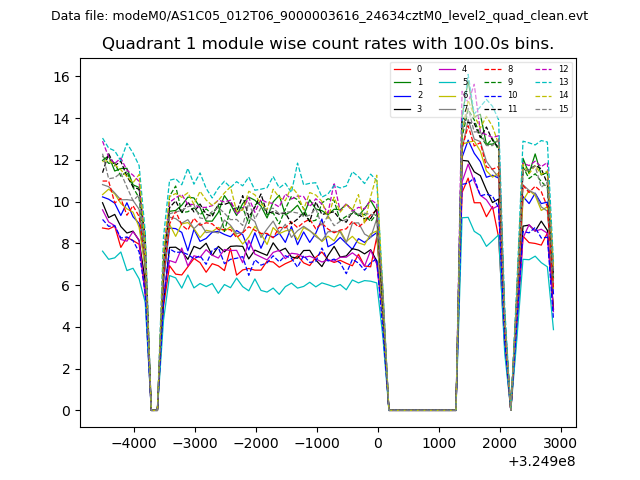 |
 |
| Module-wise count rates for Quadrant C Data is divided into 100 sec bins |
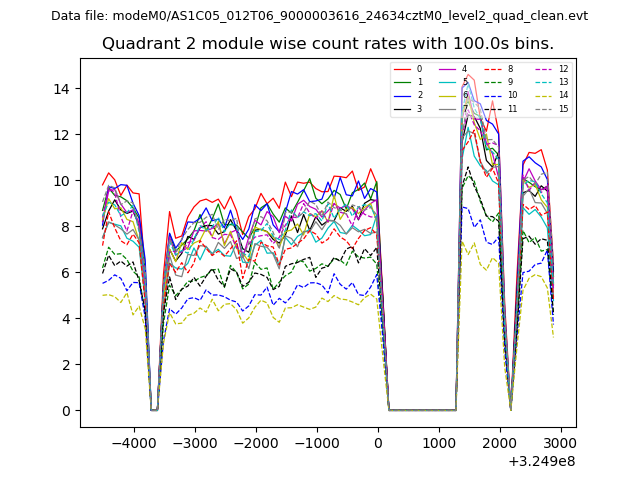 |
 |
| Module-wise count rates for Quadrant D Data is divided into 100 sec bins |
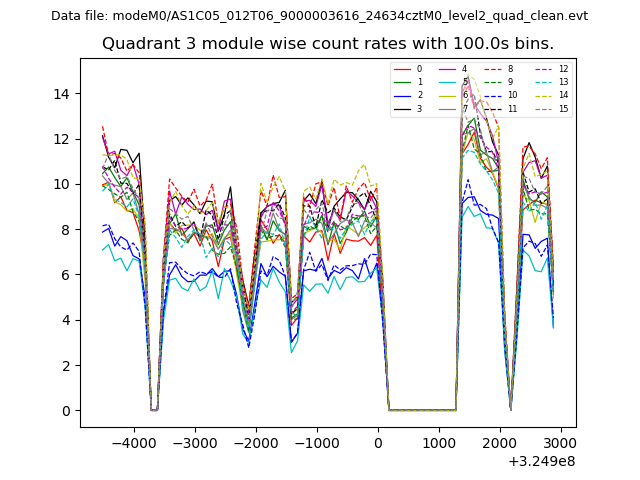 |
 |
| Parameter | Plot |
|---|---|
| CZT HV Monitor | 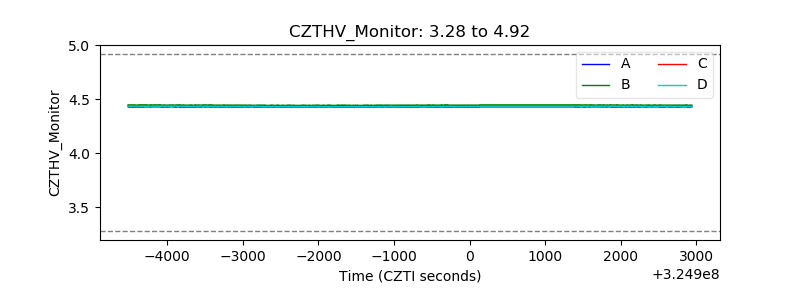 |
| D_VDD | 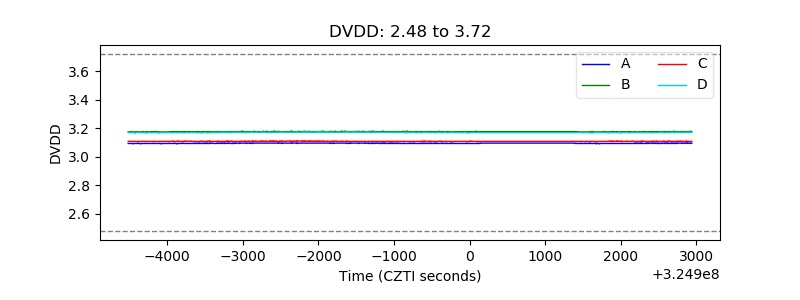 |
| Temperature 1 | 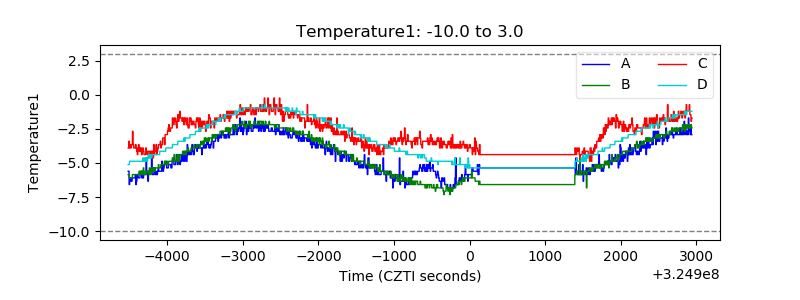 |
| Veto HV Monitor | 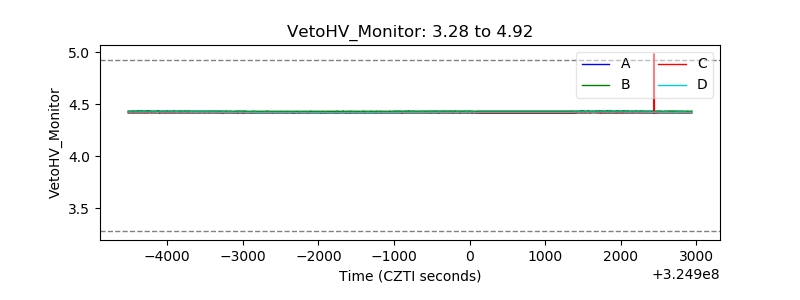 |
| Veto LLD | 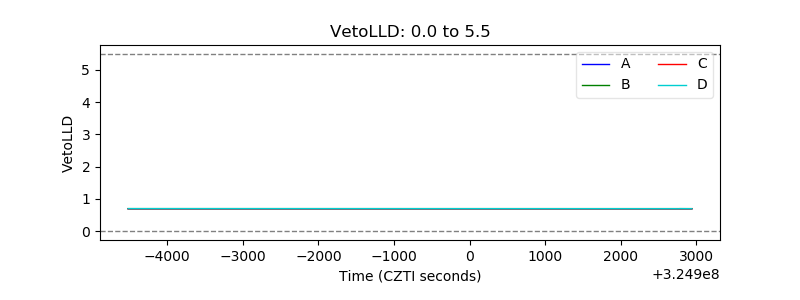 |
| Alpha Counter | 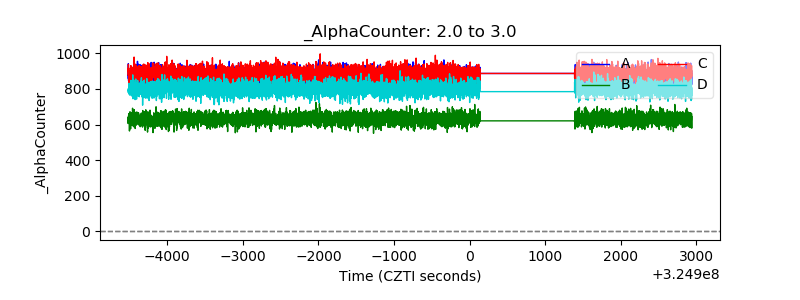 |
| _CPM_Rate | 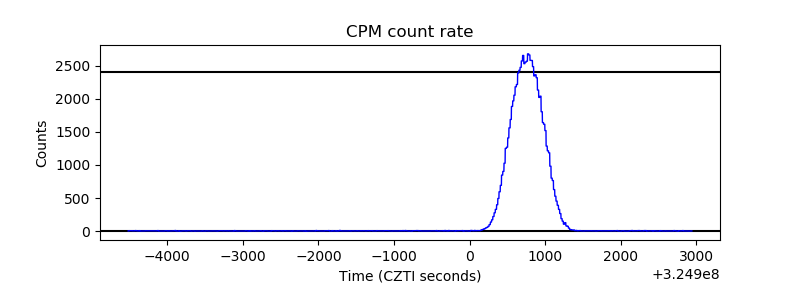 |
| CZT Counter | 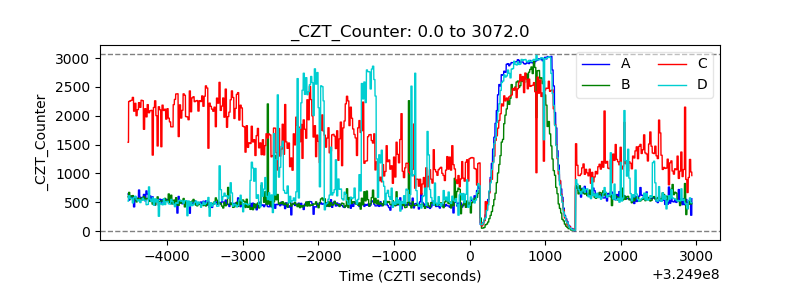 |
| +2.5 Volts monitor |  |
| +5 Volts monitor | 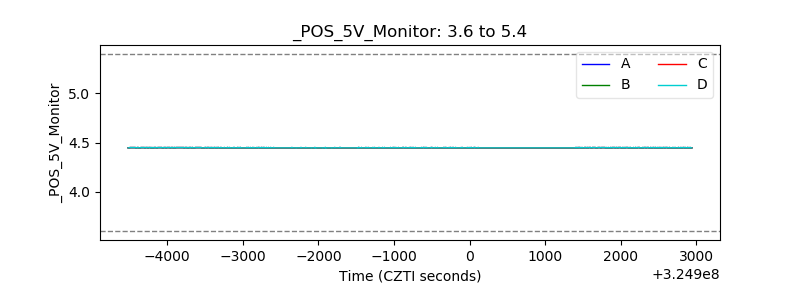 |
| _ROLL_ROT | 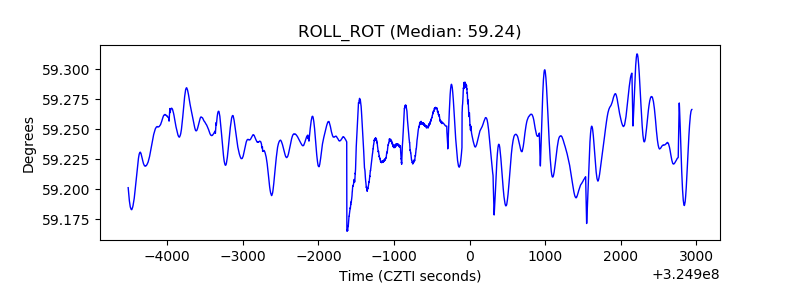 |
| _Roll_DEC | 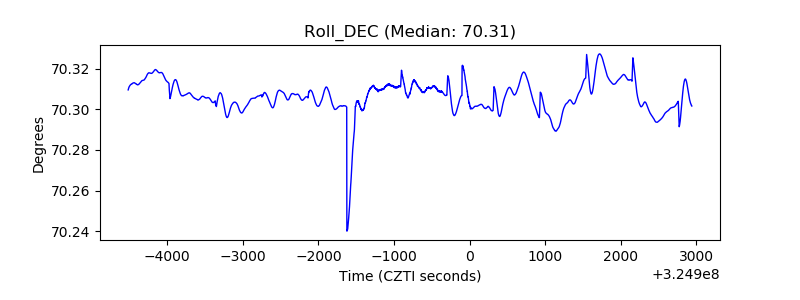 |
| _Roll_RA | 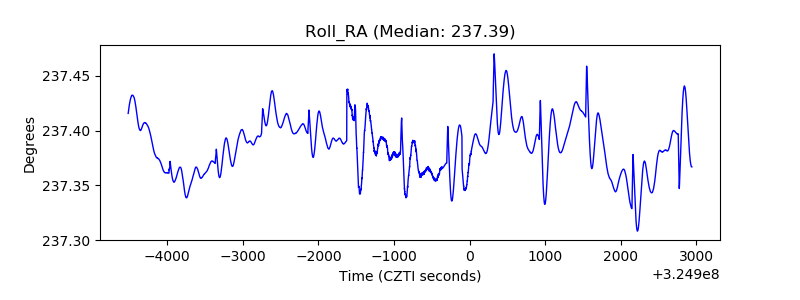 |
| Veto Counter | 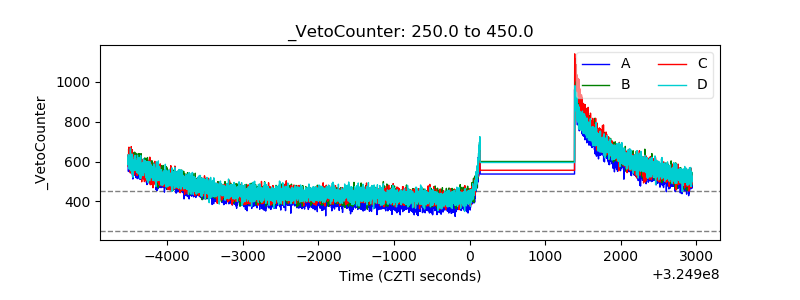 |