| Param | Original file | Final file |
|---|---|---|
| Filename | modeM0/AS1C05_012T06_9000003616_24636cztM0_level2.evt | modeM0/AS1C05_012T06_9000003616_24636cztM0_level2_quad_clean.evt |
| Size (bytes) | 582,641,280 | 128,514,240 |
| Size | 555.7 MB | 122.6 MB |
| Events in quadrant A | 3,137,677 | 905,259 |
| Events in quadrant B | 3,427,990 | 908,461 |
| Events in quadrant C | 7,186,975 | 821,365 |
| Events in quadrant D | 3,499,887 | 850,988 |
| Mode M0 | |||
|---|---|---|---|
| Quadrant | BADHDUFLAG | Total packets | Discarded packets |
| A | 0 | 12922 | 1 |
| B | 0 | 13790 | 1 |
| C | 0 | 25364 | 1 |
| D | 0 | 14156 | 1 |
| Mode SS | |||
|---|---|---|---|
| Quadrant | BADHDUFLAG | Total packets | Discarded packets |
| A | 0 | 118 | 0 |
| B | 0 | 118 | 0 |
| C | 0 | 118 | 0 |
| D | 0 | 118 | 0 |
| Mode M9 | |||
|---|---|---|---|
| Quadrant | BADHDUFLAG | Total packets | Discarded packets |
| A | 0 | 13 | 0 |
| B | 0 | 13 | 0 |
| C | 0 | 13 | 0 |
| D | 0 | 13 | 0 |
| Quadrant | Total seconds | Saturated seconds | Saturation percentage |
|---|---|---|---|
| A | 5810 | 159 | 2.736661% |
| B | 5811 | 191 | 3.286870% |
| C | 5811 | 557 | 9.585269% |
| D | 5811 | 161 | 2.770607% |
Noise dominated data is calculated using 1-second bins in cleaned event files. If a bin has >2000 counts, and if more than 50% of those come from <1% of pixels, then it is considered to be noise-dominated and hence unusable.
| Quadrant | # 1 sec bins | Bins with >0 counts | Bins with >2000 counts | High rate bins dominated by noise | Noise dominated (total time) | Noise dominated (detector-on time) | Marked lightcurve |
|---|---|---|---|---|---|---|---|
| A | 7115 | 5810 | 16 | 16 | 0.22% | 0.28% | 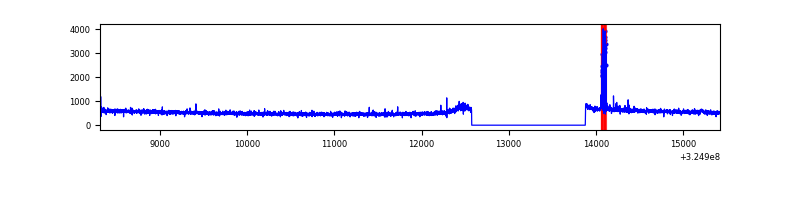 |
| B | 7116 | 5811 | 38 | 38 | 0.53% | 0.65% | 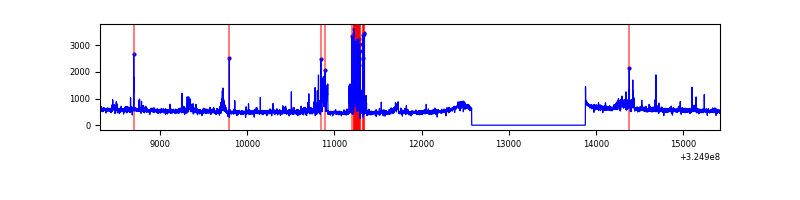 |
| C | 7116 | 5811 | 14 | 14 | 0.20% | 0.24% | 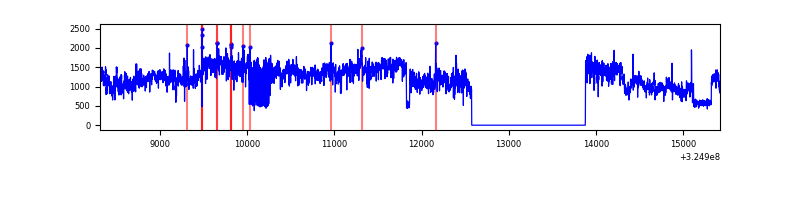 |
| D | 7116 | 5811 | 34 | 34 | 0.48% | 0.59% | 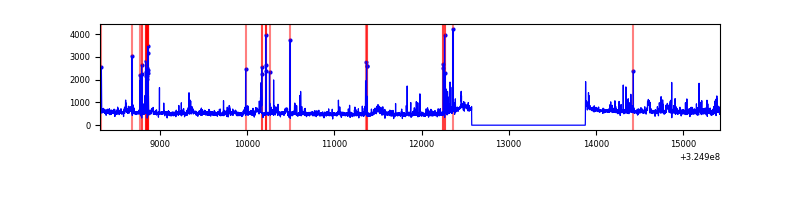 |
Top three noisy pixels from each quadrant. If the there are fewer than three noisy pixels in the level2.evt file, extra rows are filled as -1
| Pixel properties | Quadrant properties | ||||||
|---|---|---|---|---|---|---|---|
| Quadrant | DetID | PixID | Counts | Sigma | Mean | Median | Sigma |
| A | 12 | 96 | 75741 | 476.68 | 792 | 776 | 157.3 |
| A | 13 | 254 | 9828 | 57.56 | 792 | 776 | 157.3 |
| A | 6 | 16 | 8518 | 49.23 | 792 | 776 | 157.3 |
| B | 3 | 64 | 222367 | 1550.12 | 780 | 761 | 143.0 |
| B | 0 | 230 | 51331 | 353.73 | 780 | 761 | 143.0 |
| B | 15 | 32 | 44530 | 306.16 | 780 | 761 | 143.0 |
| C | 7 | 247 | 4023794 | 23666.36 | 744 | 749 | 170.0 |
| C | 14 | 238 | 119215 | 696.9 | 744 | 749 | 170.0 |
| C | 10 | 91 | 60324 | 350.46 | 744 | 749 | 170.0 |
| D | 1 | 52 | 316710 | 1692.75 | 778 | 754 | 186.7 |
| D | 8 | 195 | 122196 | 650.63 | 778 | 754 | 186.7 |
| D | 9 | 1 | 74427 | 394.71 | 778 | 754 | 186.7 |
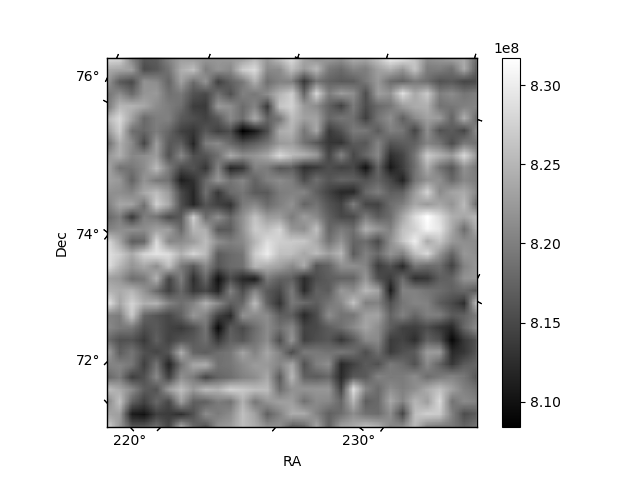
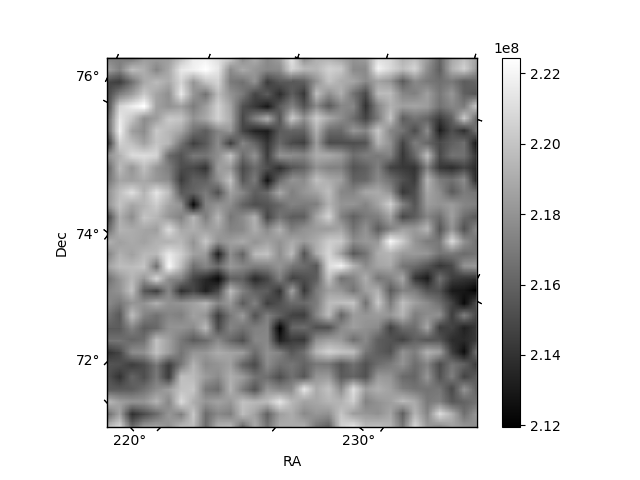
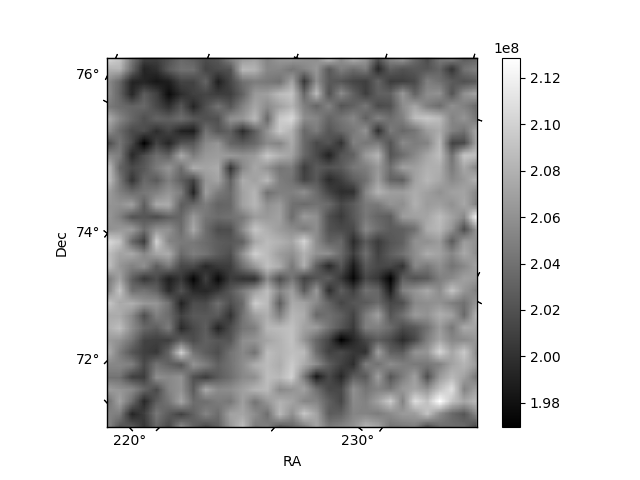
Histogram calculated using DETX and DETY for each event in the final _common_clean file
| Quadrant A | 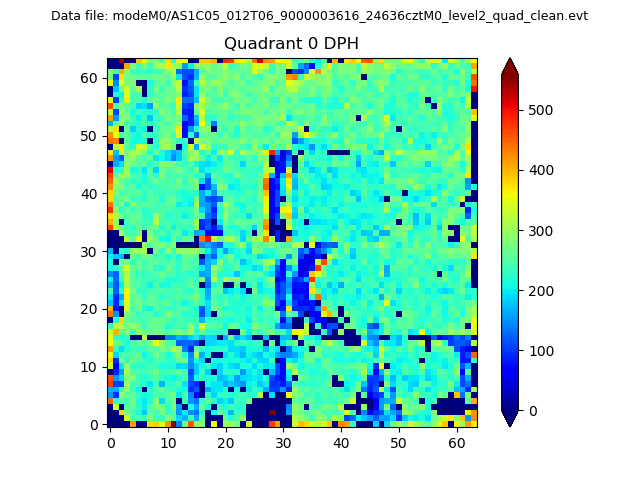 |
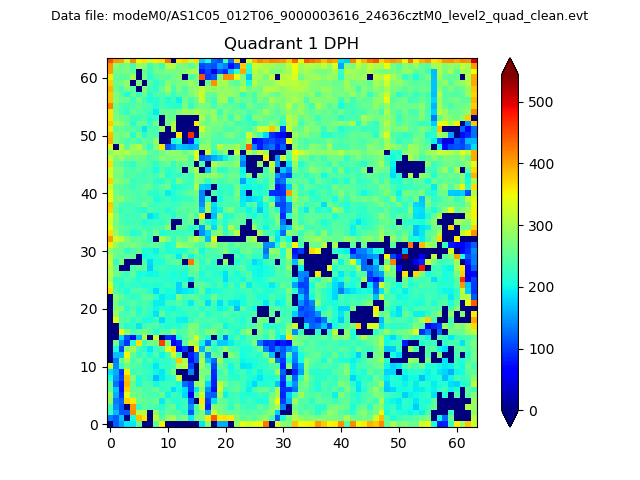 |
Quadrant B |
|---|---|---|---|
| Quadrant D |  |
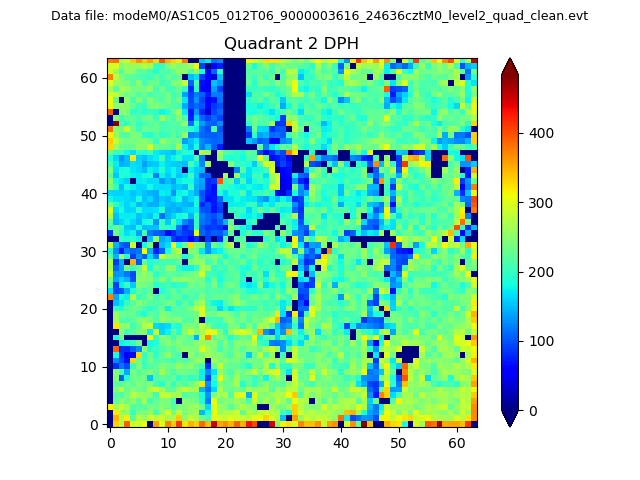 |
Quadrant C |
| Plot type | Count rate plots | Images |
|---|---|---|
| Comparison with Poisson distribution Blue bars denote a histogram of data divided into 1 sec bins. Red curve is a Poisson curve with rate = median count rate of data. |
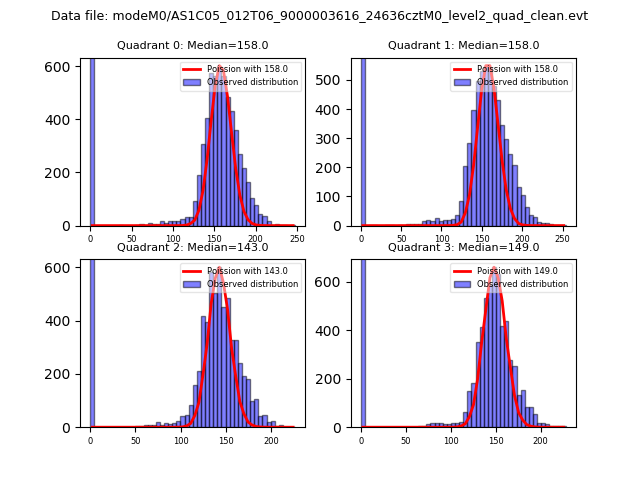 |
 |
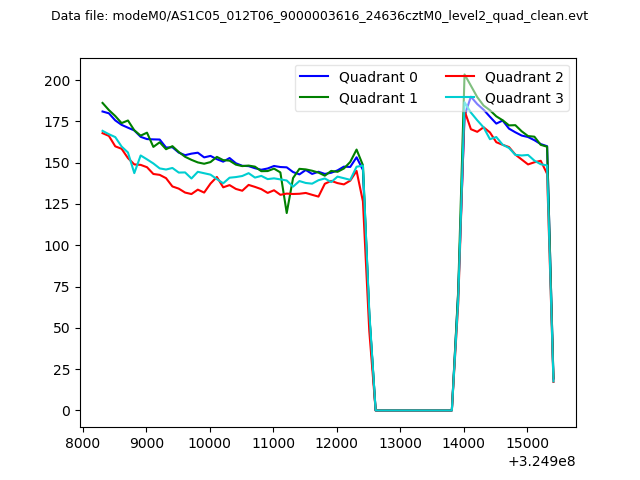
| Quadrant-wise count rates Data is divided into 100 sec bins |
 |
|
| Module-wise count rates for Quadrant A Data is divided into 100 sec bins |
 |
 |
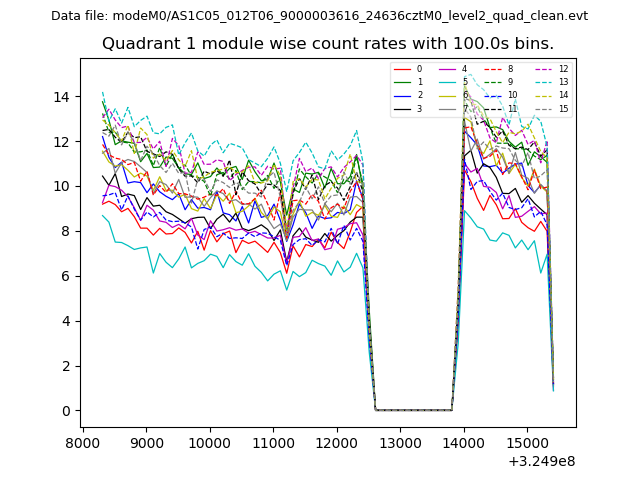
| Module-wise count rates for Quadrant B Data is divided into 100 sec bins |
 |
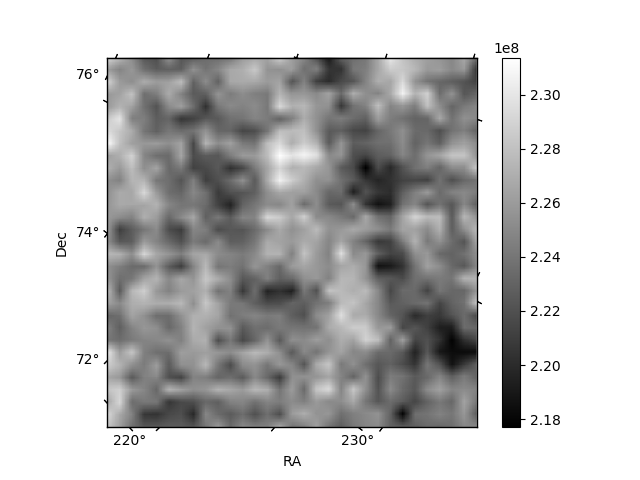 |
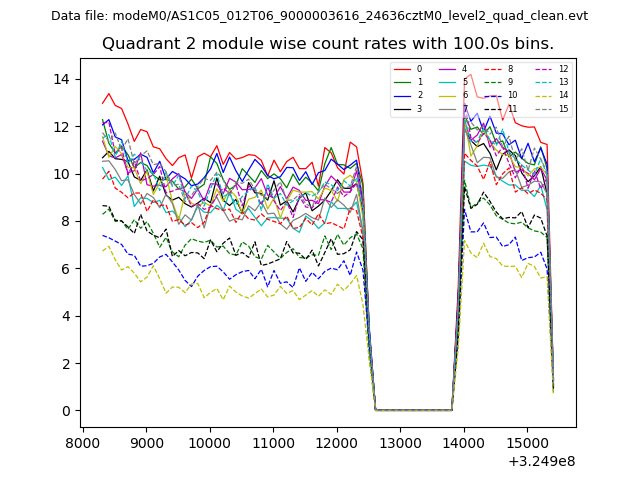
| Module-wise count rates for Quadrant C Data is divided into 100 sec bins |
 |
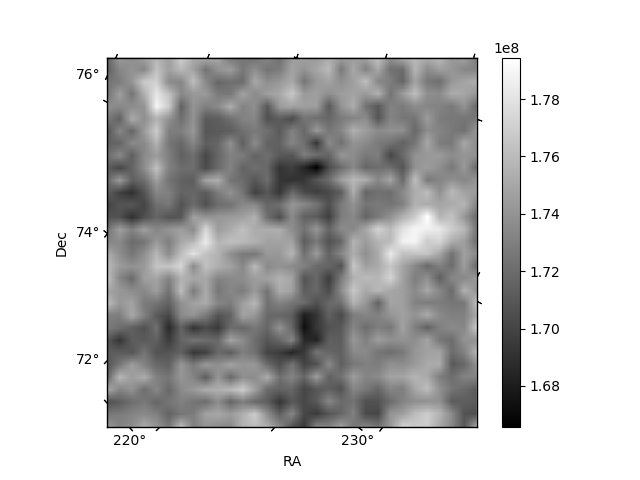 |
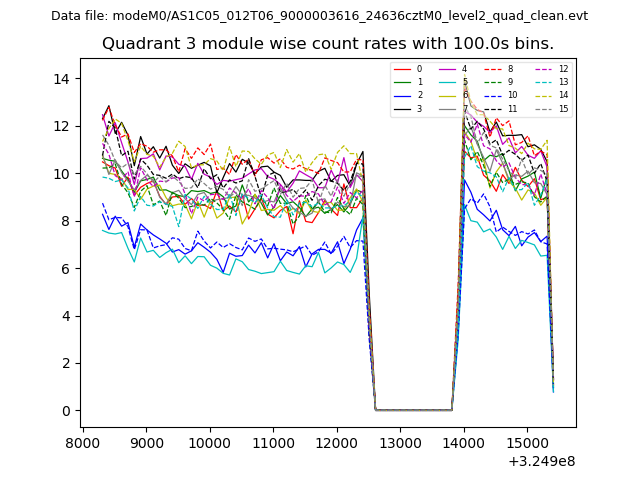
| Module-wise count rates for Quadrant D Data is divided into 100 sec bins |
 |
 |
| Parameter | Plot |
|---|---|
| CZT HV Monitor | 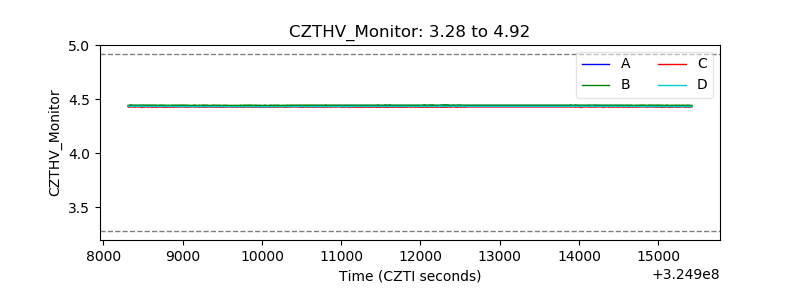 |
| D_VDD | 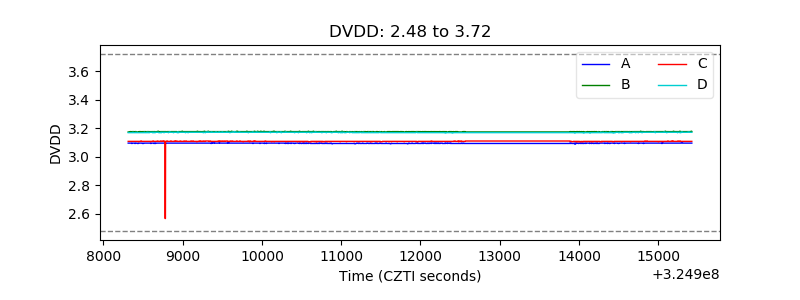 |
| Temperature 1 | 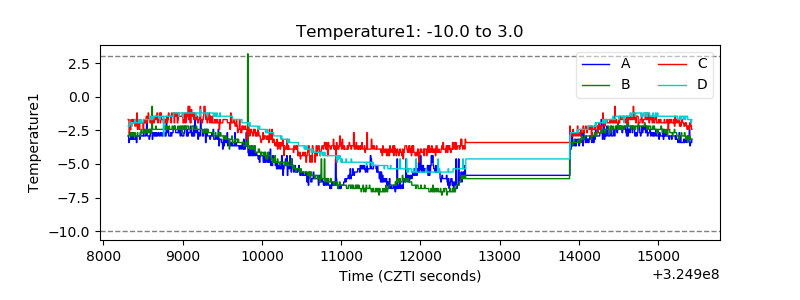 |
| Veto HV Monitor | 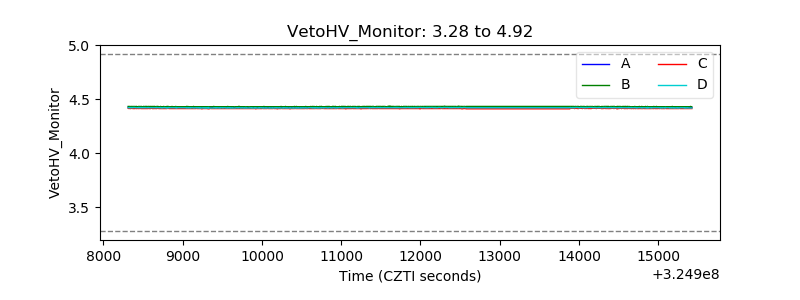 |
| Veto LLD | 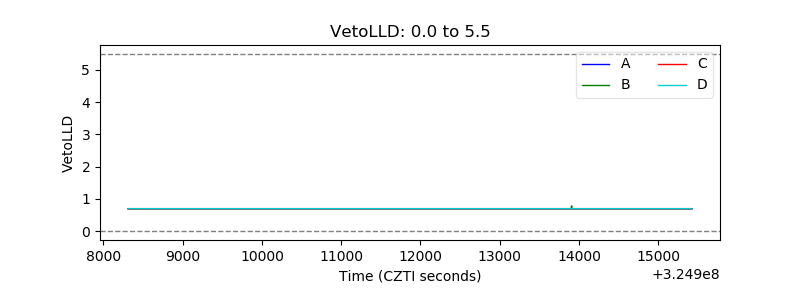 |
| Alpha Counter | 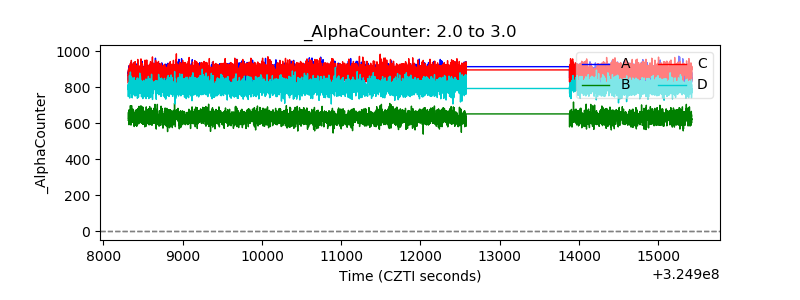 |
| _CPM_Rate | 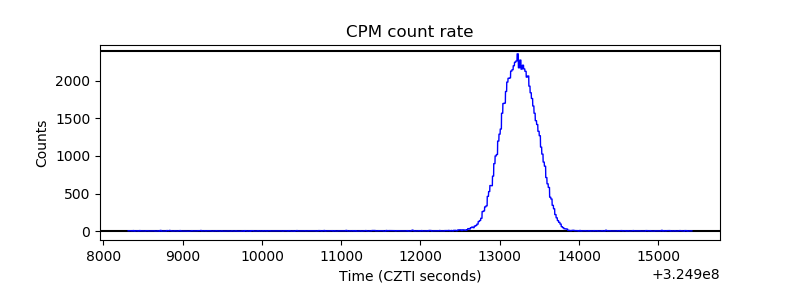 |
| CZT Counter | 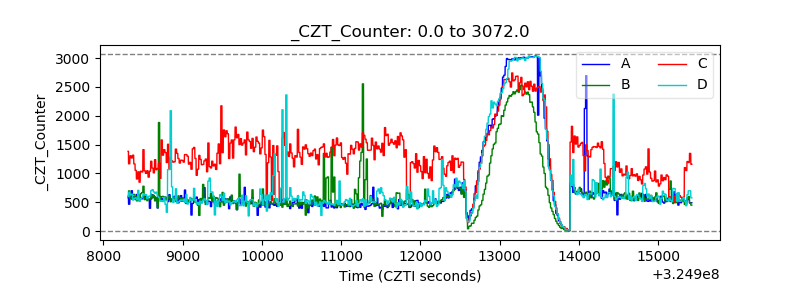 |
| +2.5 Volts monitor |  |
| +5 Volts monitor |  |
| _ROLL_ROT | 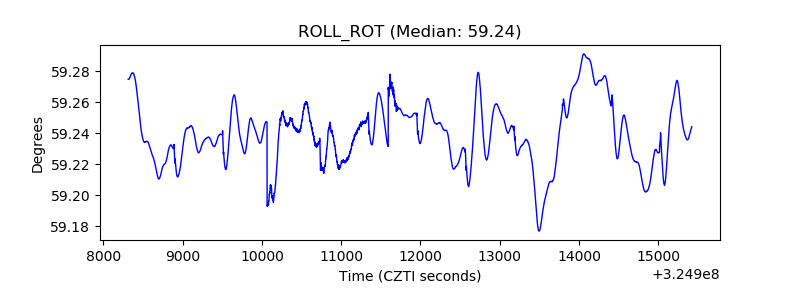 |
| _Roll_DEC | 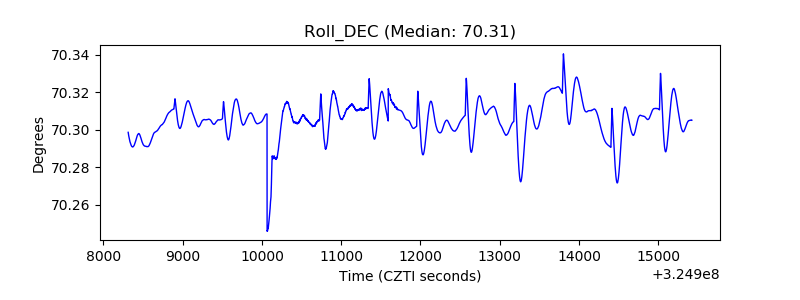 |
| _Roll_RA | 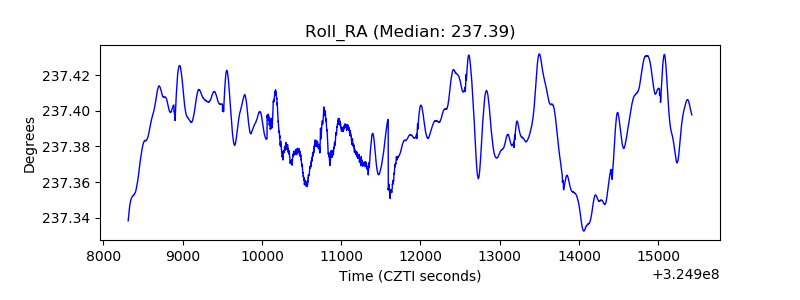 |
| Veto Counter |  |