| Param | Original file | Final file |
|---|---|---|
| Filename | modeM0/AS1C05_012T06_9000003616_24637cztM0_level2.evt | modeM0/AS1C05_012T06_9000003616_24637cztM0_level2_quad_clean.evt |
| Size (bytes) | 533,001,600 | 136,915,200 |
| Size | 508.3 MB | 130.6 MB |
| Events in quadrant A | 3,294,431 | 951,442 |
| Events in quadrant B | 3,329,178 | 960,111 |
| Events in quadrant C | 5,426,576 | 899,962 |
| Events in quadrant D | 3,673,866 | 904,614 |
| Mode M0 | |||
|---|---|---|---|
| Quadrant | BADHDUFLAG | Total packets | Discarded packets |
| A | 0 | 13609 | 1 |
| B | 0 | 13760 | 1 |
| C | 0 | 20561 | 1 |
| D | 0 | 14978 | 1 |
| Mode SS | |||
|---|---|---|---|
| Quadrant | BADHDUFLAG | Total packets | Discarded packets |
| A | 0 | 126 | 0 |
| B | 0 | 126 | 0 |
| C | 0 | 126 | 0 |
| D | 0 | 126 | 0 |
| Mode M9 | |||
|---|---|---|---|
| Quadrant | BADHDUFLAG | Total packets | Discarded packets |
| A | 0 | 13 | 0 |
| B | 0 | 13 | 0 |
| C | 0 | 13 | 0 |
| D | 0 | 13 | 0 |
| Quadrant | Total seconds | Saturated seconds | Saturation percentage |
|---|---|---|---|
| A | 6167 | 145 | 2.351224% |
| B | 6168 | 143 | 2.318418% |
| C | 6168 | 277 | 4.490921% |
| D | 6168 | 123 | 1.994163% |
Noise dominated data is calculated using 1-second bins in cleaned event files. If a bin has >2000 counts, and if more than 50% of those come from <1% of pixels, then it is considered to be noise-dominated and hence unusable.
| Quadrant | # 1 sec bins | Bins with >0 counts | Bins with >2000 counts | High rate bins dominated by noise | Noise dominated (total time) | Noise dominated (detector-on time) | Marked lightcurve |
|---|---|---|---|---|---|---|---|
| A | 7442 | 6167 | 15 | 15 | 0.20% | 0.24% | 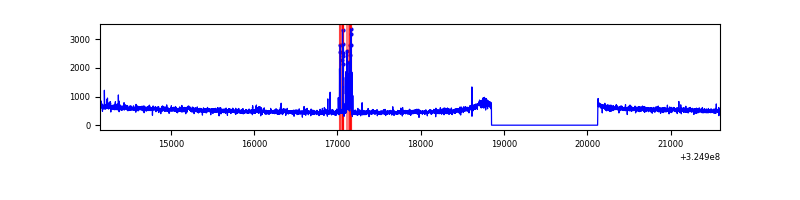 |
| B | 7443 | 6168 | 2 | 2 | 0.03% | 0.03% | 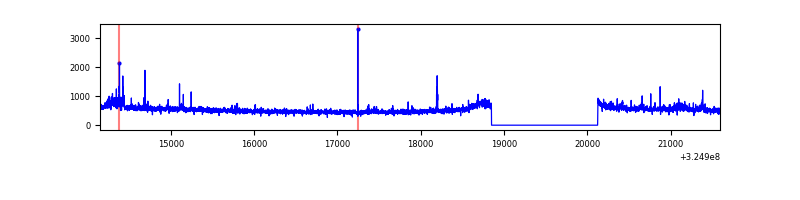 |
| C | 7443 | 6168 | 0 | 0 | 0.00% | 0.00% | 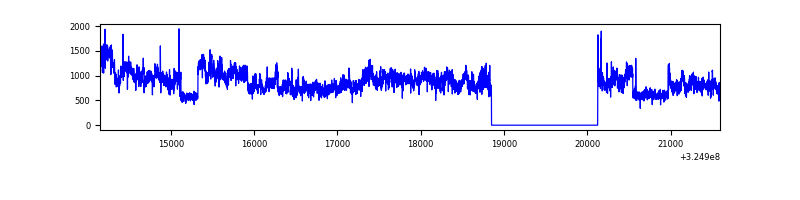 |
| D | 7443 | 6169 | 14 | 14 | 0.19% | 0.23% | 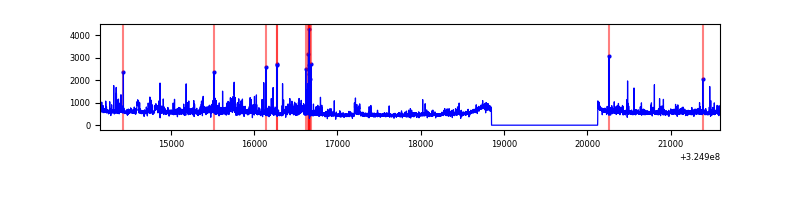 |
Top three noisy pixels from each quadrant. If the there are fewer than three noisy pixels in the level2.evt file, extra rows are filled as -1
| Pixel properties | Quadrant properties | ||||||
|---|---|---|---|---|---|---|---|
| Quadrant | DetID | PixID | Counts | Sigma | Mean | Median | Sigma |
| A | 12 | 96 | 107330 | 654.39 | 824 | 808 | 162.8 |
| A | 6 | 16 | 13226 | 76.29 | 824 | 808 | 162.8 |
| A | 13 | 254 | 9935 | 56.07 | 824 | 808 | 162.8 |
| B | 0 | 230 | 44245 | 290.95 | 812 | 792 | 149.3 |
| B | 5 | 172 | 27482 | 178.71 | 812 | 792 | 149.3 |
| B | 0 | 190 | 20303 | 130.64 | 812 | 792 | 149.3 |
| C | 7 | 247 | 2158756 | 11985.17 | 789 | 795 | 180.1 |
| C | 14 | 238 | 126817 | 699.92 | 789 | 795 | 180.1 |
| C | 3 | 233 | 17104 | 90.58 | 789 | 795 | 180.1 |
| D | 8 | 195 | 301024 | 1566.31 | 811 | 788 | 191.7 |
| D | 1 | 52 | 231225 | 1202.18 | 811 | 788 | 191.7 |
| D | 2 | 234 | 23720 | 119.63 | 811 | 788 | 191.7 |
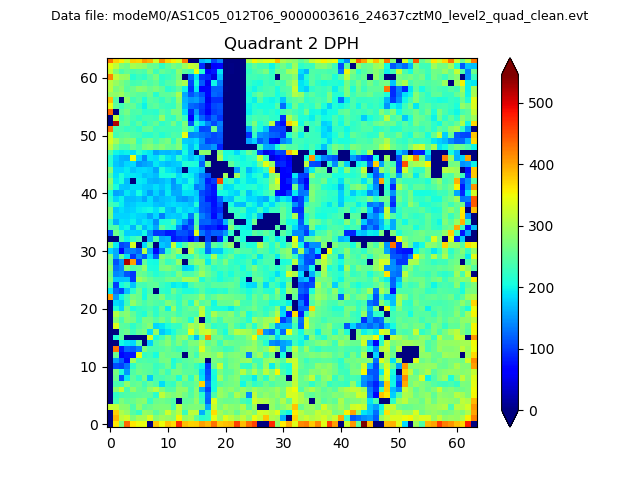
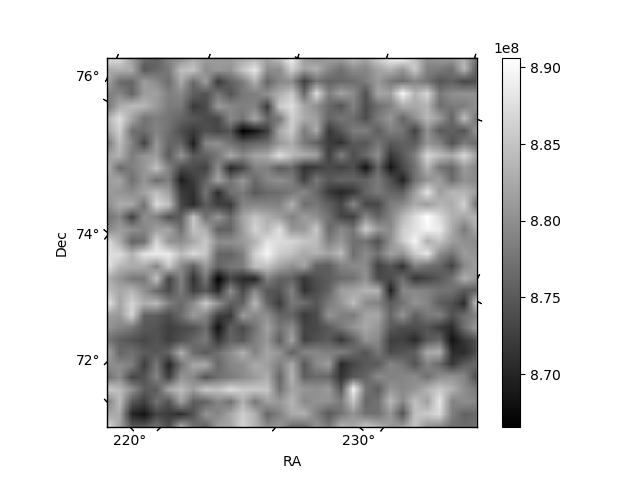
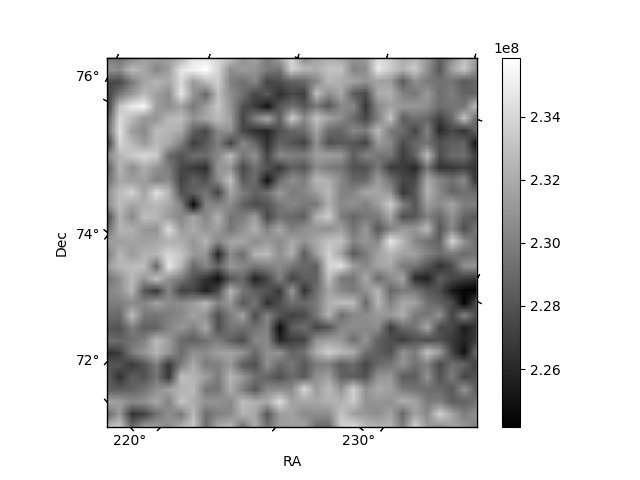
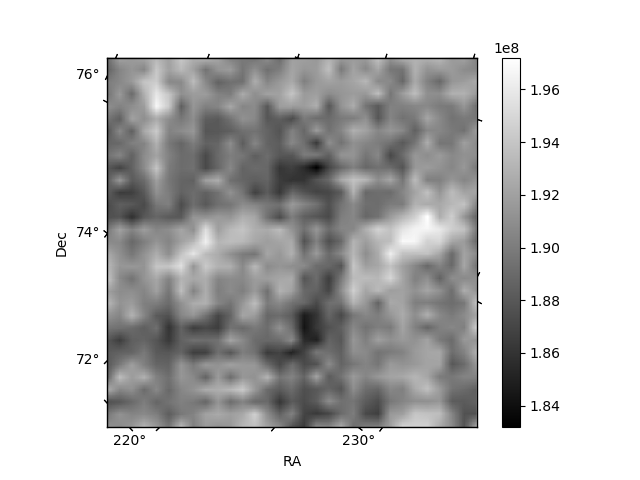
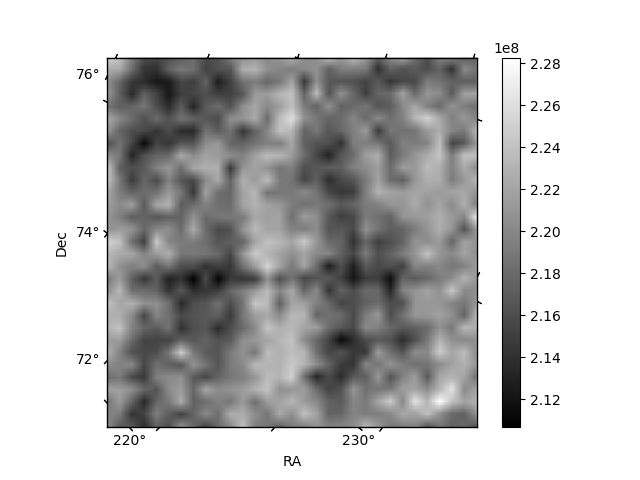
Histogram calculated using DETX and DETY for each event in the final _common_clean file
| Quadrant A | 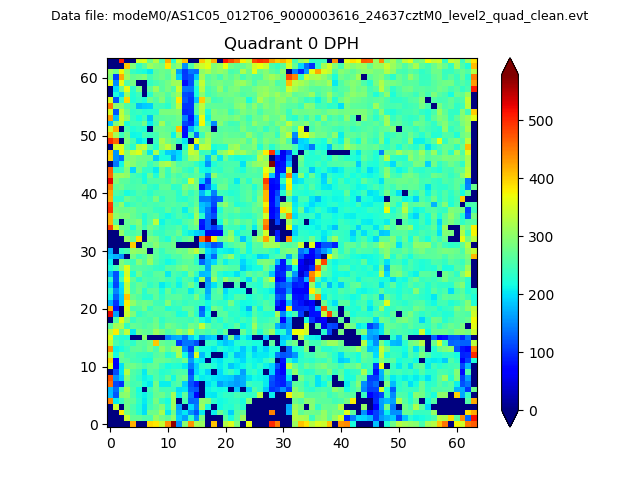 |
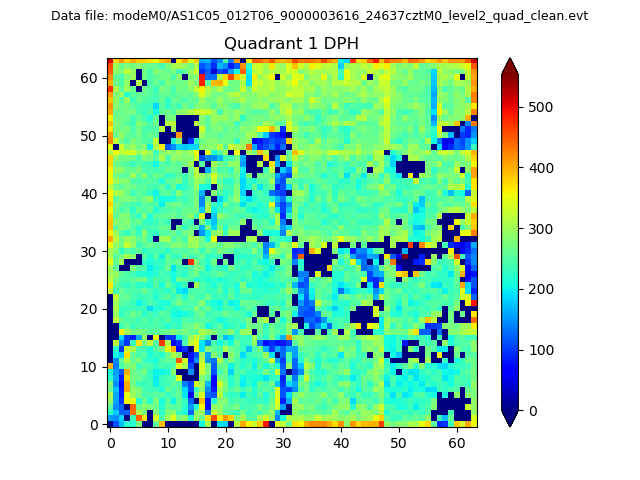 |
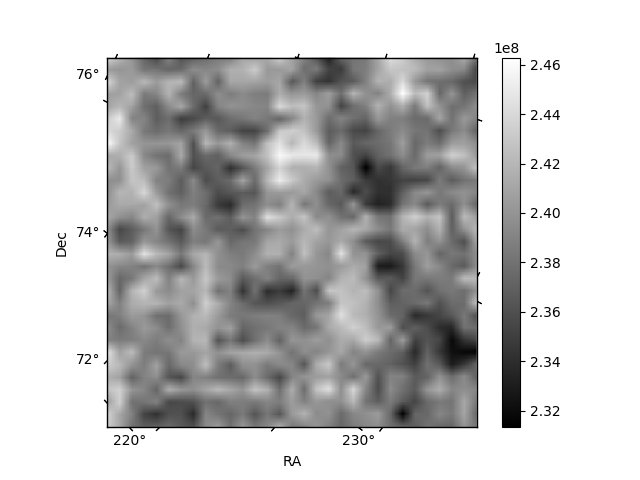
Quadrant B |
|---|---|---|---|
| Quadrant D | 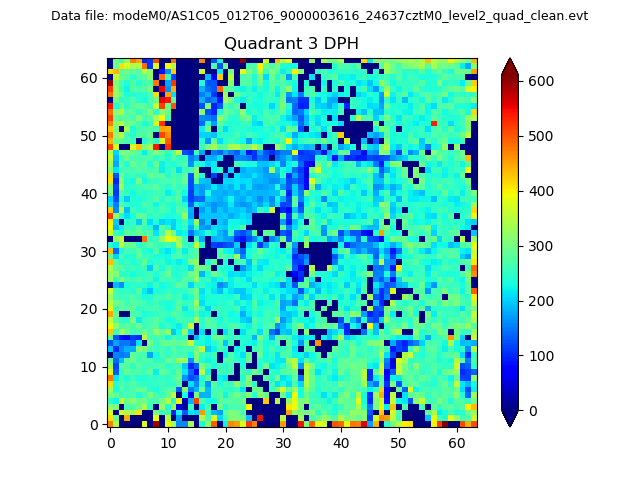 |
 |
Quadrant C |
| Plot type | Count rate plots | Images |
|---|---|---|
| Comparison with Poisson distribution Blue bars denote a histogram of data divided into 1 sec bins. Red curve is a Poisson curve with rate = median count rate of data. |
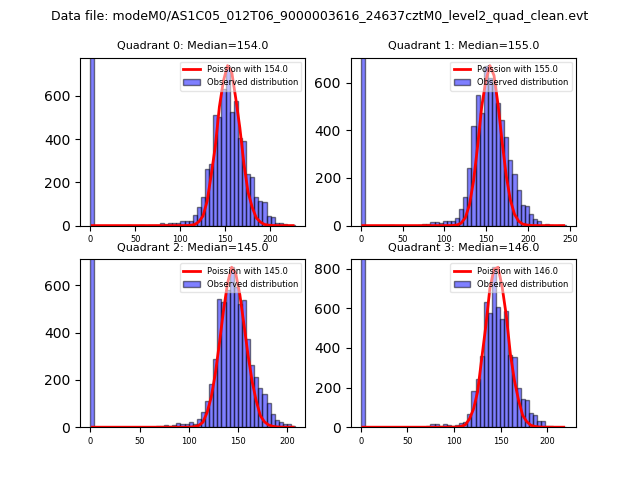 |
 |
| Quadrant-wise count rates Data is divided into 100 sec bins |
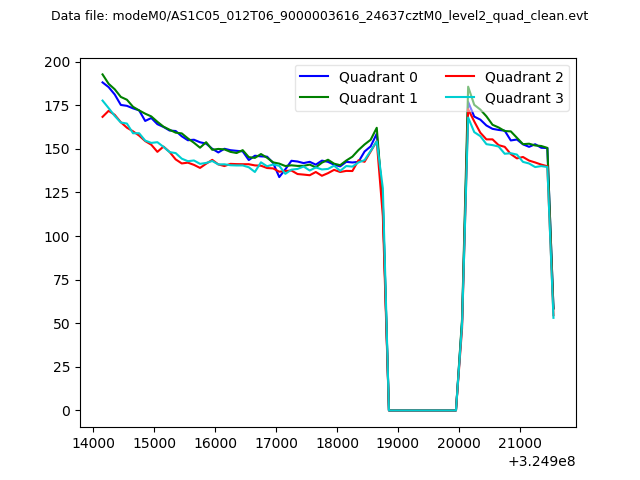 |
|
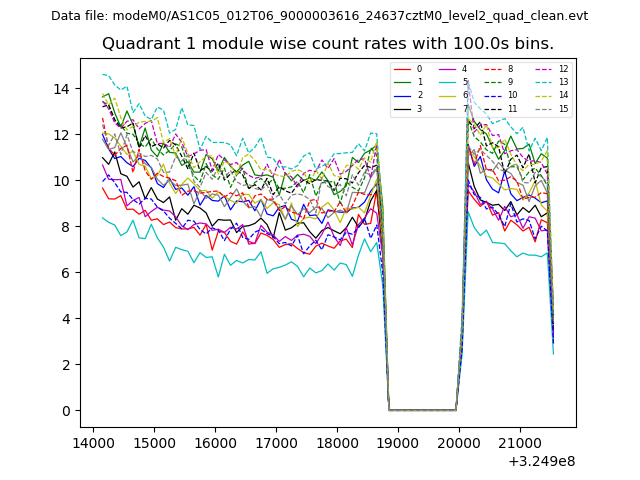
| Module-wise count rates for Quadrant A Data is divided into 100 sec bins |
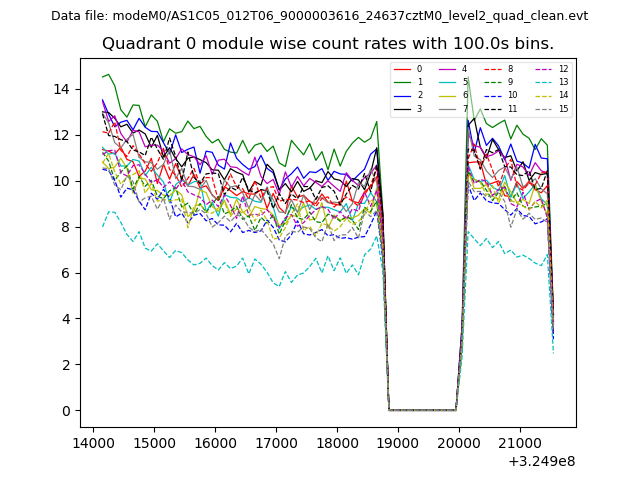 |
 |
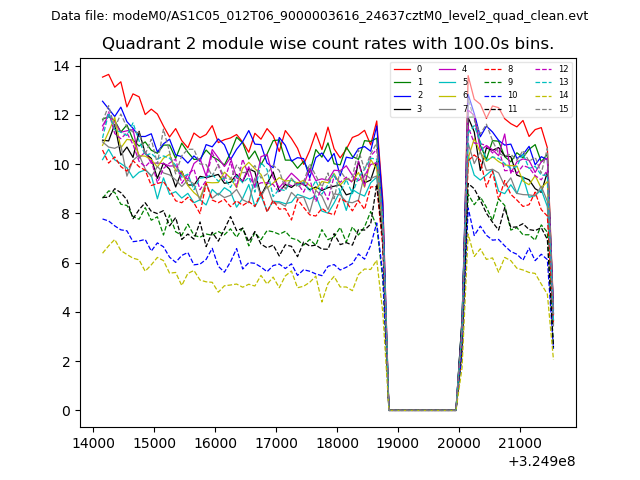
| Module-wise count rates for Quadrant B Data is divided into 100 sec bins |
 |
 |
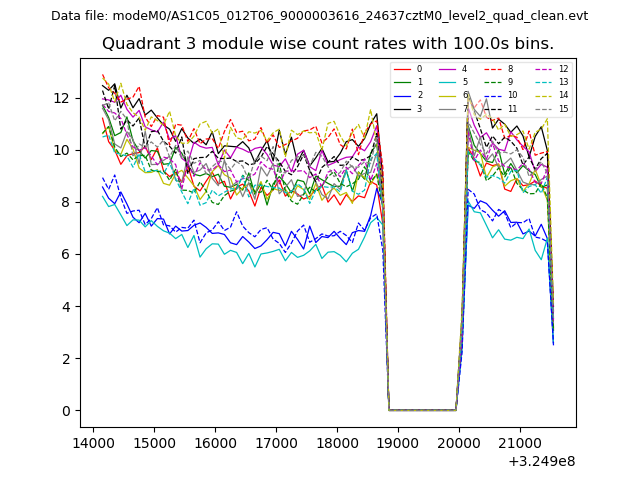
| Module-wise count rates for Quadrant C Data is divided into 100 sec bins |
 |
 |
| Module-wise count rates for Quadrant D Data is divided into 100 sec bins |
 |
 |
| Parameter | Plot |
|---|---|
| CZT HV Monitor | 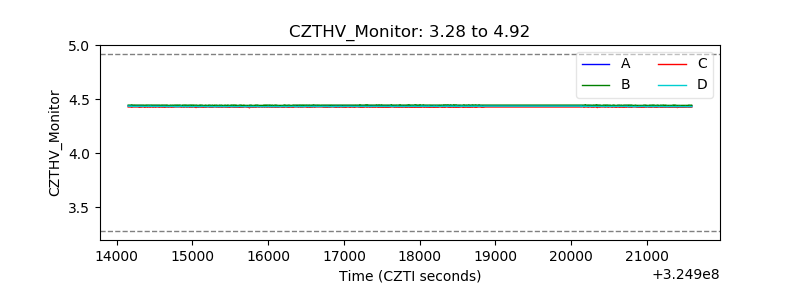 |
| D_VDD | 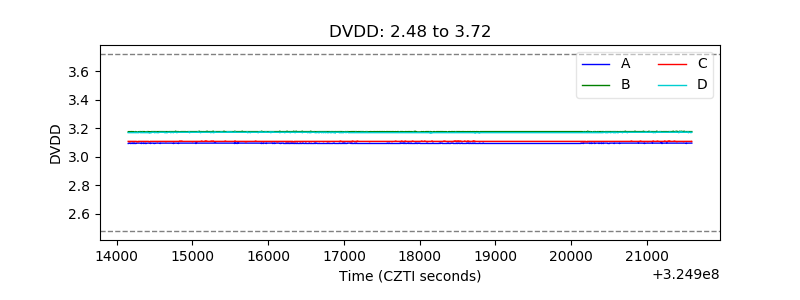 |
| Temperature 1 | 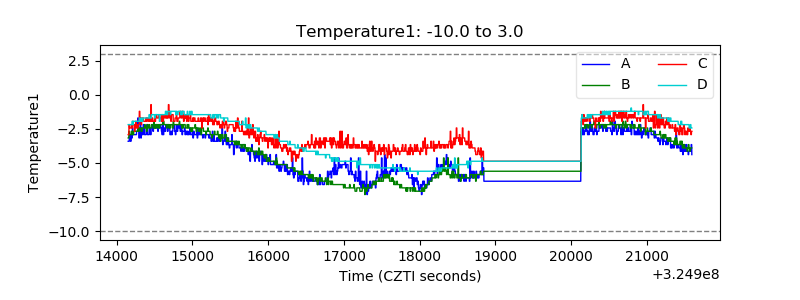 |
| Veto HV Monitor | 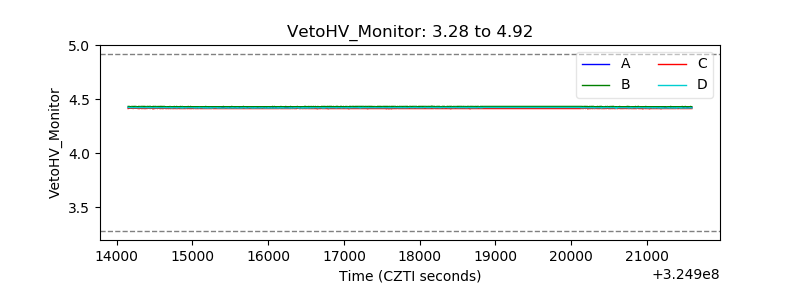 |
| Veto LLD | 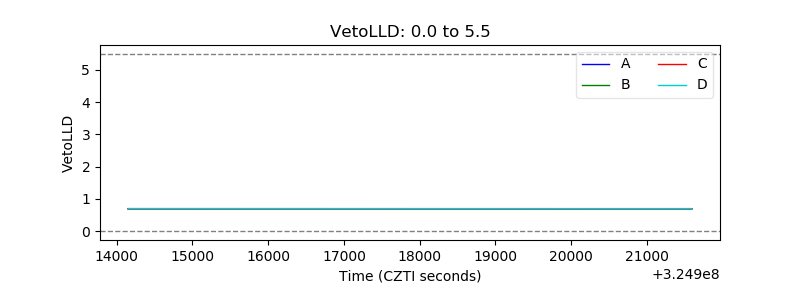 |
| Alpha Counter | 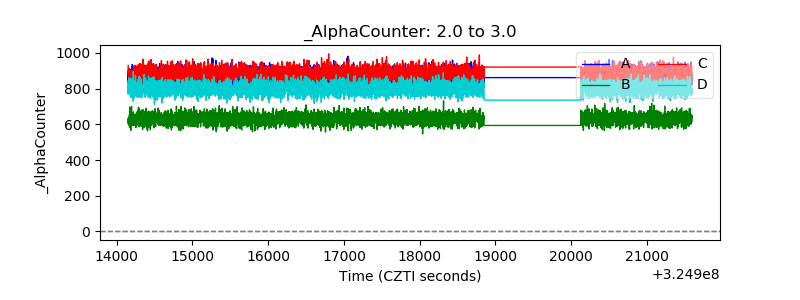 |
| _CPM_Rate | 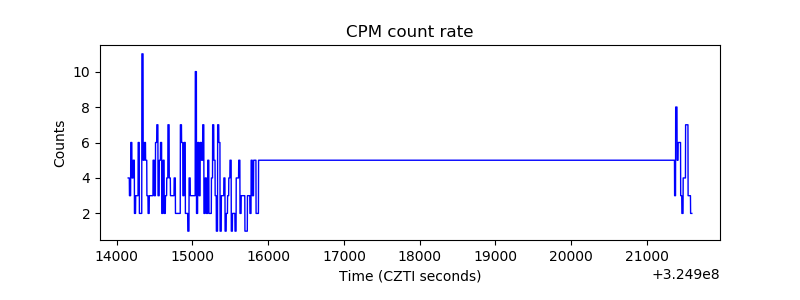 |
| CZT Counter | 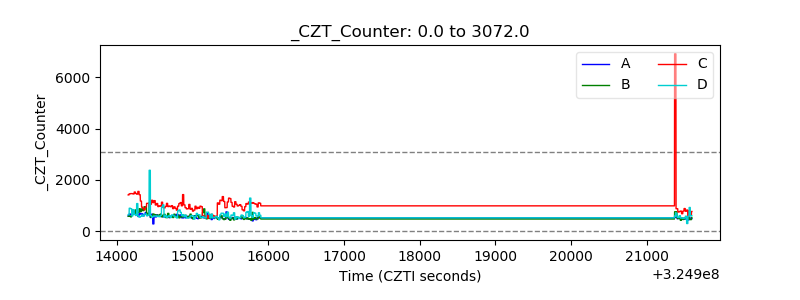 |
| +2.5 Volts monitor |  |
| +5 Volts monitor | 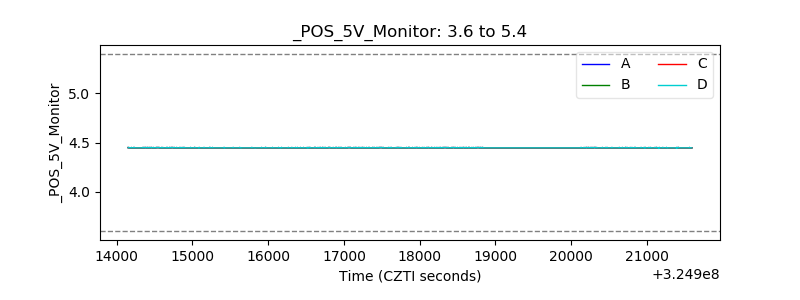 |
| _ROLL_ROT | 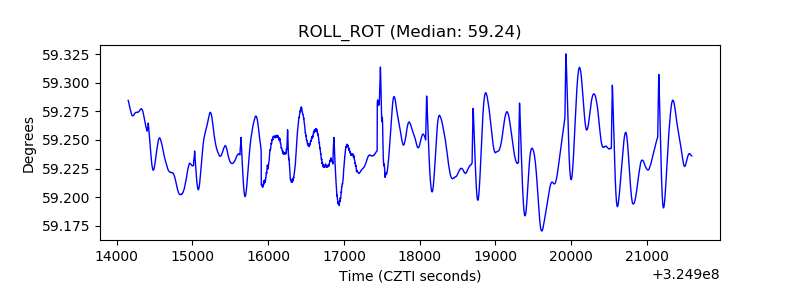 |
| _Roll_DEC | 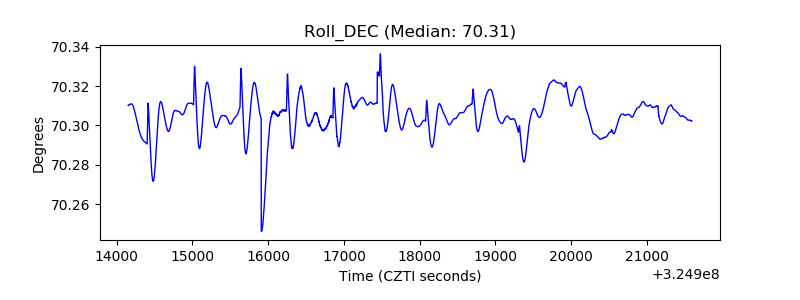 |
| _Roll_RA |  |
| Veto Counter | 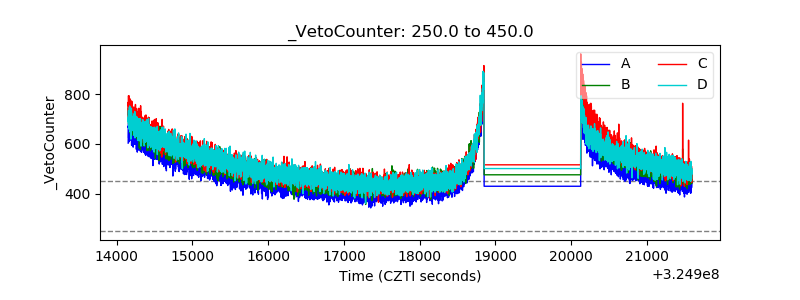 |