| Param | Original file | Final file |
|---|---|---|
| Filename | modeM0/AS1C05_012T06_9000003616_24638cztM0_level2.evt | modeM0/AS1C05_012T06_9000003616_24638cztM0_level2_quad_clean.evt |
| Size (bytes) | 498,294,720 | 136,048,320 |
| Size | 475.2 MB | 129.7 MB |
| Events in quadrant A | 3,204,555 | 932,885 |
| Events in quadrant B | 3,412,181 | 944,586 |
| Events in quadrant C | 4,422,903 | 898,189 |
| Events in quadrant D | 3,612,114 | 893,549 |
| Mode M0 | |||
|---|---|---|---|
| Quadrant | BADHDUFLAG | Total packets | Discarded packets |
| A | 0 | 13626 | 3 |
| B | 0 | 14246 | 3 |
| C | 0 | 17546 | 3 |
| D | 0 | 14910 | 3 |
| Mode SS | |||
|---|---|---|---|
| Quadrant | BADHDUFLAG | Total packets | Discarded packets |
| A | 0 | 132 | 0 |
| B | 0 | 132 | 0 |
| C | 0 | 132 | 0 |
| D | 0 | 132 | 0 |
| Mode M9 | |||
|---|---|---|---|
| Quadrant | BADHDUFLAG | Total packets | Discarded packets |
| A | 0 | 10 | 0 |
| B | 0 | 10 | 0 |
| C | 0 | 10 | 0 |
| D | 0 | 10 | 0 |
| Quadrant | Total seconds | Saturated seconds | Saturation percentage |
|---|---|---|---|
| A | 6472 | 97 | 1.498764% |
| B | 6473 | 110 | 1.699367% |
| C | 6473 | 209 | 3.228797% |
| D | 6473 | 98 | 1.513981% |
Noise dominated data is calculated using 1-second bins in cleaned event files. If a bin has >2000 counts, and if more than 50% of those come from <1% of pixels, then it is considered to be noise-dominated and hence unusable.
| Quadrant | # 1 sec bins | Bins with >0 counts | Bins with >2000 counts | High rate bins dominated by noise | Noise dominated (total time) | Noise dominated (detector-on time) | Marked lightcurve |
|---|---|---|---|---|---|---|---|
| A | 7537 | 6474 | 0 | 0 | 0.00% | 0.00% | 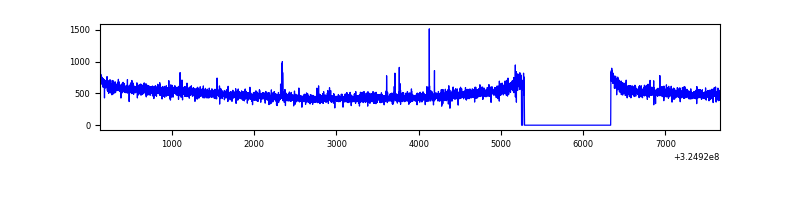 |
| B | 7538 | 6475 | 1 | 1 | 0.01% | 0.02% | 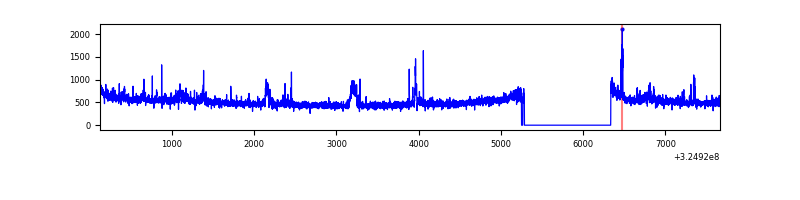 |
| C | 7538 | 6475 | 0 | 0 | 0.00% | 0.00% | 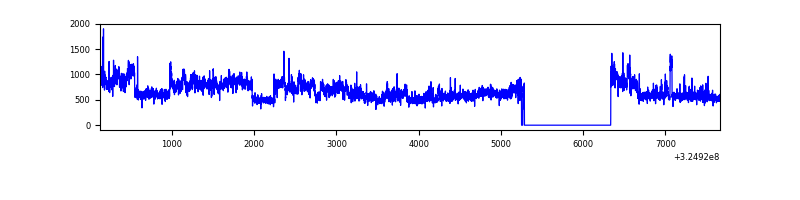 |
| D | 7538 | 6475 | 11 | 11 | 0.15% | 0.17% | 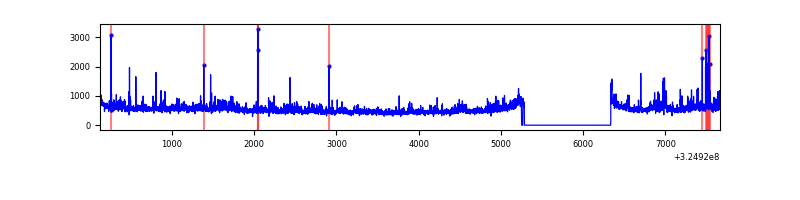 |
Top three noisy pixels from each quadrant. If the there are fewer than three noisy pixels in the level2.evt file, extra rows are filled as -1
| Pixel properties | Quadrant properties | ||||||
|---|---|---|---|---|---|---|---|
| Quadrant | DetID | PixID | Counts | Sigma | Mean | Median | Sigma |
| A | 6 | 16 | 13759 | 78.78 | 826 | 809 | 164.4 |
| A | 13 | 254 | 11099 | 62.6 | 826 | 809 | 164.4 |
| A | 3 | 137 | 7331 | 39.68 | 826 | 809 | 164.4 |
| B | 0 | 189 | 89745 | 581.39 | 820 | 800 | 153.0 |
| B | 0 | 190 | 42910 | 275.25 | 820 | 800 | 153.0 |
| B | 5 | 172 | 36746 | 234.96 | 820 | 800 | 153.0 |
| C | 7 | 247 | 1087403 | 5962.41 | 797 | 801 | 182.2 |
| C | 14 | 238 | 127883 | 697.32 | 797 | 801 | 182.2 |
| C | 10 | 91 | 40440 | 217.51 | 797 | 801 | 182.2 |
| D | 8 | 195 | 385709 | 1981.03 | 812 | 788 | 194.3 |
| D | 1 | 52 | 52162 | 264.4 | 812 | 788 | 194.3 |
| D | 7 | 238 | 38110 | 192.08 | 812 | 788 | 194.3 |
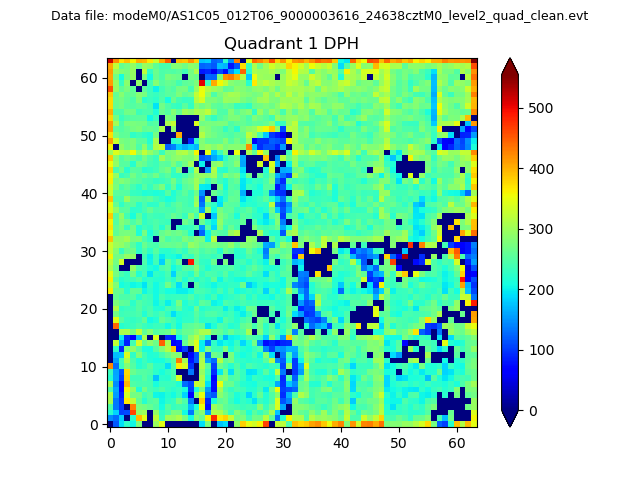
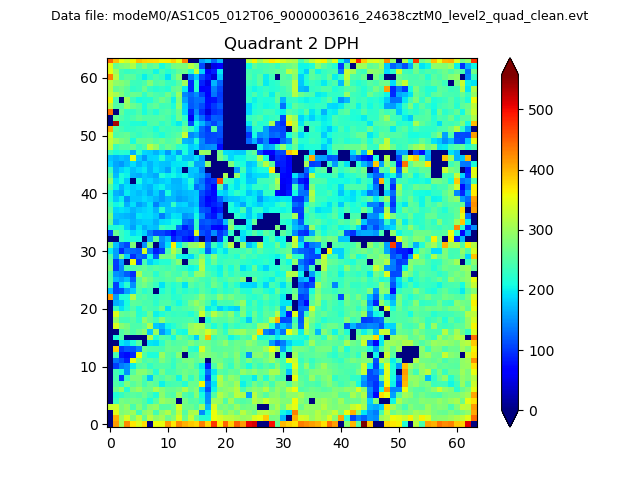
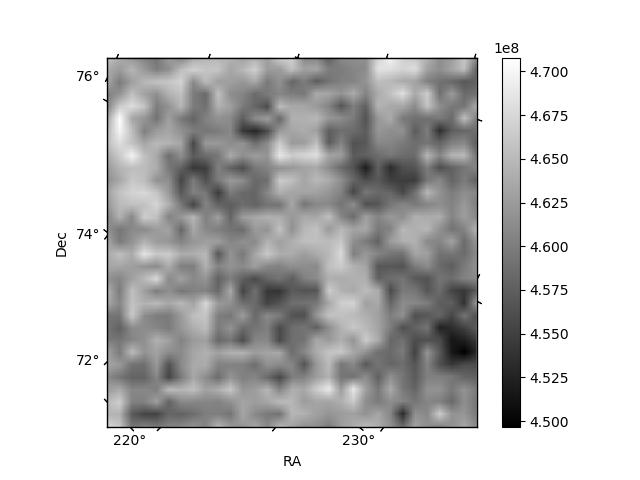
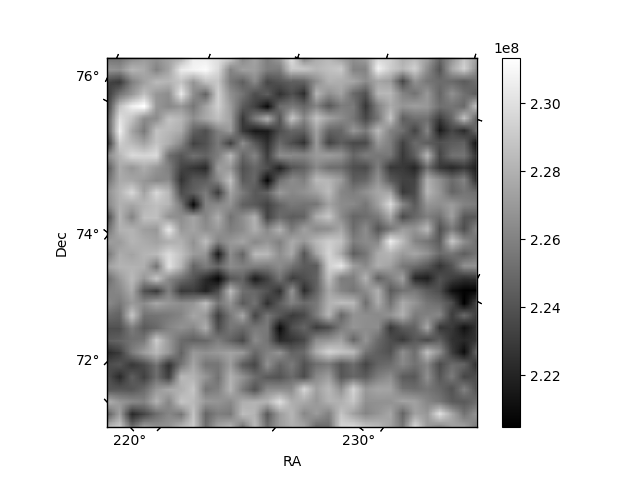
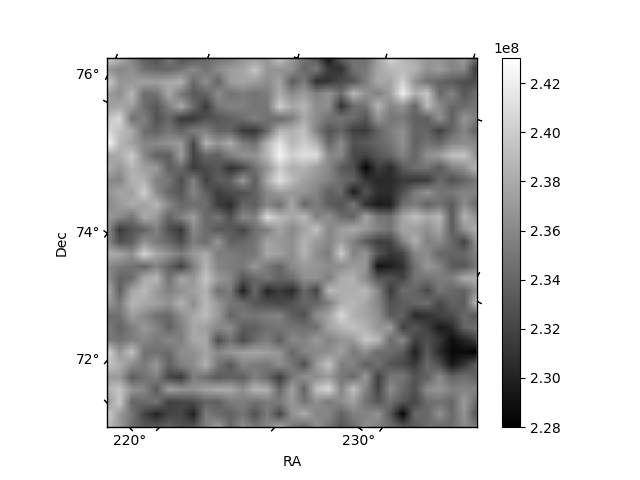
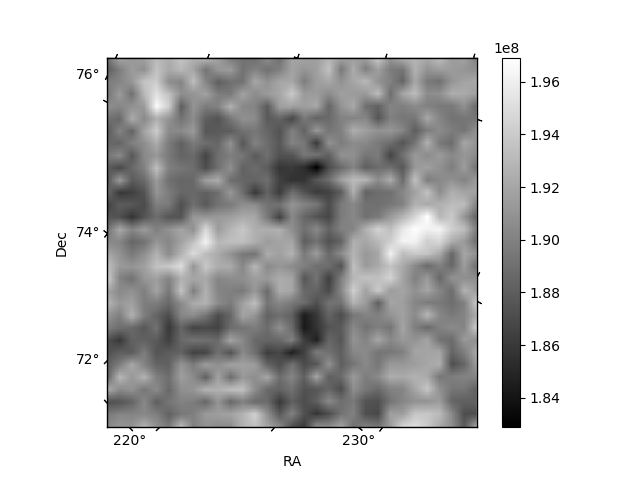
Histogram calculated using DETX and DETY for each event in the final _common_clean file
| Quadrant A |  |
 |
Quadrant B |
|---|---|---|---|
| Quadrant D | 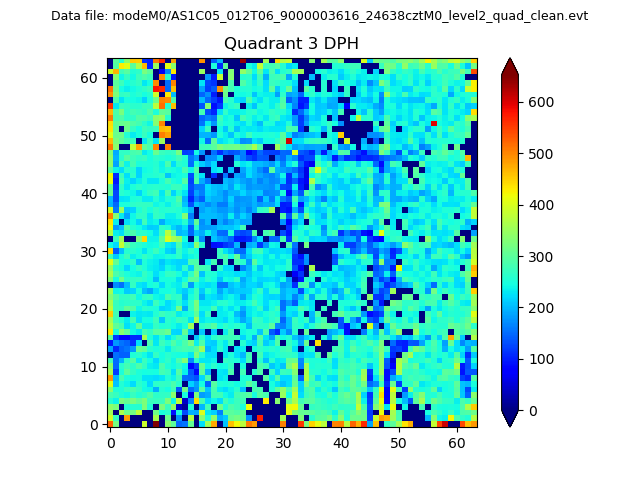 |
 |
Quadrant C |
| Plot type | Count rate plots | Images |
|---|---|---|
| Comparison with Poisson distribution Blue bars denote a histogram of data divided into 1 sec bins. Red curve is a Poisson curve with rate = median count rate of data. |
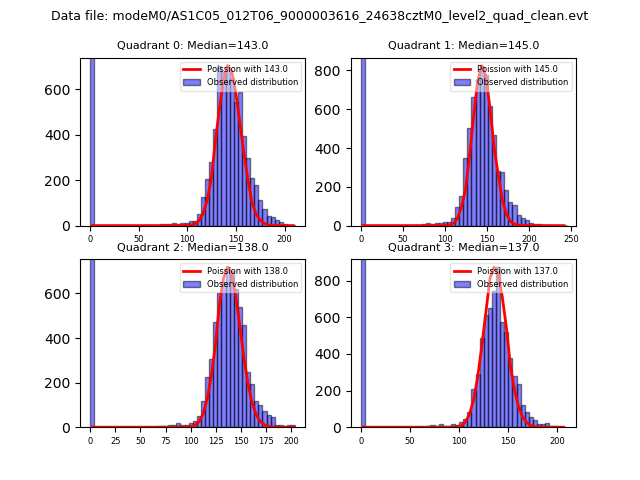 |
 |
| Quadrant-wise count rates Data is divided into 100 sec bins |
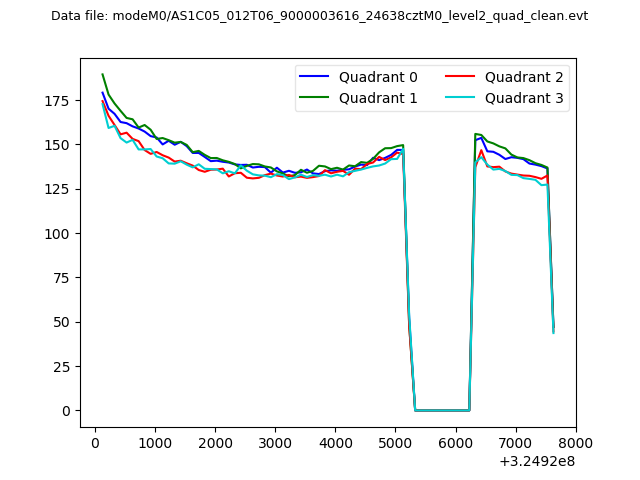 |
|
| Module-wise count rates for Quadrant A Data is divided into 100 sec bins |
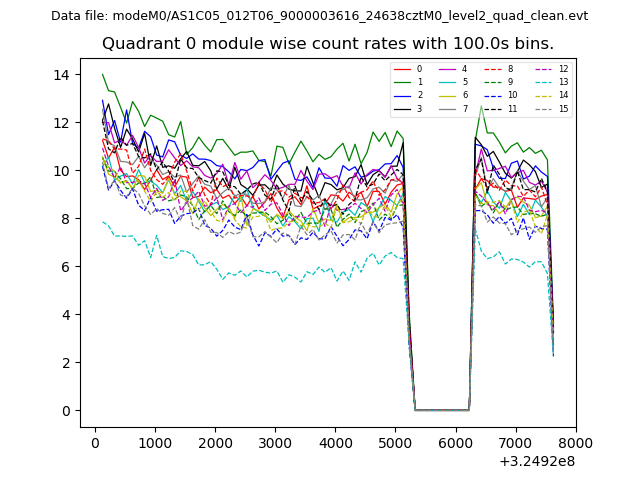 |
 |
| Module-wise count rates for Quadrant B Data is divided into 100 sec bins |
 |
 |
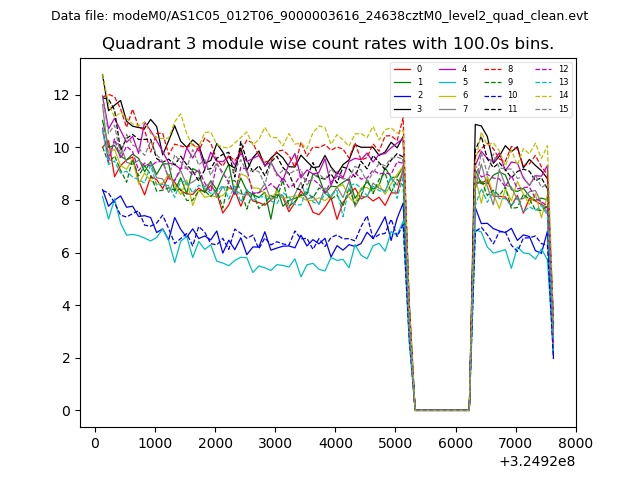
| Module-wise count rates for Quadrant C Data is divided into 100 sec bins |
 |
 |
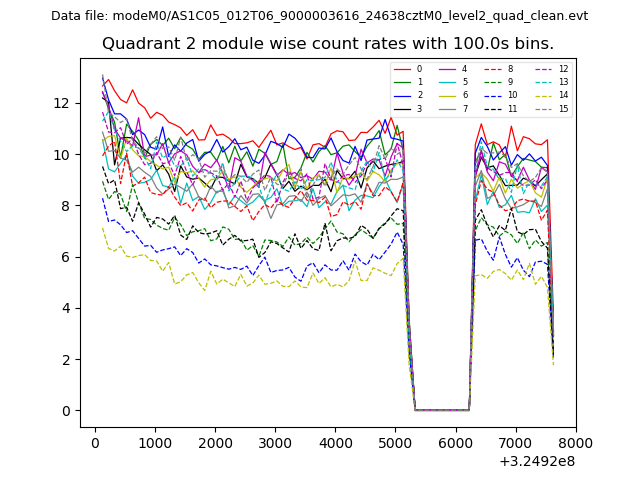
| Module-wise count rates for Quadrant D Data is divided into 100 sec bins |
 |
 |
| Parameter | Plot |
|---|---|
| CZT HV Monitor | 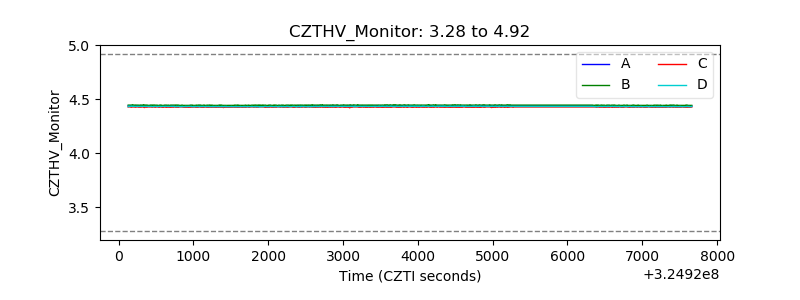 |
| D_VDD | 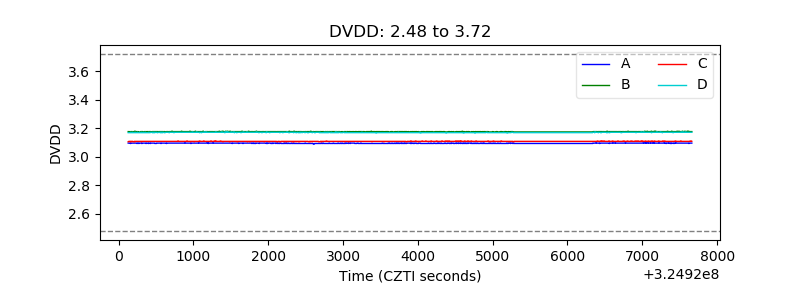 |
| Temperature 1 | 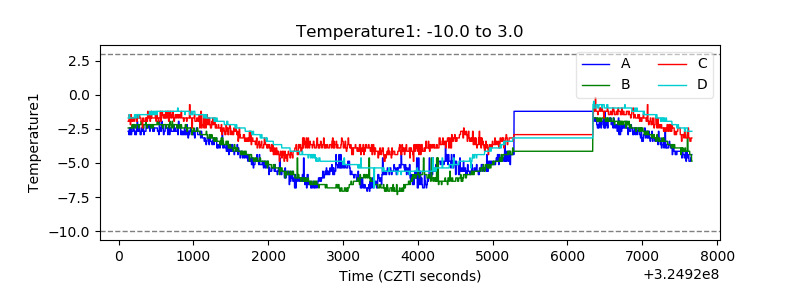 |
| Veto HV Monitor | 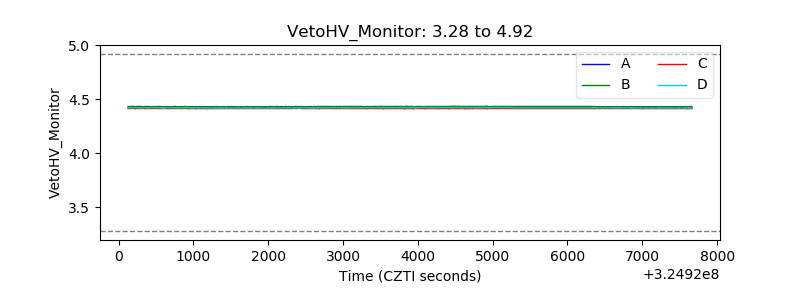 |
| Veto LLD | 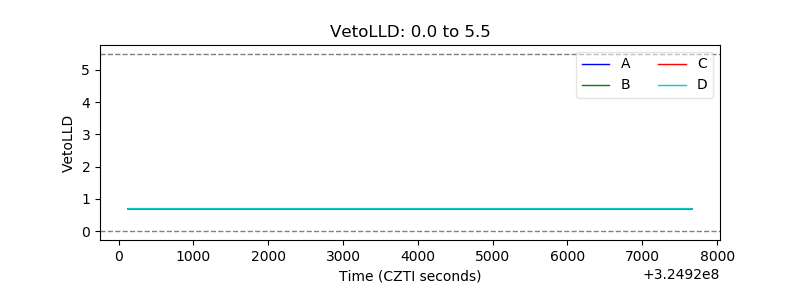 |
| Alpha Counter | 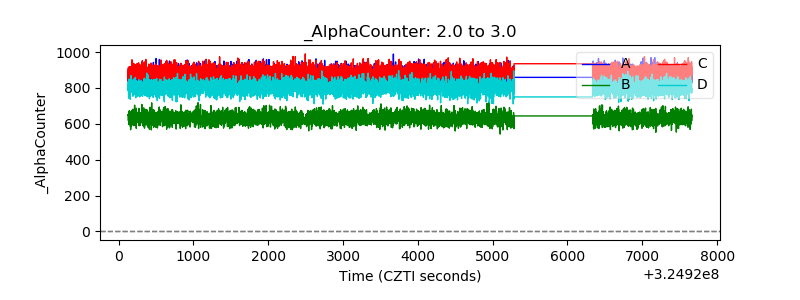 |
| _CPM_Rate | 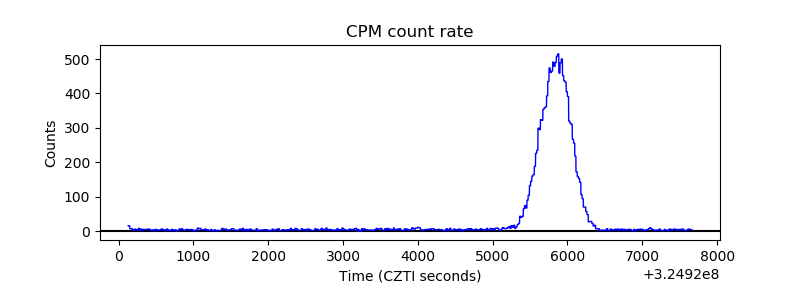 |
| CZT Counter | 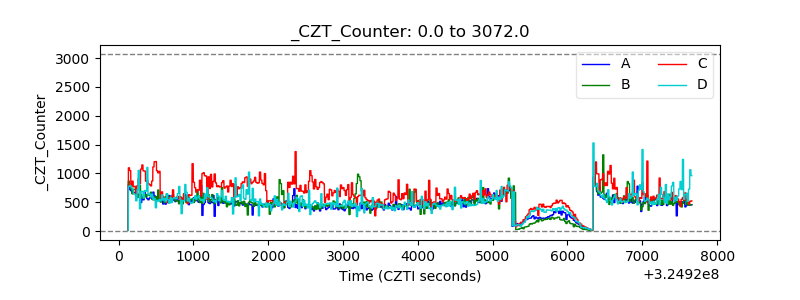 |
| +2.5 Volts monitor |  |
| +5 Volts monitor | 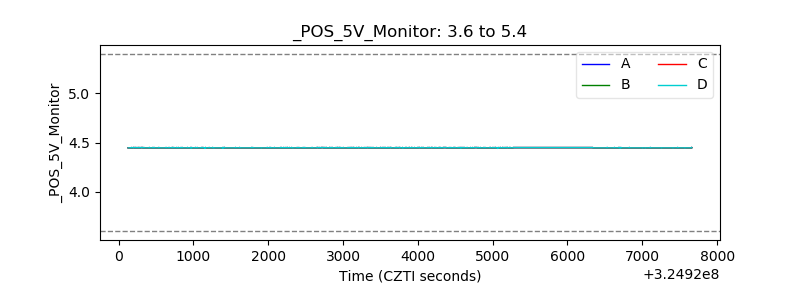 |
| _ROLL_ROT | 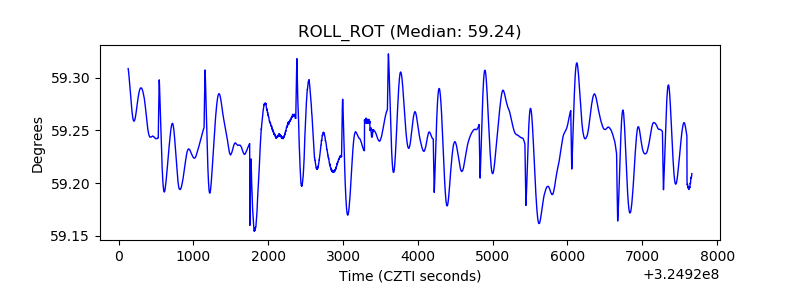 |
| _Roll_DEC | 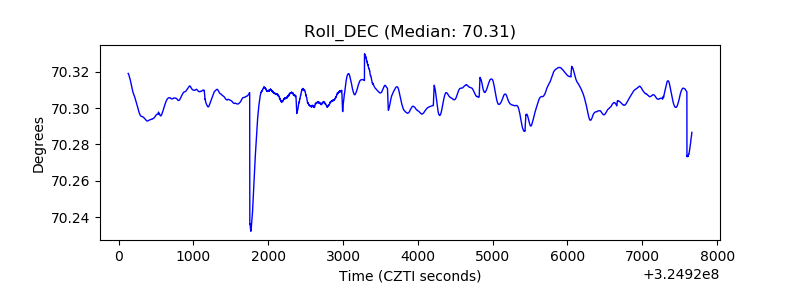 |
| _Roll_RA | 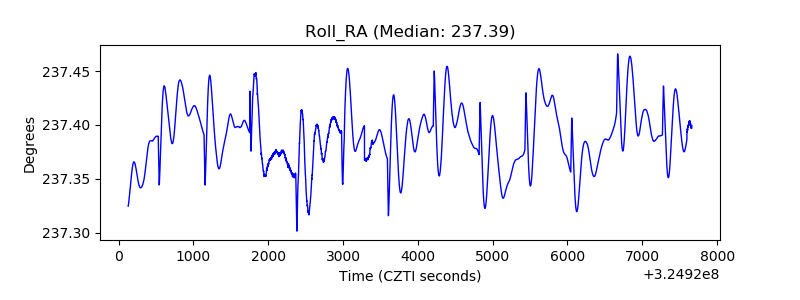 |
| Veto Counter | 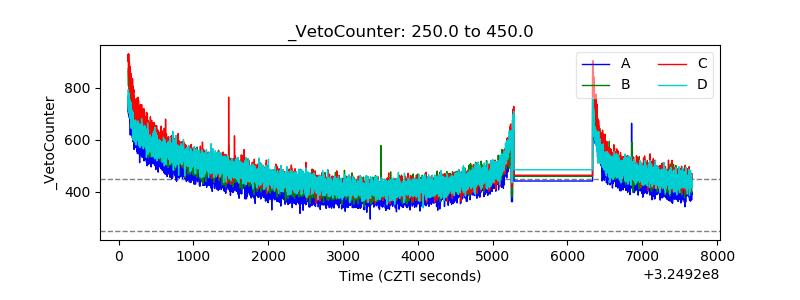 |