| Param | Original file | Final file |
|---|---|---|
| Filename | modeM0/AS1C05_012T06_9000003616_24640cztM0_level2.evt | modeM0/AS1C05_012T06_9000003616_24640cztM0_level2_quad_clean.evt |
| Size (bytes) | 586,465,920 | 141,963,840 |
| Size | 559.3 MB | 135.4 MB |
| Events in quadrant A | 4,077,372 | 960,908 |
| Events in quadrant B | 3,608,516 | 977,374 |
| Events in quadrant C | 4,552,583 | 930,121 |
| Events in quadrant D | 5,019,640 | 914,722 |
| Mode M0 | |||
|---|---|---|---|
| Quadrant | BADHDUFLAG | Total packets | Discarded packets |
| A | 0 | 17043 | 2 |
| B | 0 | 15647 | 2 |
| C | 0 | 18256 | 2 |
| D | 0 | 19935 | 2 |
| Mode SS | |||
|---|---|---|---|
| Quadrant | BADHDUFLAG | Total packets | Discarded packets |
| A | 0 | 152 | 0 |
| B | 0 | 152 | 0 |
| C | 0 | 152 | 0 |
| D | 0 | 152 | 0 |
| Mode M9 | |||
|---|---|---|---|
| Quadrant | BADHDUFLAG | Total packets | Discarded packets |
| A | 0 | 10 | 0 |
| B | 0 | 11 | 0 |
| C | 0 | 11 | 0 |
| D | 0 | 11 | 0 |
| Quadrant | Total seconds | Saturated seconds | Saturation percentage |
|---|---|---|---|
| A | 7427 | 88 | 1.184866% |
| B | 7427 | 46 | 0.619362% |
| C | 7427 | 281 | 3.783493% |
| D | 7427 | 192 | 2.585162% |
Noise dominated data is calculated using 1-second bins in cleaned event files. If a bin has >2000 counts, and if more than 50% of those come from <1% of pixels, then it is considered to be noise-dominated and hence unusable.
| Quadrant | # 1 sec bins | Bins with >0 counts | Bins with >2000 counts | High rate bins dominated by noise | Noise dominated (total time) | Noise dominated (detector-on time) | Marked lightcurve |
|---|---|---|---|---|---|---|---|
| A | 7792 | 7428 | 27 | 27 | 0.35% | 0.36% | 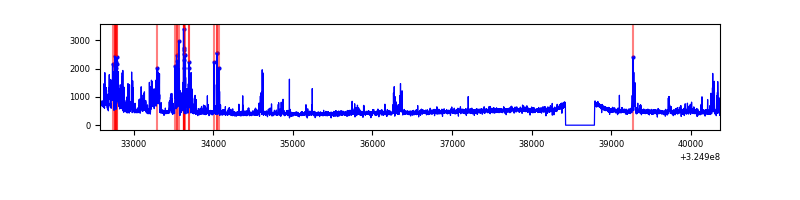 |
| B | 7792 | 7428 | 10 | 10 | 0.13% | 0.13% | 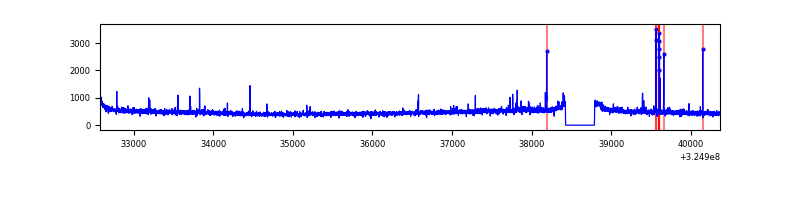 |
| C | 7792 | 7428 | 49 | 49 | 0.63% | 0.66% |  |
| D | 7792 | 7428 | 172 | 172 | 2.21% | 2.32% | 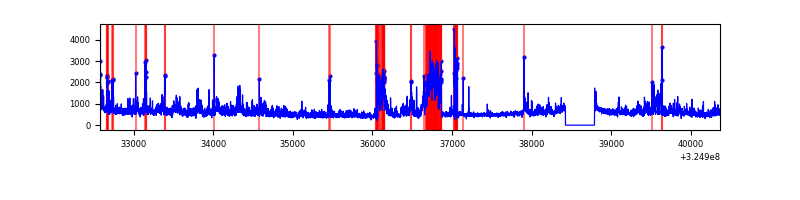 |
Top three noisy pixels from each quadrant. If the there are fewer than three noisy pixels in the level2.evt file, extra rows are filled as -1
| Pixel properties | Quadrant properties | ||||||
|---|---|---|---|---|---|---|---|
| Quadrant | DetID | PixID | Counts | Sigma | Mean | Median | Sigma |
| A | 6 | 16 | 582812 | 3276.52 | 889 | 870 | 177.6 |
| A | 15 | 223 | 46578 | 257.35 | 889 | 870 | 177.6 |
| A | 13 | 254 | 13886 | 73.28 | 889 | 870 | 177.6 |
| B | 5 | 172 | 64825 | 383.79 | 888 | 864 | 166.7 |
| B | 0 | 190 | 33488 | 195.76 | 888 | 864 | 166.7 |
| B | 12 | 111 | 20529 | 118.0 | 888 | 864 | 166.7 |
| C | 7 | 247 | 676198 | 3386.95 | 858 | 864 | 199.4 |
| C | 2 | 16 | 263835 | 1318.86 | 858 | 864 | 199.4 |
| C | 14 | 238 | 138098 | 688.26 | 858 | 864 | 199.4 |
| D | 8 | 195 | 866027 | 4112.55 | 868 | 842 | 210.4 |
| D | 7 | 238 | 597698 | 2837.08 | 868 | 842 | 210.4 |
| D | 1 | 52 | 156078 | 737.9 | 868 | 842 | 210.4 |
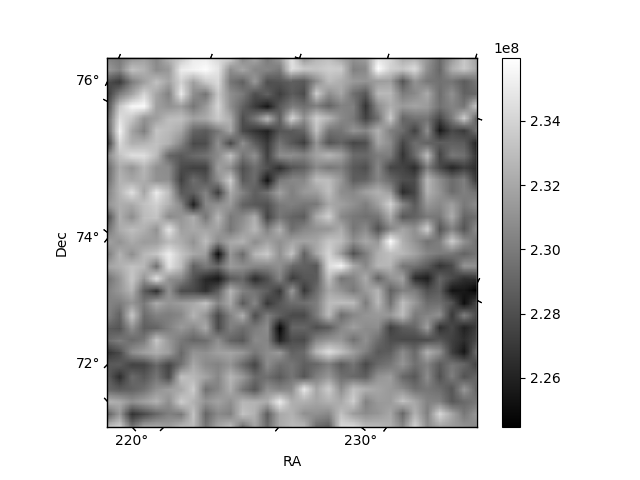
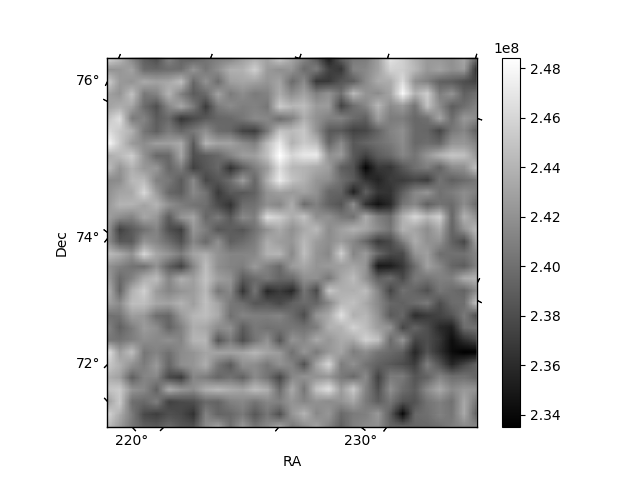
Histogram calculated using DETX and DETY for each event in the final _common_clean file
| Quadrant A | 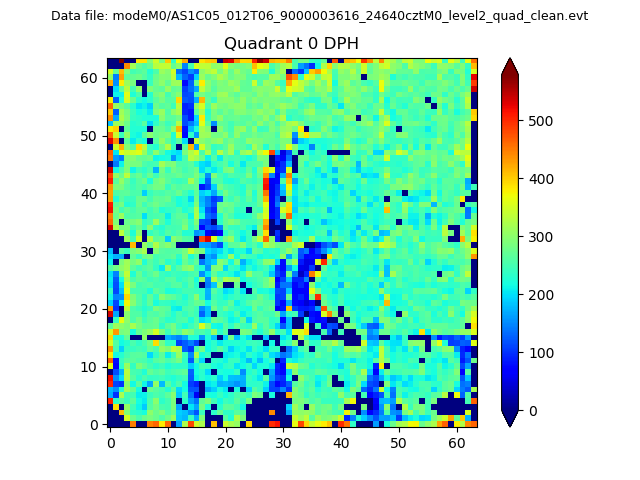 |
 |
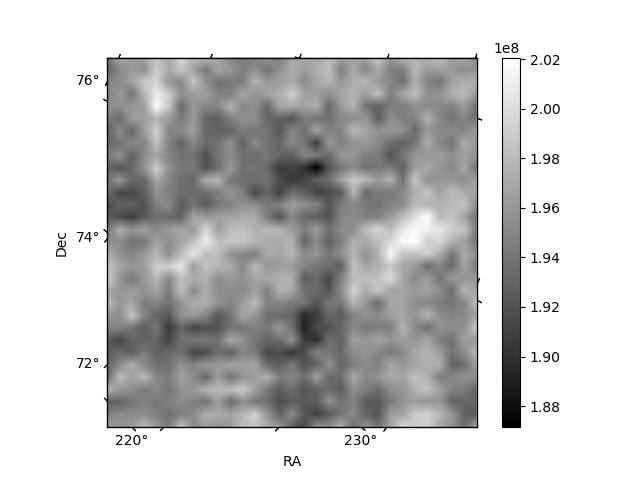
Quadrant B |
|---|---|---|---|
| Quadrant D | 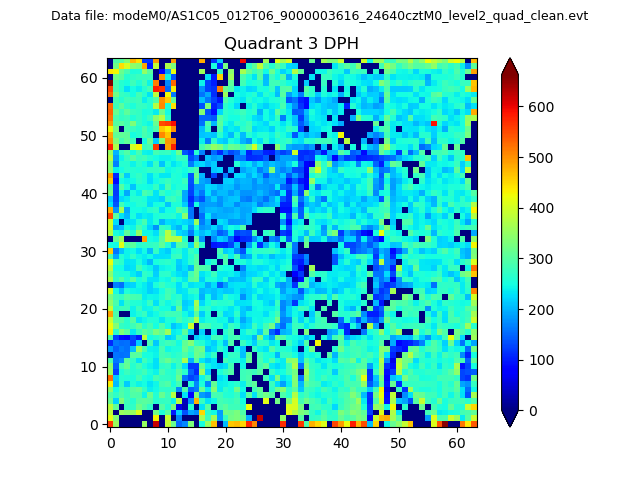 |
 |
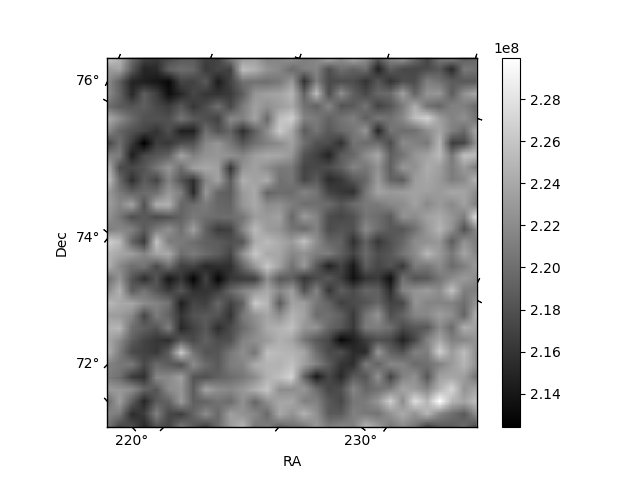
Quadrant C |
| Plot type | Count rate plots | Images |
|---|---|---|
| Comparison with Poisson distribution Blue bars denote a histogram of data divided into 1 sec bins. Red curve is a Poisson curve with rate = median count rate of data. |
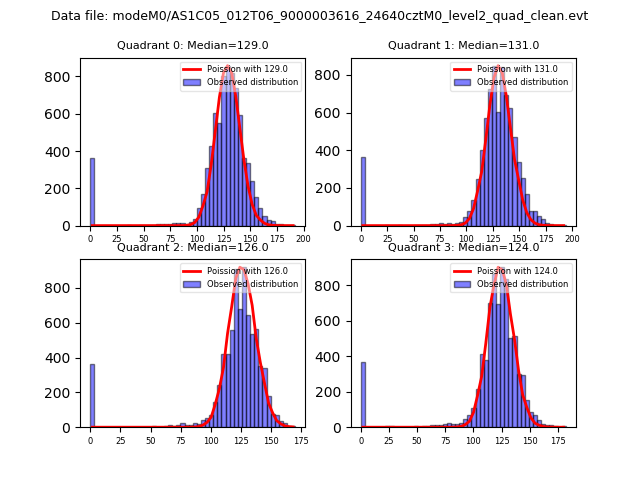 |
 |
| Quadrant-wise count rates Data is divided into 100 sec bins |
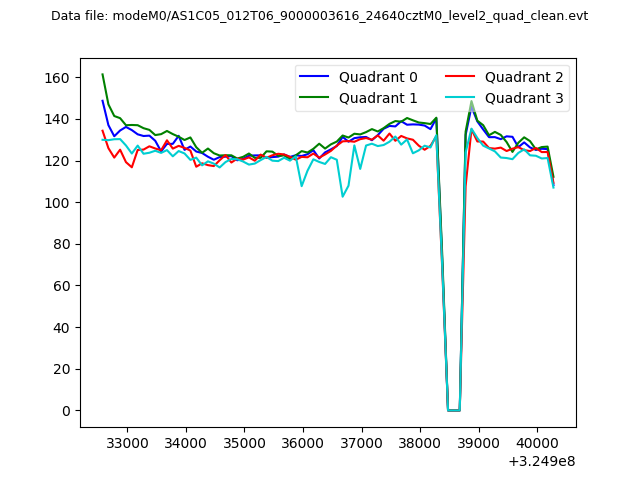 |
|
| Module-wise count rates for Quadrant A Data is divided into 100 sec bins |
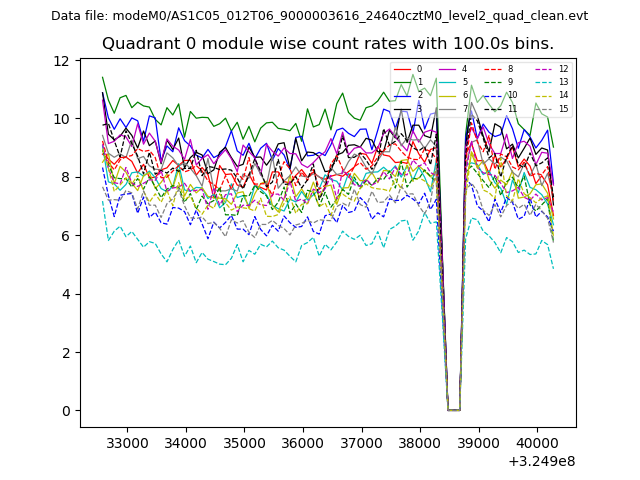 |
 |
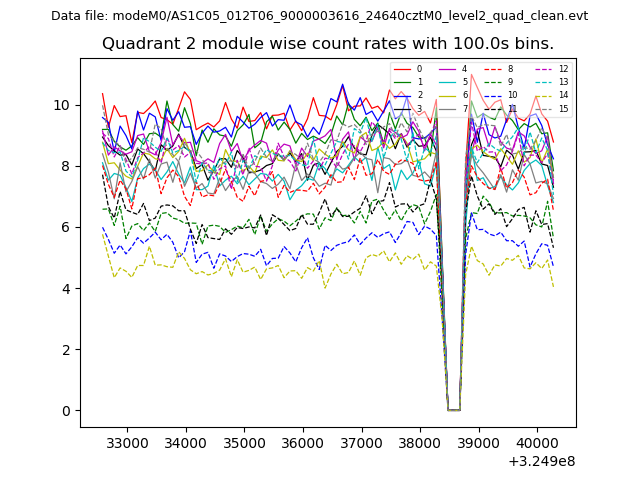
| Module-wise count rates for Quadrant B Data is divided into 100 sec bins |
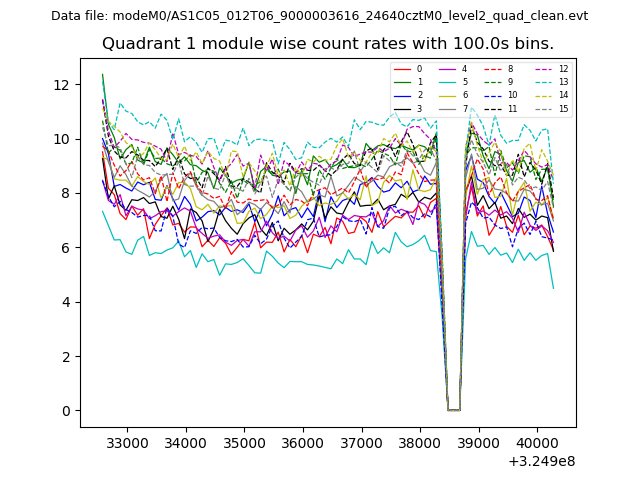 |
 |
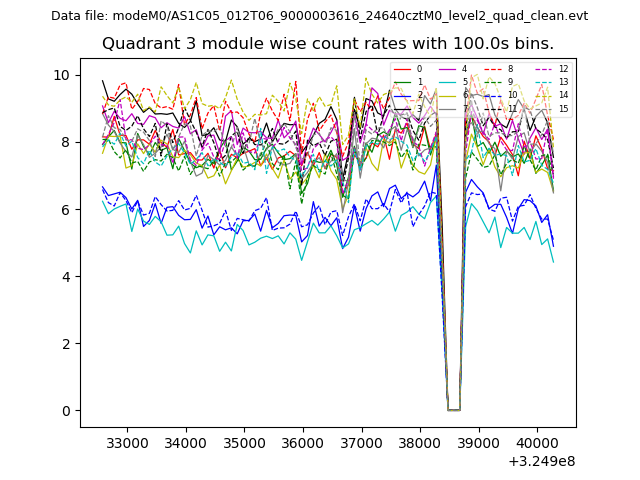
| Module-wise count rates for Quadrant C Data is divided into 100 sec bins |
 |
 |
| Module-wise count rates for Quadrant D Data is divided into 100 sec bins |
 |
 |
| Parameter | Plot |
|---|---|
| CZT HV Monitor | 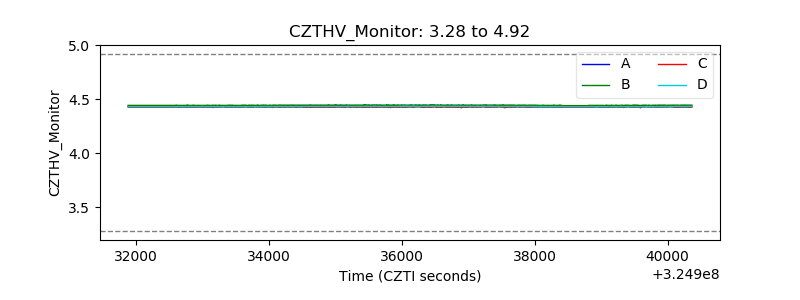 |
| D_VDD | 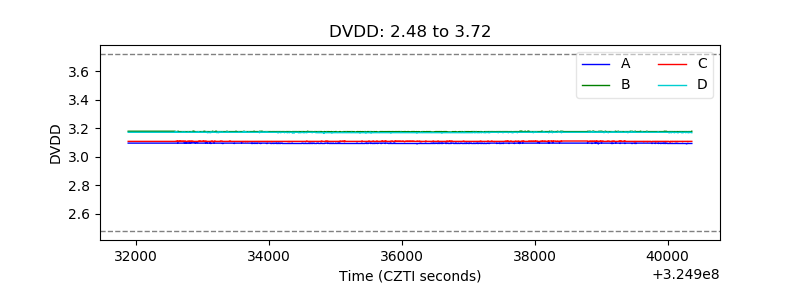 |
| Temperature 1 |  |
| Veto HV Monitor | 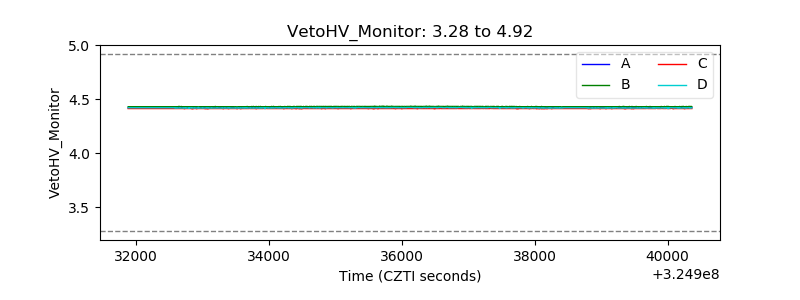 |
| Veto LLD | 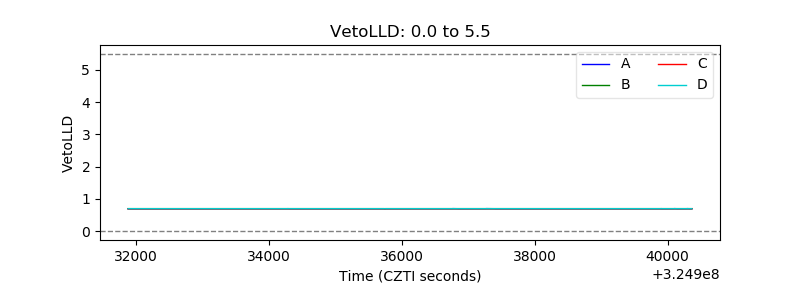 |
| Alpha Counter | 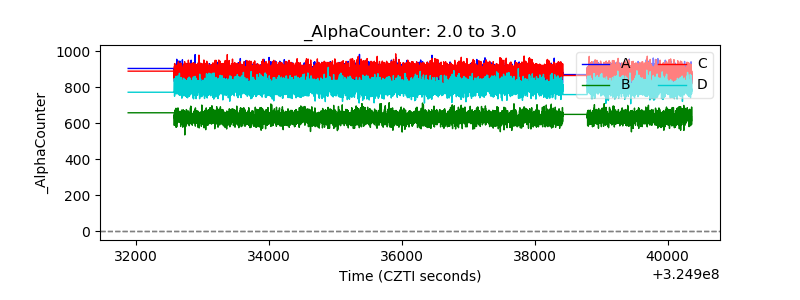 |
| _CPM_Rate | 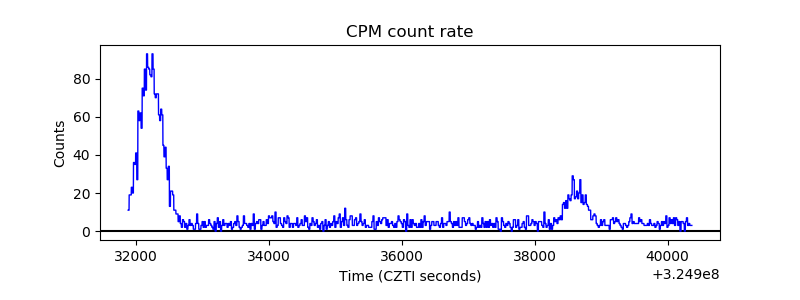 |
| CZT Counter | 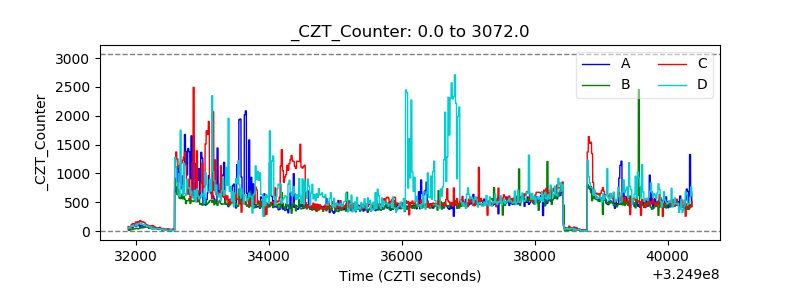 |
| +2.5 Volts monitor |  |
| +5 Volts monitor |  |
| _ROLL_ROT | 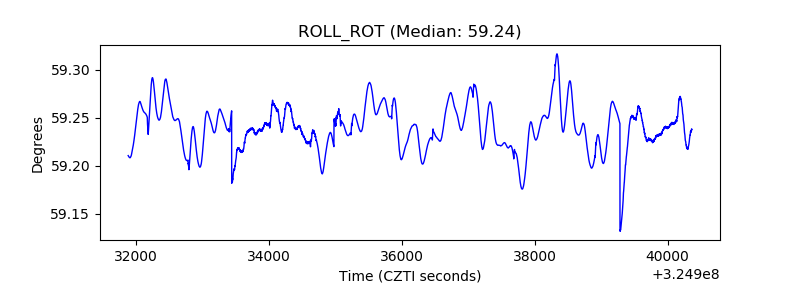 |
| _Roll_DEC | 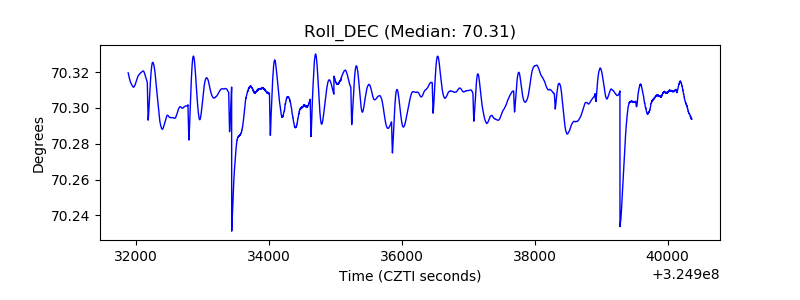 |
| _Roll_RA | 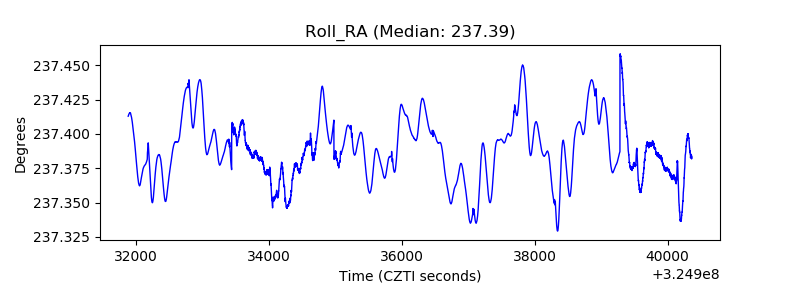 |
| Veto Counter | 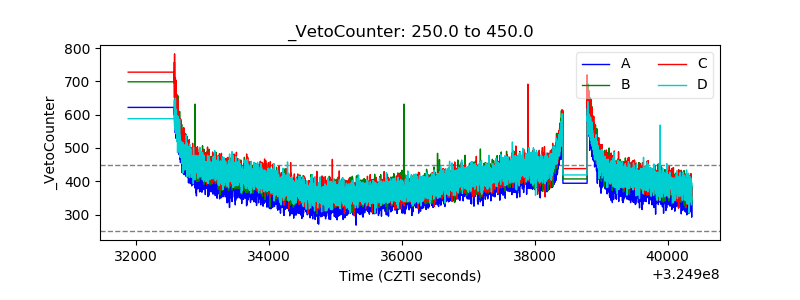 |