| Param | Original file | Final file |
|---|---|---|
| Filename | modeM0/AS1C05_012T06_9000003616_24641cztM0_level2.evt | modeM0/AS1C05_012T06_9000003616_24641cztM0_level2_quad_clean.evt |
| Size (bytes) | 557,637,120 | 143,579,520 |
| Size | 531.8 MB | 136.9 MB |
| Events in quadrant A | 3,652,442 | 970,408 |
| Events in quadrant B | 3,818,491 | 982,512 |
| Events in quadrant C | 4,423,864 | 944,917 |
| Events in quadrant D | 4,478,049 | 922,538 |
| Mode M0 | |||
|---|---|---|---|
| Quadrant | BADHDUFLAG | Total packets | Discarded packets |
| A | 0 | 16045 | 2 |
| B | 0 | 16531 | 2 |
| C | 0 | 18301 | 2 |
| D | 0 | 18502 | 2 |
| Mode SS | |||
|---|---|---|---|
| Quadrant | BADHDUFLAG | Total packets | Discarded packets |
| A | 0 | 156 | 0 |
| B | 0 | 156 | 0 |
| C | 0 | 156 | 0 |
| D | 0 | 156 | 0 |
| Mode M9 | |||
|---|---|---|---|
| Quadrant | BADHDUFLAG | Total packets | Discarded packets |
| A | 0 | 5 | 0 |
| B | 0 | 6 | 0 |
| C | 0 | 6 | 0 |
| D | 0 | 6 | 0 |
| Quadrant | Total seconds | Saturated seconds | Saturation percentage |
|---|---|---|---|
| A | 7595 | 32 | 0.421330% |
| B | 7595 | 106 | 1.395655% |
| C | 7595 | 169 | 2.225148% |
| D | 7595 | 154 | 2.027650% |
Noise dominated data is calculated using 1-second bins in cleaned event files. If a bin has >2000 counts, and if more than 50% of those come from <1% of pixels, then it is considered to be noise-dominated and hence unusable.
| Quadrant | # 1 sec bins | Bins with >0 counts | Bins with >2000 counts | High rate bins dominated by noise | Noise dominated (total time) | Noise dominated (detector-on time) | Marked lightcurve |
|---|---|---|---|---|---|---|---|
| A | 7845 | 7596 | 1 | 1 | 0.01% | 0.01% | 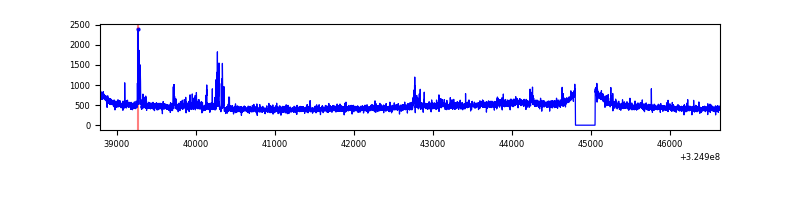 |
| B | 7845 | 7596 | 30 | 30 | 0.38% | 0.39% | 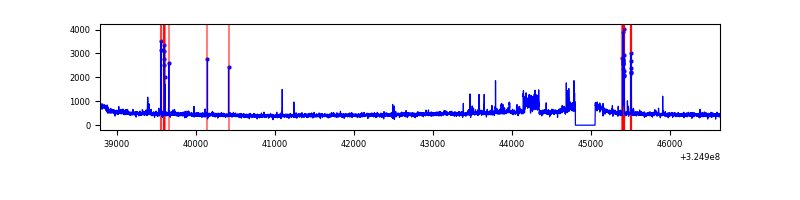 |
| C | 7845 | 7596 | 1 | 1 | 0.01% | 0.01% | 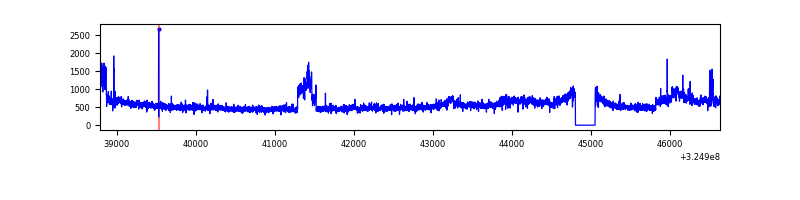 |
| D | 7845 | 7595 | 116 | 116 | 1.48% | 1.53% | 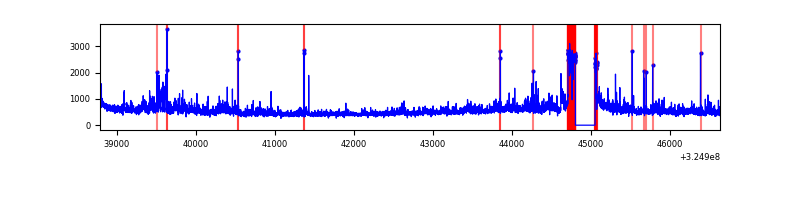 |
Top three noisy pixels from each quadrant. If the there are fewer than three noisy pixels in the level2.evt file, extra rows are filled as -1
| Pixel properties | Quadrant properties | ||||||
|---|---|---|---|---|---|---|---|
| Quadrant | DetID | PixID | Counts | Sigma | Mean | Median | Sigma |
| A | 6 | 16 | 128817 | 698.57 | 908 | 887 | 183.1 |
| A | 15 | 223 | 20155 | 105.21 | 908 | 887 | 183.1 |
| A | 13 | 254 | 12996 | 66.12 | 908 | 887 | 183.1 |
| B | 5 | 172 | 124953 | 711.48 | 906 | 881 | 174.4 |
| B | 0 | 190 | 118946 | 677.03 | 906 | 881 | 174.4 |
| B | 0 | 245 | 22381 | 123.29 | 906 | 881 | 174.4 |
| C | 7 | 247 | 752913 | 3672.19 | 879 | 885 | 204.8 |
| C | 14 | 238 | 139535 | 677.04 | 879 | 885 | 204.8 |
| C | 10 | 91 | 39339 | 187.77 | 879 | 885 | 204.8 |
| D | 8 | 195 | 676984 | 3185.37 | 875 | 850 | 212.3 |
| D | 7 | 238 | 239441 | 1124.04 | 875 | 850 | 212.3 |
| D | 1 | 52 | 150779 | 706.34 | 875 | 850 | 212.3 |
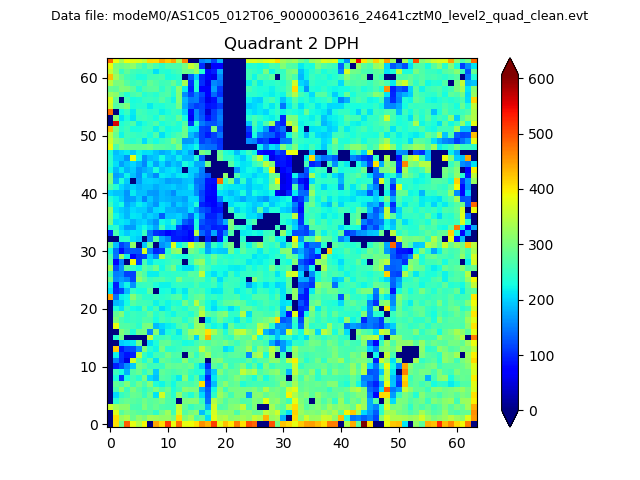
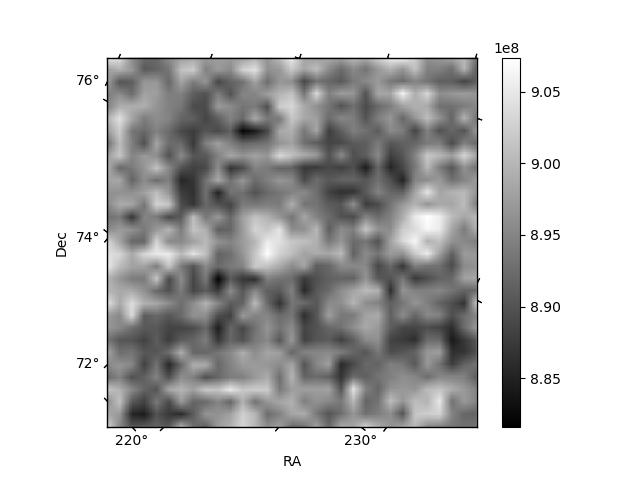
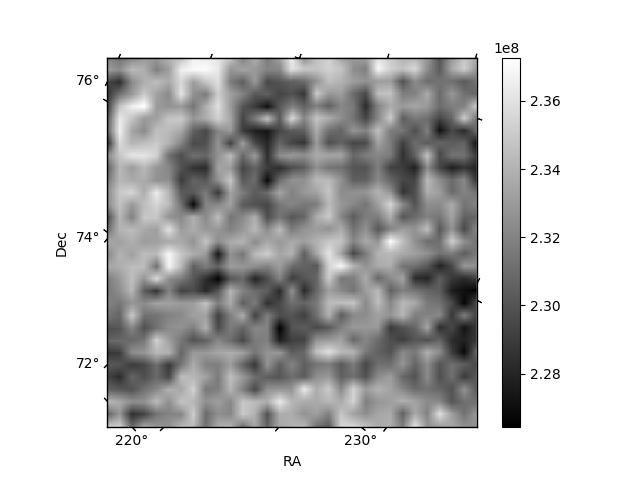
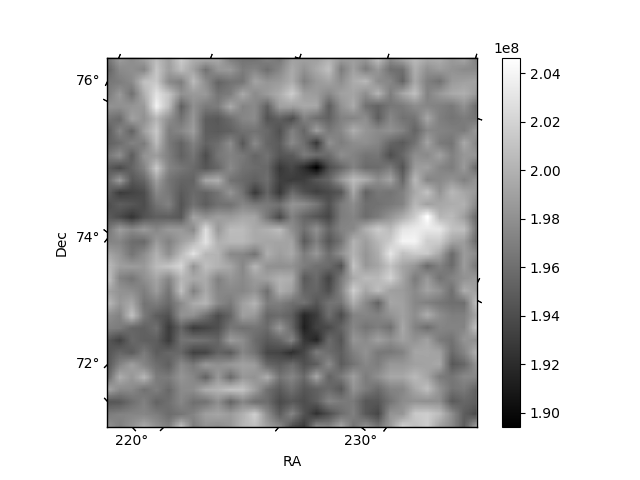
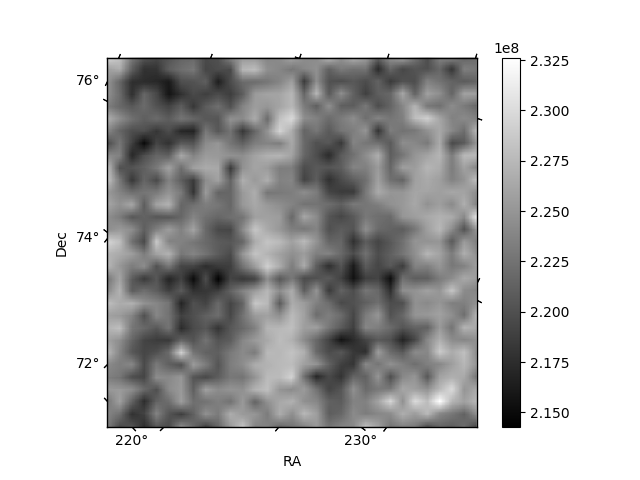
Histogram calculated using DETX and DETY for each event in the final _common_clean file
| Quadrant A | 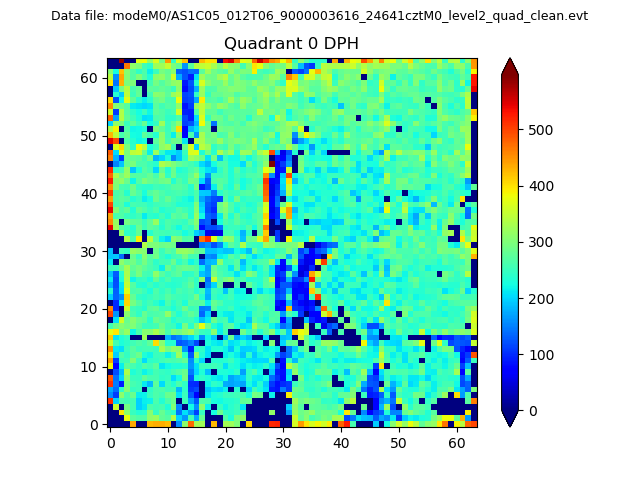 |
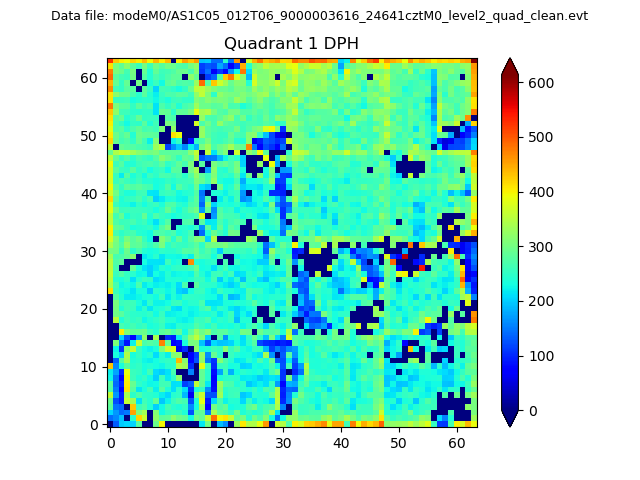 |
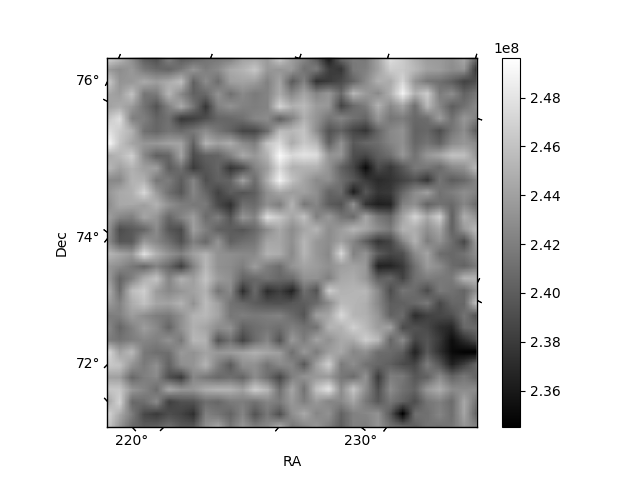
Quadrant B |
|---|---|---|---|
| Quadrant D | 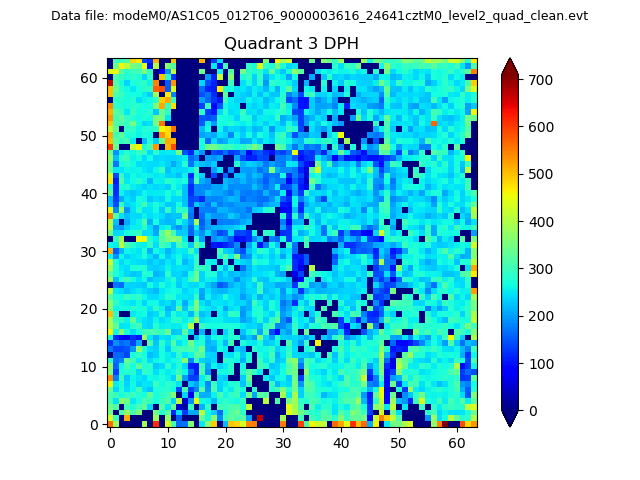 |
 |
Quadrant C |
| Plot type | Count rate plots | Images |
|---|---|---|
| Comparison with Poisson distribution Blue bars denote a histogram of data divided into 1 sec bins. Red curve is a Poisson curve with rate = median count rate of data. |
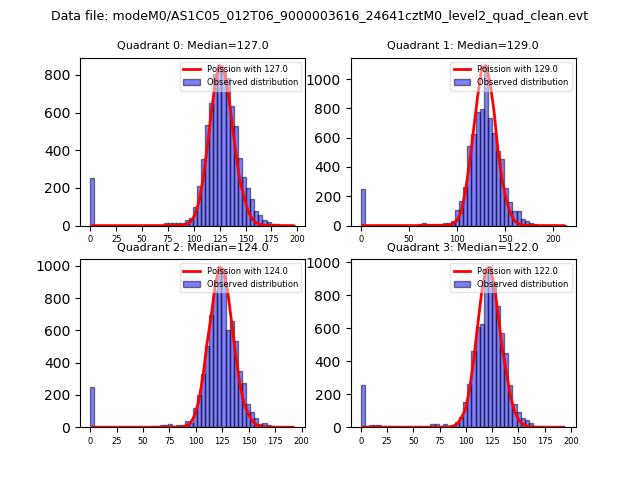 |
 |
| Quadrant-wise count rates Data is divided into 100 sec bins |
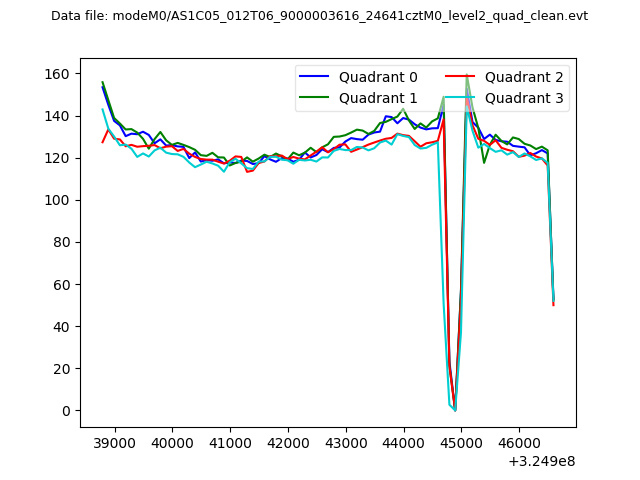 |
|
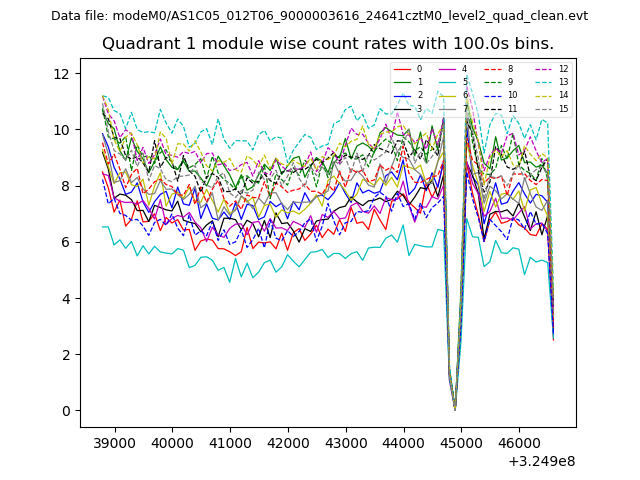
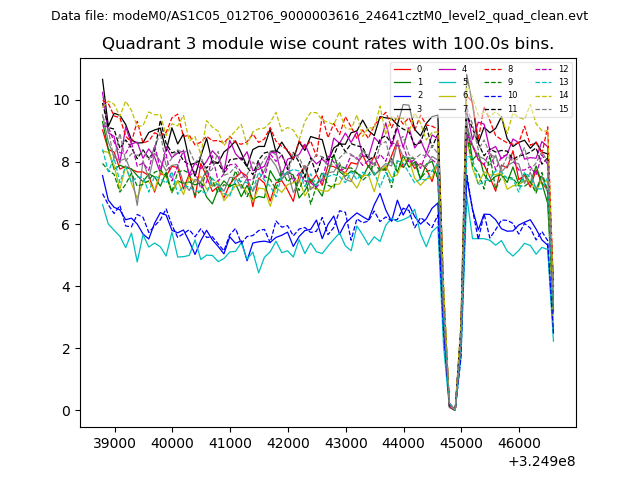
| Module-wise count rates for Quadrant A Data is divided into 100 sec bins |
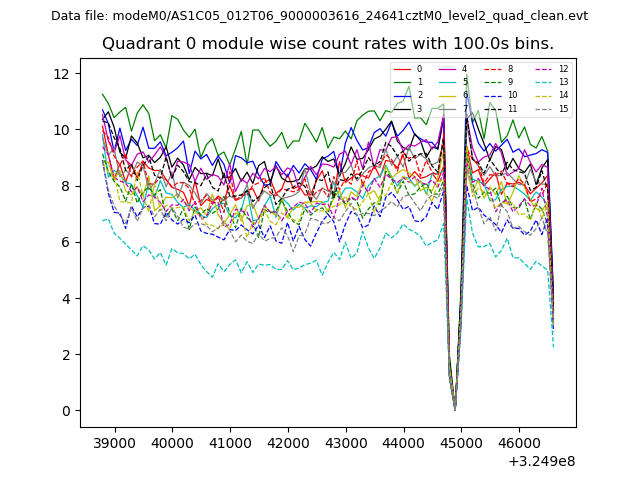 |
 |
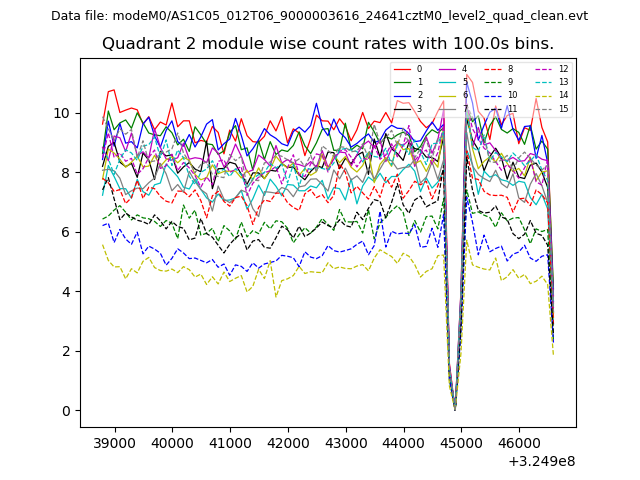
| Module-wise count rates for Quadrant B Data is divided into 100 sec bins |
 |
 |
| Module-wise count rates for Quadrant C Data is divided into 100 sec bins |
 |
 |
| Module-wise count rates for Quadrant D Data is divided into 100 sec bins |
 |
 |
| Parameter | Plot |
|---|---|
| CZT HV Monitor |  |
| D_VDD | 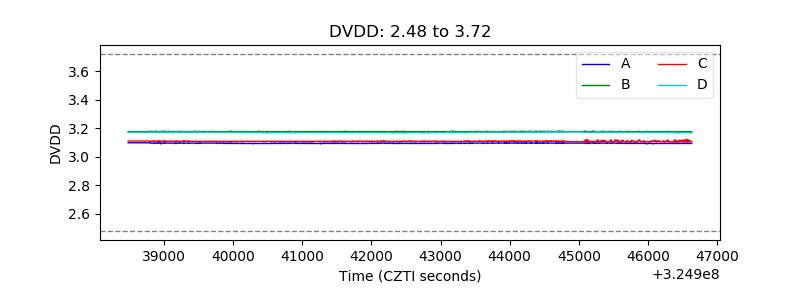 |
| Temperature 1 | 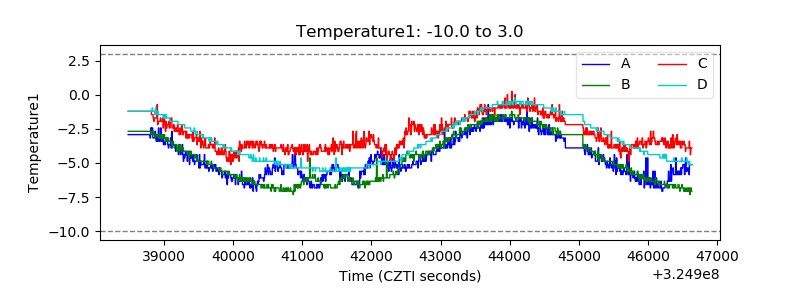 |
| Veto HV Monitor | 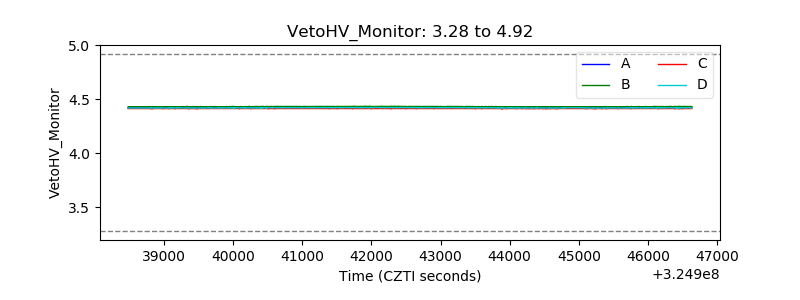 |
| Veto LLD |  |
| Alpha Counter | 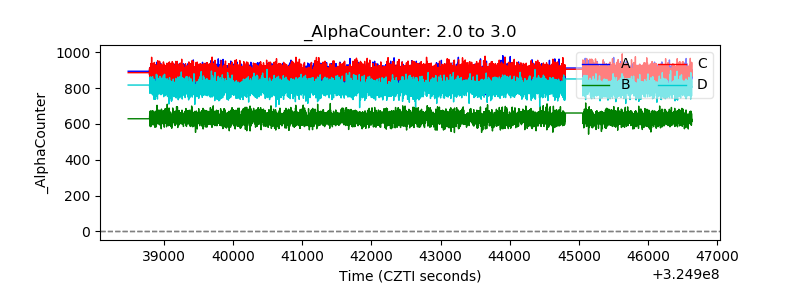 |
| _CPM_Rate | 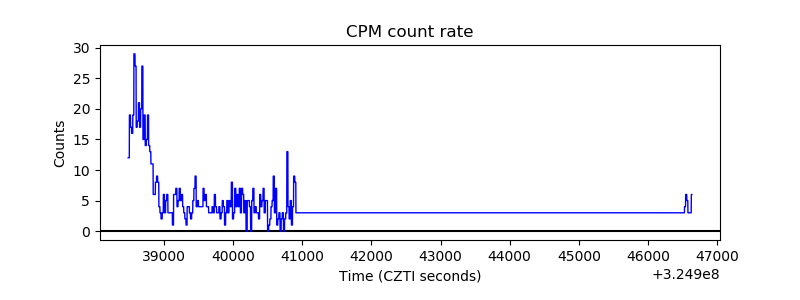 |
| CZT Counter | 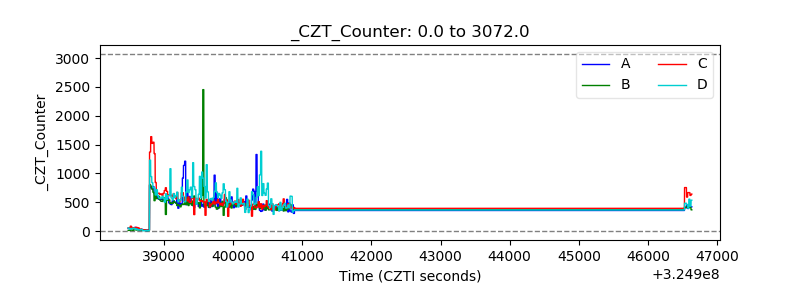 |
| +2.5 Volts monitor |  |
| +5 Volts monitor | 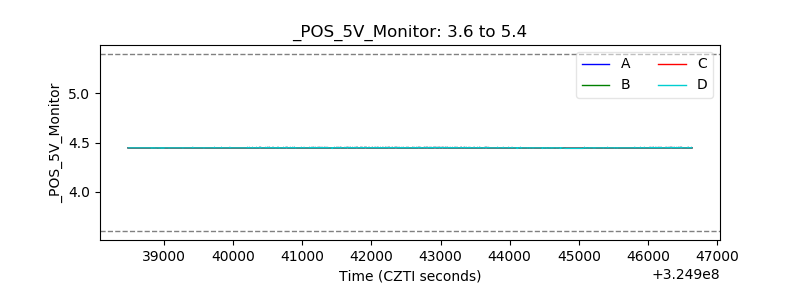 |
| _ROLL_ROT | 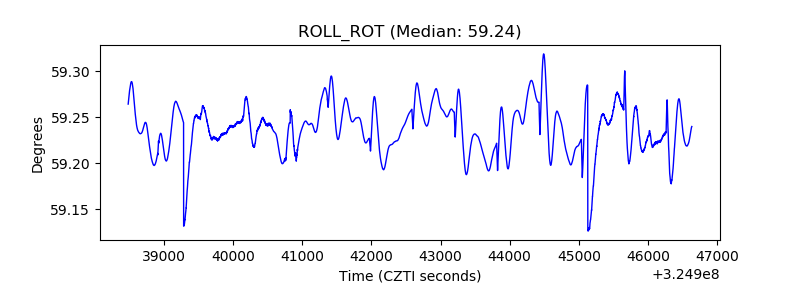 |
| _Roll_DEC | 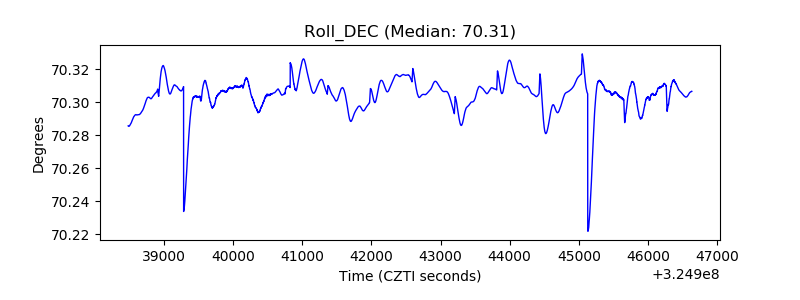 |
| _Roll_RA | 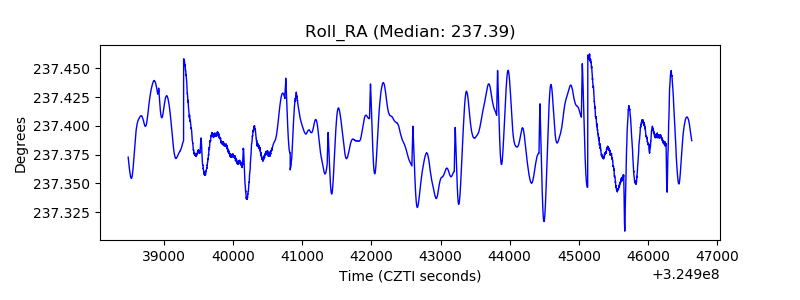 |
| Veto Counter | 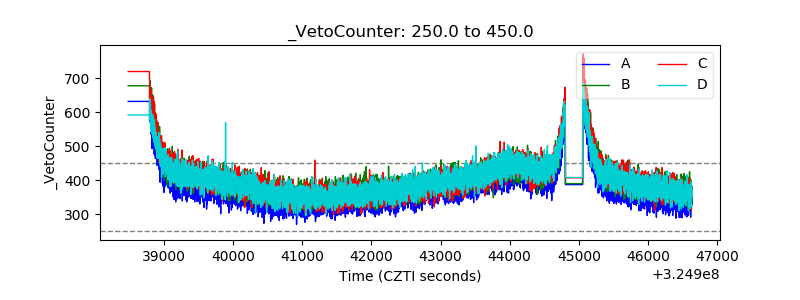 |