| Param | Original file | Final file |
|---|---|---|
| Filename | modeM0/AS1C05_012T06_9000003616_24642cztM0_level2.evt | modeM0/AS1C05_012T06_9000003616_24642cztM0_level2_quad_clean.evt |
| Size (bytes) | 638,749,440 | 152,444,160 |
| Size | 609.2 MB | 145.4 MB |
| Events in quadrant A | 3,789,405 | 1,029,629 |
| Events in quadrant B | 4,089,020 | 1,046,805 |
| Events in quadrant C | 5,697,923 | 997,722 |
| Events in quadrant D | 5,216,199 | 976,692 |
| Mode M0 | |||
|---|---|---|---|
| Quadrant | BADHDUFLAG | Total packets | Discarded packets |
| A | 0 | 16867 | 2 |
| B | 0 | 17754 | 2 |
| C | 0 | 22985 | 4 |
| D | 0 | 21008 | 2 |
| Mode SS | |||
|---|---|---|---|
| Quadrant | BADHDUFLAG | Total packets | Discarded packets |
| A | 0 | 168 | 0 |
| B | 0 | 168 | 0 |
| C | 0 | 168 | 0 |
| D | 0 | 168 | 0 |
| Mode M9 | |||
|---|---|---|---|
| Quadrant | BADHDUFLAG | Total packets | Discarded packets |
| A | 0 | 6 | 0 |
| B | 0 | 6 | 0 |
| C | 0 | 6 | 0 |
| D | 0 | 6 | 0 |
| Quadrant | Total seconds | Saturated seconds | Saturation percentage |
|---|---|---|---|
| A | 8148 | 33 | 0.405007% |
| B | 8149 | 126 | 1.546202% |
| C | 8148 | 191 | 2.344134% |
| D | 8148 | 263 | 3.227786% |
Noise dominated data is calculated using 1-second bins in cleaned event files. If a bin has >2000 counts, and if more than 50% of those come from <1% of pixels, then it is considered to be noise-dominated and hence unusable.
| Quadrant | # 1 sec bins | Bins with >0 counts | Bins with >2000 counts | High rate bins dominated by noise | Noise dominated (total time) | Noise dominated (detector-on time) | Marked lightcurve |
|---|---|---|---|---|---|---|---|
| A | 8803 | 8150 | 0 | 0 | 0.00% | 0.00% | 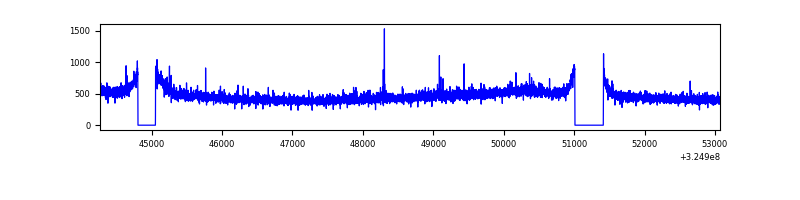 |
| B | 8804 | 8151 | 27 | 27 | 0.31% | 0.33% | 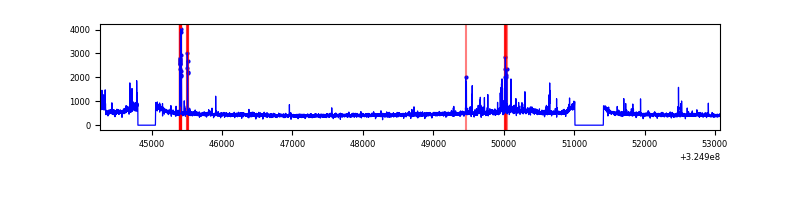 |
| C | 8803 | 8150 | 5 | 5 | 0.06% | 0.06% | 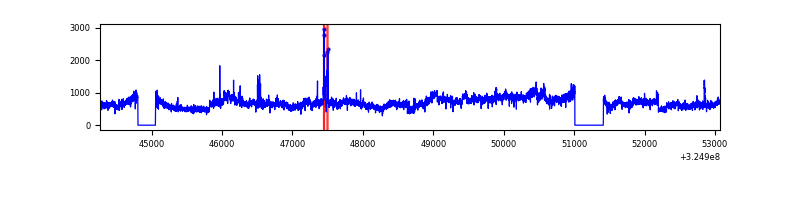 |
| D | 8803 | 8149 | 178 | 178 | 2.02% | 2.18% | 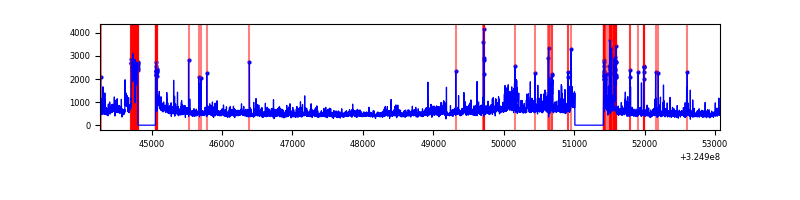 |
Top three noisy pixels from each quadrant. If the there are fewer than three noisy pixels in the level2.evt file, extra rows are filled as -1
| Pixel properties | Quadrant properties | ||||||
|---|---|---|---|---|---|---|---|
| Quadrant | DetID | PixID | Counts | Sigma | Mean | Median | Sigma |
| A | 13 | 254 | 13415 | 63.34 | 976 | 954 | 196.7 |
| A | 12 | 96 | 9117 | 41.49 | 976 | 954 | 196.7 |
| A | 3 | 137 | 9036 | 41.08 | 976 | 954 | 196.7 |
| B | 5 | 172 | 120157 | 639.87 | 975 | 951 | 186.3 |
| B | 0 | 190 | 64366 | 340.4 | 975 | 951 | 186.3 |
| B | 15 | 32 | 35999 | 188.13 | 975 | 951 | 186.3 |
| C | 7 | 247 | 1551148 | 7079.86 | 941 | 947 | 219.0 |
| C | 10 | 91 | 212377 | 965.61 | 941 | 947 | 219.0 |
| C | 14 | 238 | 149706 | 679.39 | 941 | 947 | 219.0 |
| D | 8 | 195 | 803433 | 3546.85 | 935 | 909 | 226.3 |
| D | 1 | 52 | 470926 | 2077.29 | 935 | 909 | 226.3 |
| D | 7 | 238 | 254837 | 1122.26 | 935 | 909 | 226.3 |
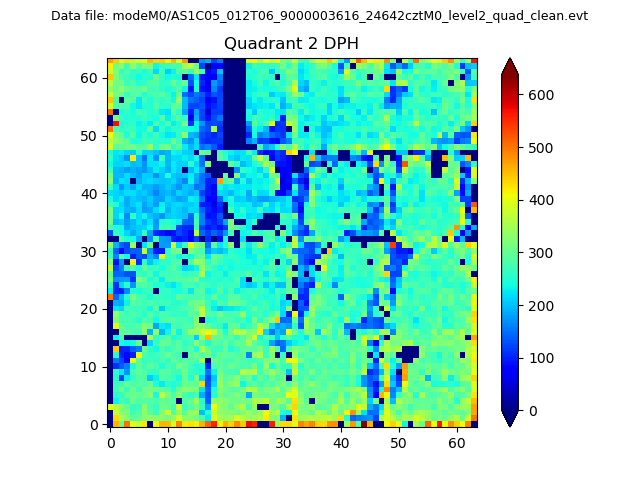
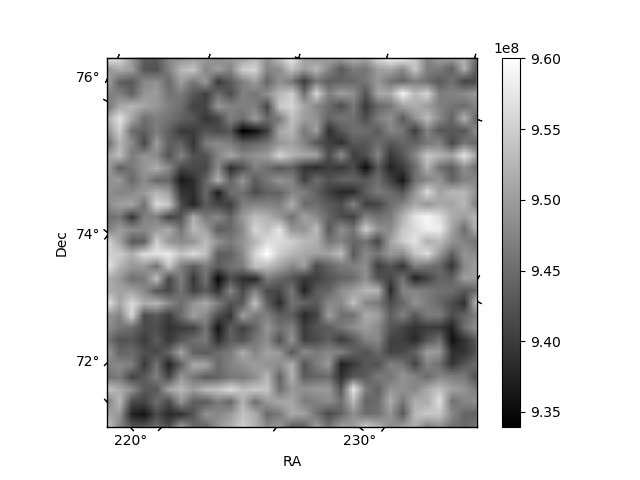
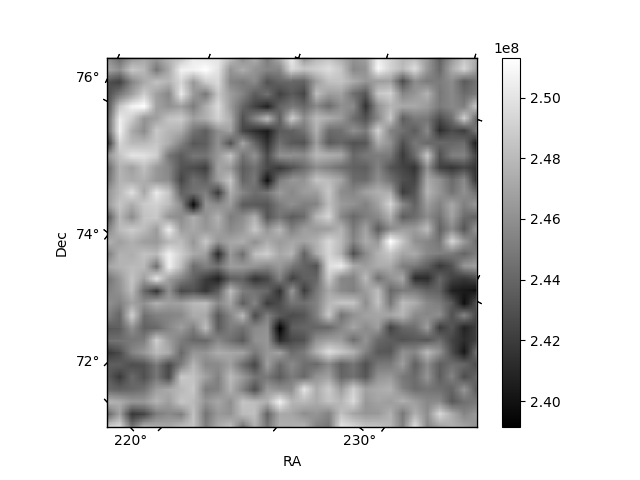
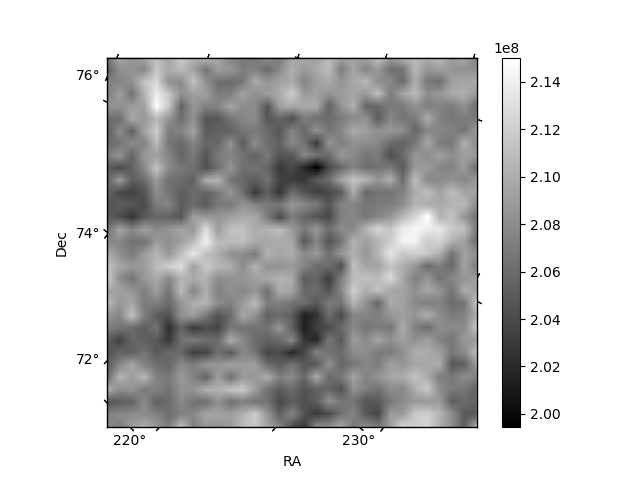
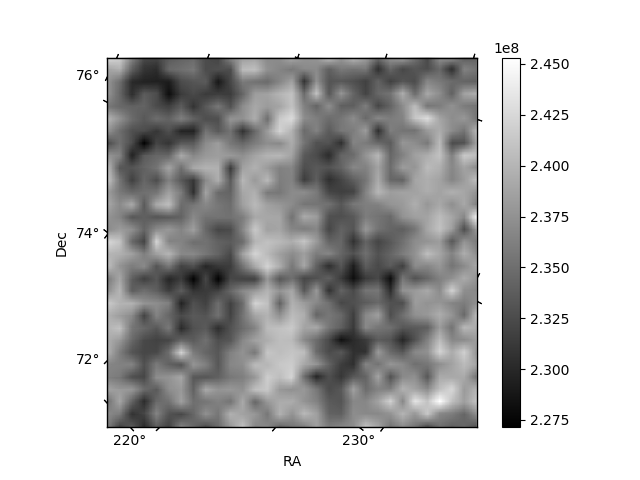
Histogram calculated using DETX and DETY for each event in the final _common_clean file
| Quadrant A | 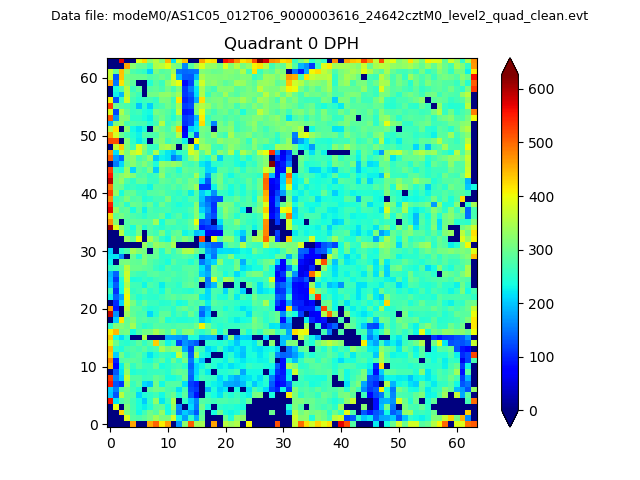 |
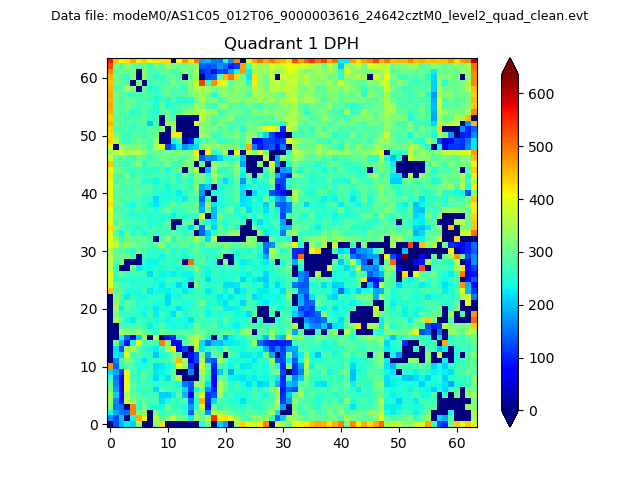 |
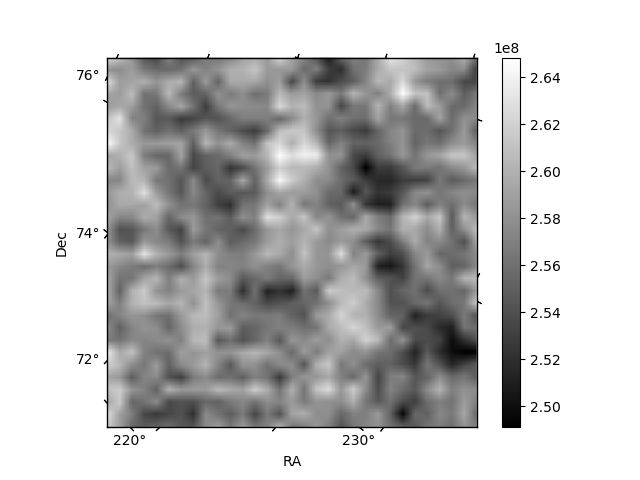
Quadrant B |
|---|---|---|---|
| Quadrant D | 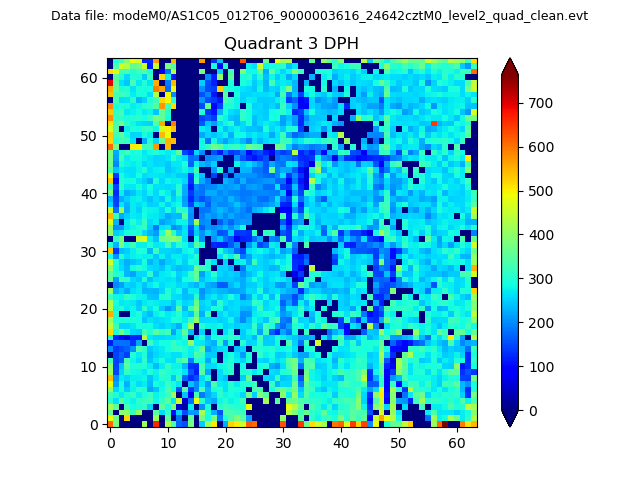 |
 |
Quadrant C |
| Plot type | Count rate plots | Images |
|---|---|---|
| Comparison with Poisson distribution Blue bars denote a histogram of data divided into 1 sec bins. Red curve is a Poisson curve with rate = median count rate of data. |
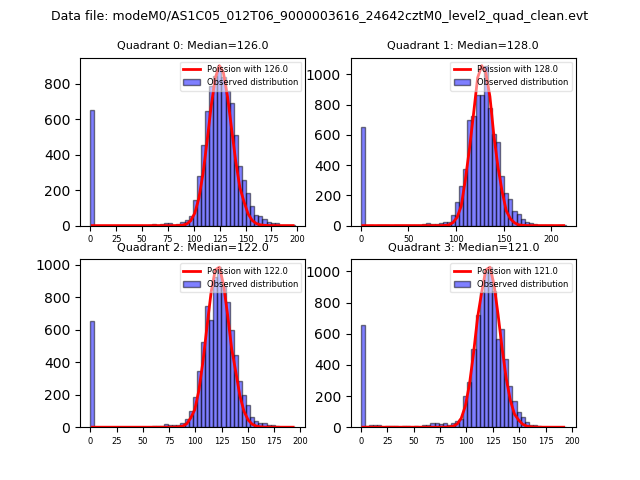 |
 |
| Quadrant-wise count rates Data is divided into 100 sec bins |
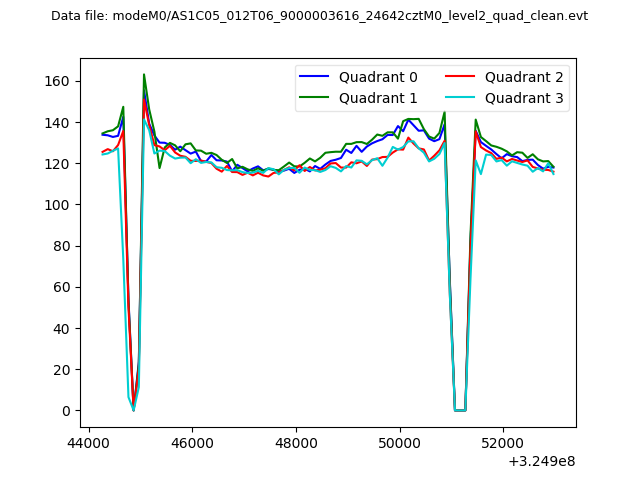 |
|
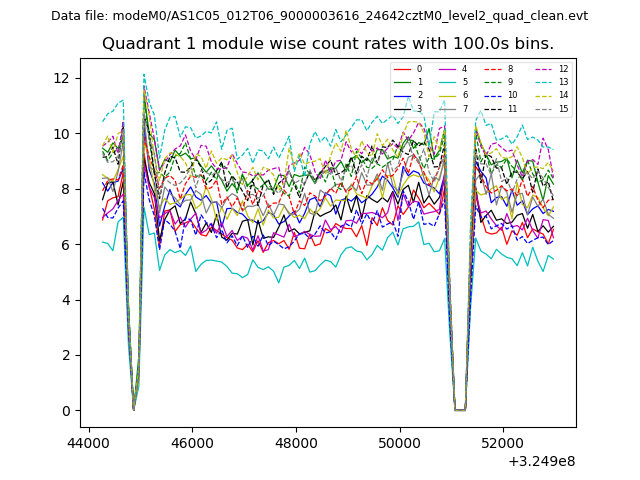
| Module-wise count rates for Quadrant A Data is divided into 100 sec bins |
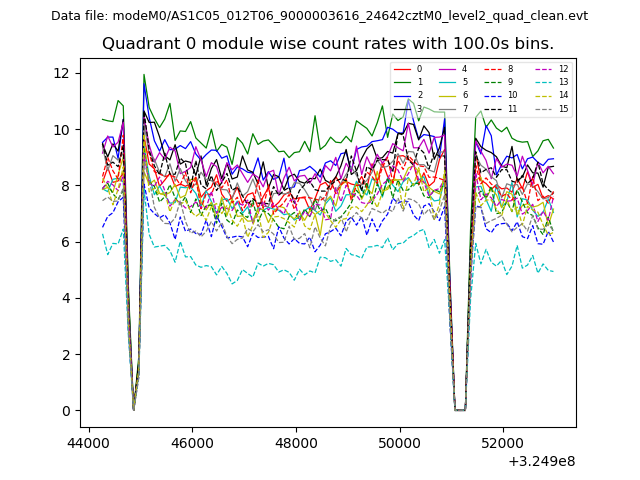 |
 |
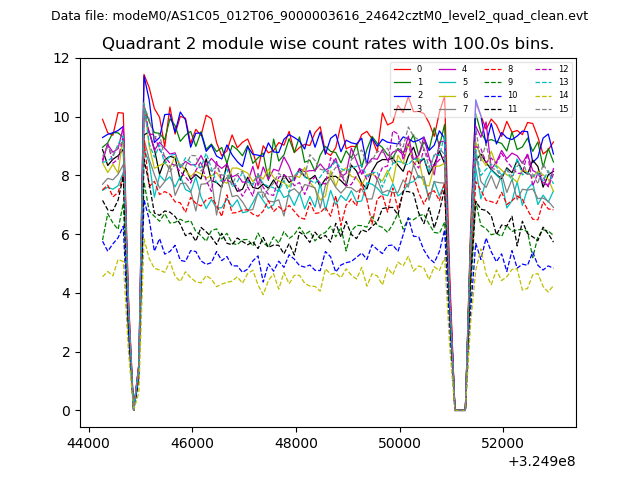
| Module-wise count rates for Quadrant B Data is divided into 100 sec bins |
 |
 |
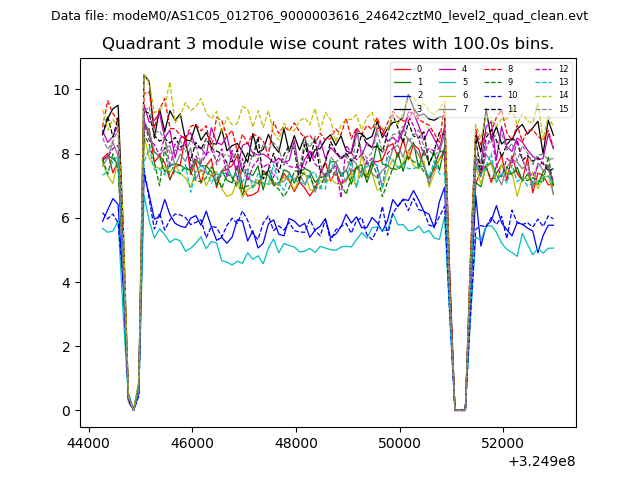
| Module-wise count rates for Quadrant C Data is divided into 100 sec bins |
 |
 |
| Module-wise count rates for Quadrant D Data is divided into 100 sec bins |
 |
 |
| Parameter | Plot |
|---|---|
| CZT HV Monitor | 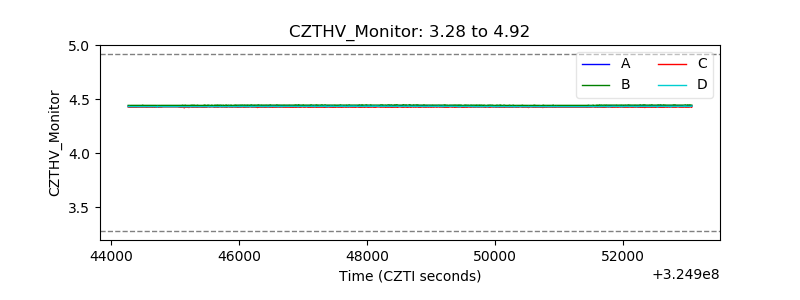 |
| D_VDD | 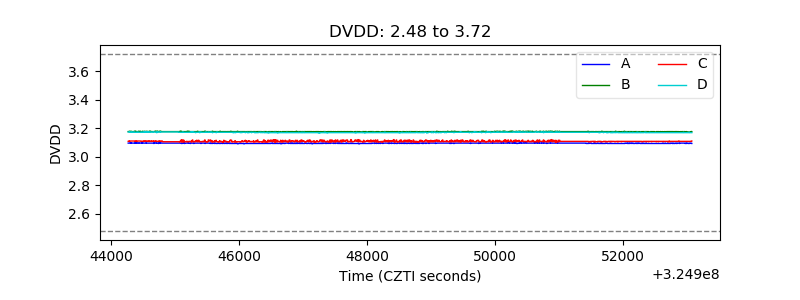 |
| Temperature 1 | 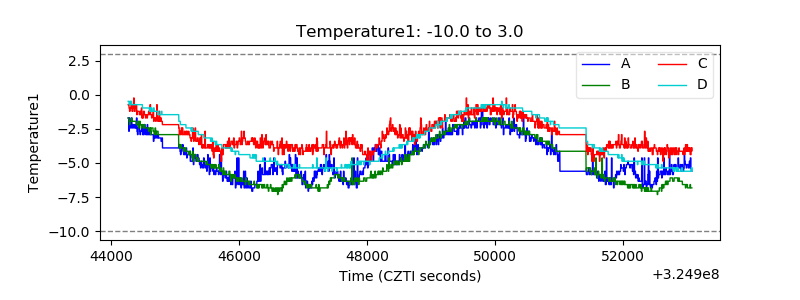 |
| Veto HV Monitor | 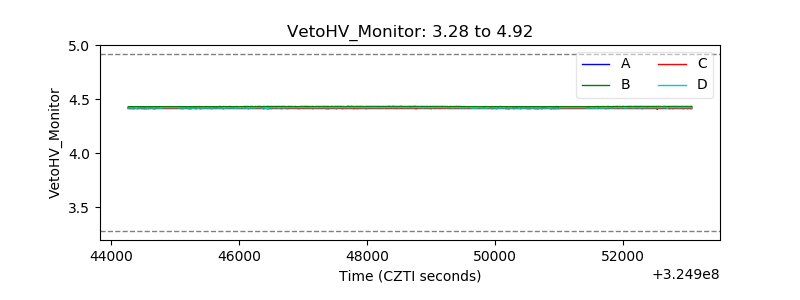 |
| Veto LLD | 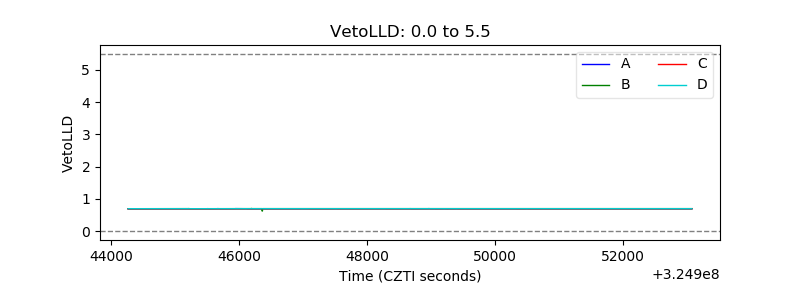 |
| Alpha Counter | 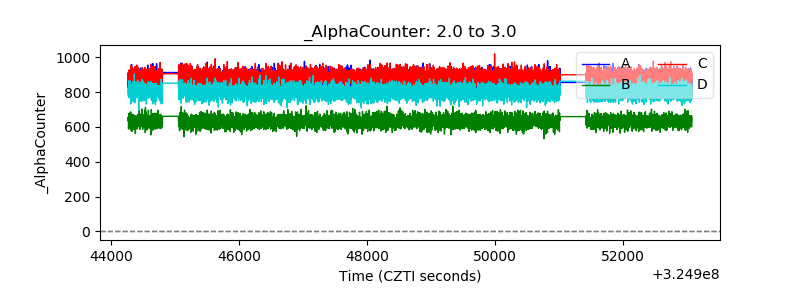 |
| _CPM_Rate | 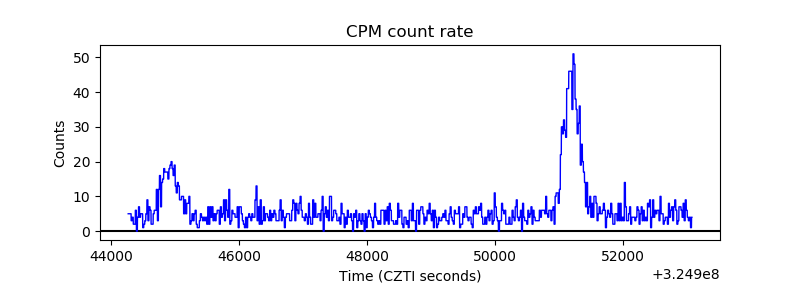 |
| CZT Counter | 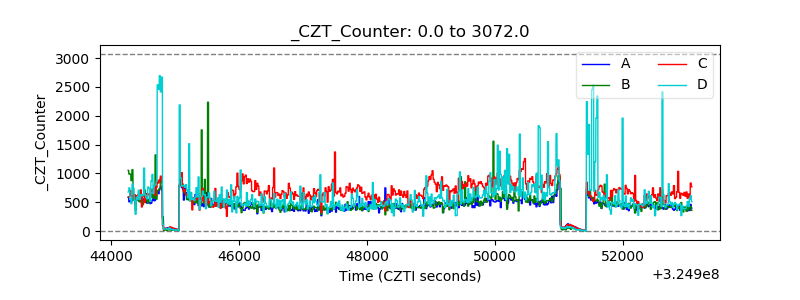 |
| +2.5 Volts monitor |  |
| +5 Volts monitor | 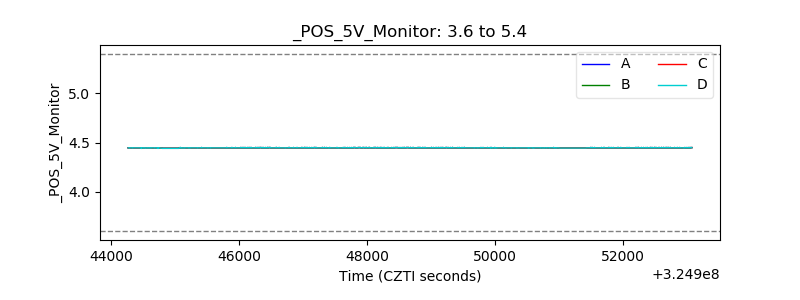 |
| _ROLL_ROT | 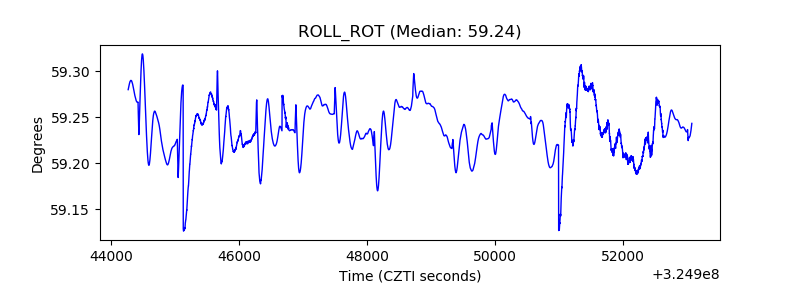 |
| _Roll_DEC | 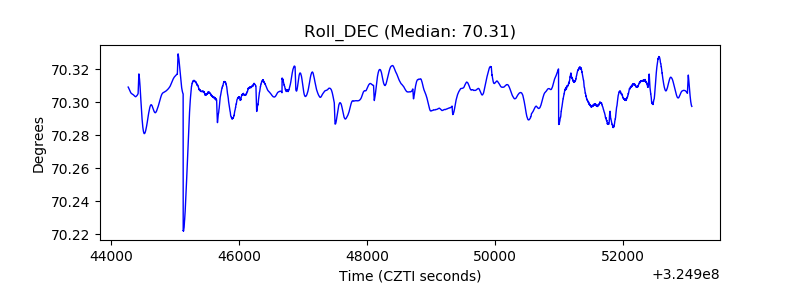 |
| _Roll_RA | 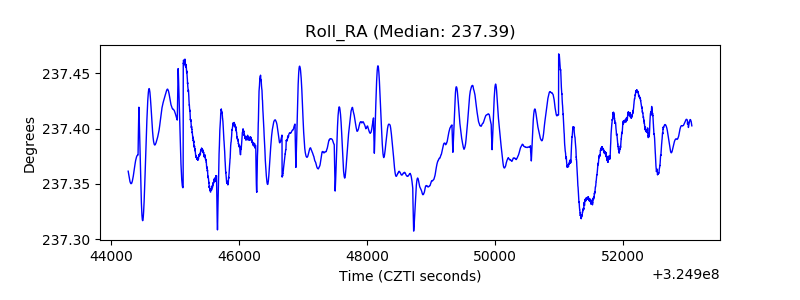 |
| Veto Counter | 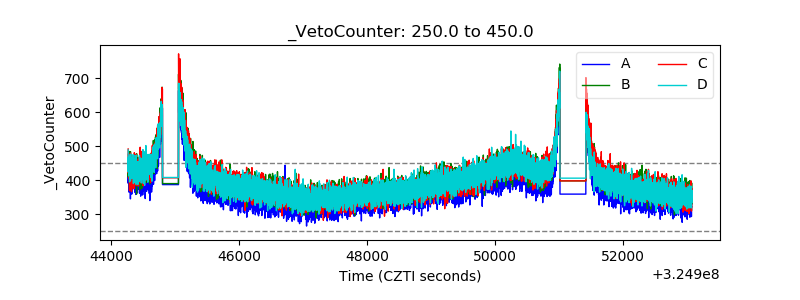 |