| Param | Original file | Final file |
|---|---|---|
| Filename | modeM0/AS1C05_012T06_9000003616_24644cztM0_level2.evt | modeM0/AS1C05_012T06_9000003616_24644cztM0_level2_quad_clean.evt |
| Size (bytes) | 919,249,920 | 240,243,840 |
| Size | 876.7 MB | 229.1 MB |
| Events in quadrant A | 5,875,111 | 1,618,065 |
| Events in quadrant B | 6,158,692 | 1,640,515 |
| Events in quadrant C | 8,046,078 | 1,572,281 |
| Events in quadrant D | 6,883,101 | 1,550,916 |
| Mode M0 | |||
|---|---|---|---|
| Quadrant | BADHDUFLAG | Total packets | Discarded packets |
| A | 0 | 26324 | 3 |
| B | 0 | 26984 | 3 |
| C | 0 | 32521 | 4 |
| D | 0 | 29340 | 3 |
| Mode SS | |||
|---|---|---|---|
| Quadrant | BADHDUFLAG | Total packets | Discarded packets |
| A | 0 | 266 | 0 |
| B | 0 | 266 | 0 |
| C | 0 | 266 | 0 |
| D | 0 | 266 | 0 |
| Mode M9 | |||
|---|---|---|---|
| Quadrant | BADHDUFLAG | Total packets | Discarded packets |
| A | 0 | 17 | 0 |
| B | 0 | 17 | 0 |
| C | 0 | 17 | 0 |
| D | 0 | 17 | 0 |
| Quadrant | Total seconds | Saturated seconds | Saturation percentage |
|---|---|---|---|
| A | 12957 | 46 | 0.355020% |
| B | 12958 | 99 | 0.764007% |
| C | 12957 | 187 | 1.443235% |
| D | 12957 | 188 | 1.450953% |
Noise dominated data is calculated using 1-second bins in cleaned event files. If a bin has >2000 counts, and if more than 50% of those come from <1% of pixels, then it is considered to be noise-dominated and hence unusable.
| Quadrant | # 1 sec bins | Bins with >0 counts | Bins with >2000 counts | High rate bins dominated by noise | Noise dominated (total time) | Noise dominated (detector-on time) | Marked lightcurve |
|---|---|---|---|---|---|---|---|
| A | 14702 | 12960 | 3 | 3 | 0.02% | 0.02% | 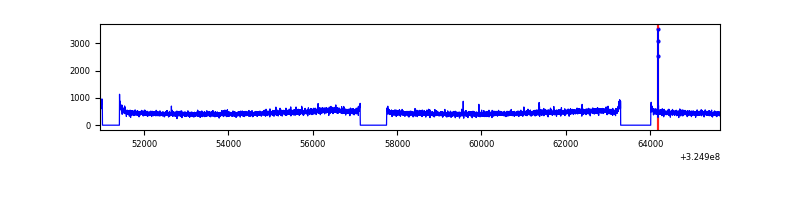 |
| B | 14703 | 12961 | 7 | 7 | 0.05% | 0.05% | 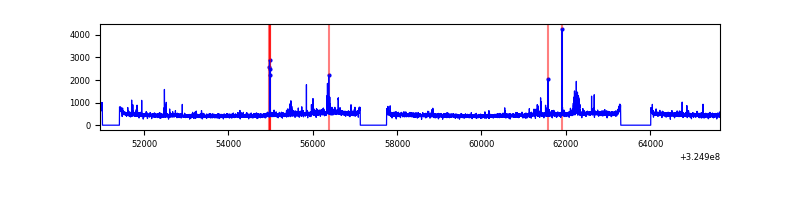 |
| C | 14702 | 12960 | 13 | 13 | 0.09% | 0.10% | 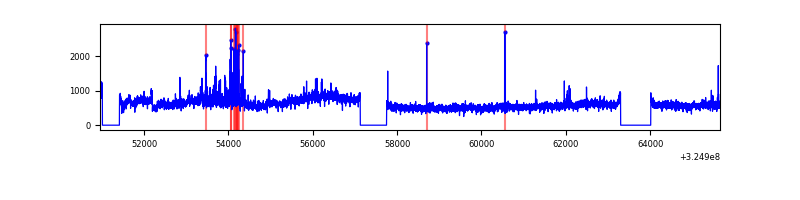 |
| D | 14702 | 12960 | 113 | 113 | 0.77% | 0.87% | 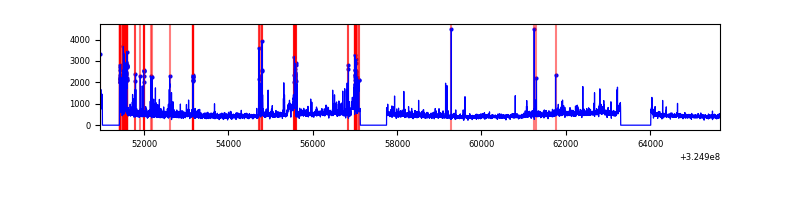 |
Top three noisy pixels from each quadrant. If the there are fewer than three noisy pixels in the level2.evt file, extra rows are filled as -1
| Pixel properties | Quadrant properties | ||||||
|---|---|---|---|---|---|---|---|
| Quadrant | DetID | PixID | Counts | Sigma | Mean | Median | Sigma |
| A | 13 | 254 | 20696 | 62.92 | 1519 | 1482 | 305.4 |
| A | 3 | 137 | 14054 | 41.17 | 1519 | 1482 | 305.4 |
| A | 0 | 226 | 12908 | 37.42 | 1519 | 1482 | 305.4 |
| B | 15 | 32 | 74352 | 251.62 | 1515 | 1472 | 289.6 |
| B | 5 | 172 | 59634 | 200.8 | 1515 | 1472 | 289.6 |
| B | 12 | 111 | 36236 | 120.02 | 1515 | 1472 | 289.6 |
| C | 7 | 247 | 1594585 | 4694.37 | 1460 | 1469 | 339.4 |
| C | 10 | 91 | 454408 | 1334.66 | 1460 | 1469 | 339.4 |
| C | 14 | 238 | 233940 | 685.01 | 1460 | 1469 | 339.4 |
| D | 8 | 195 | 456312 | 1276.95 | 1473 | 1432 | 356.2 |
| D | 1 | 52 | 441522 | 1235.43 | 1473 | 1432 | 356.2 |
| D | 7 | 238 | 214297 | 597.56 | 1473 | 1432 | 356.2 |
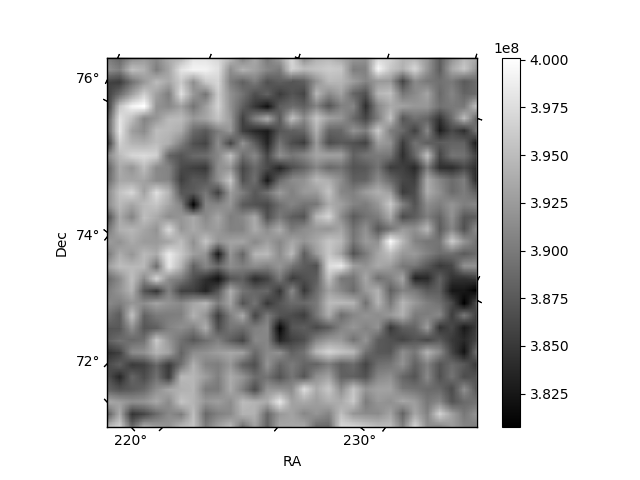
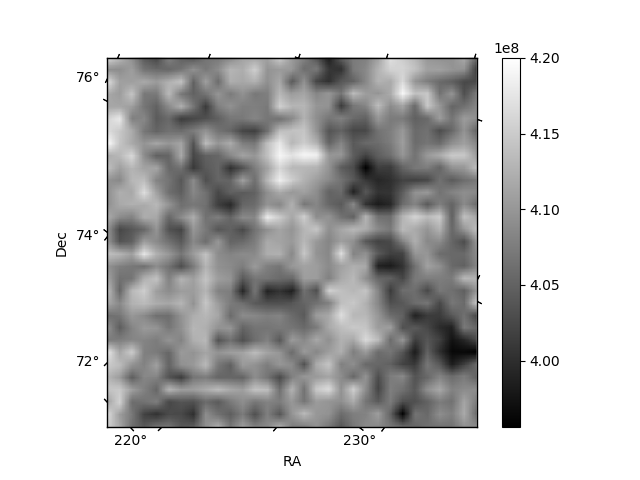
Histogram calculated using DETX and DETY for each event in the final _common_clean file
| Quadrant A | 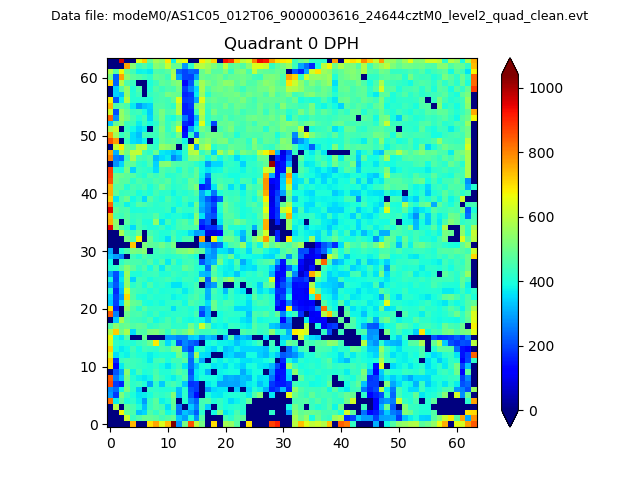 |
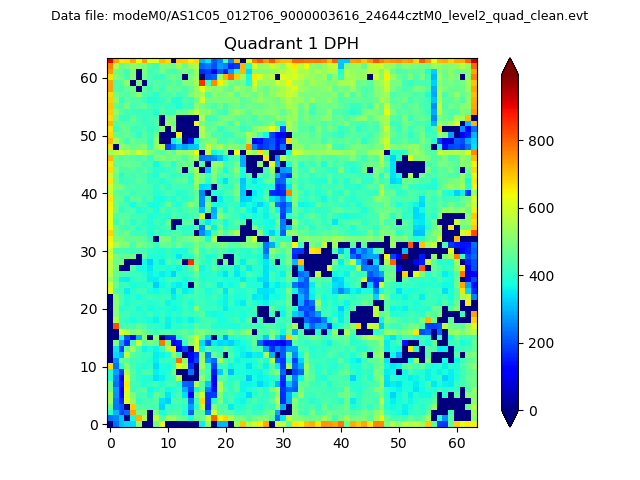 |
Quadrant B |
|---|---|---|---|
| Quadrant D | 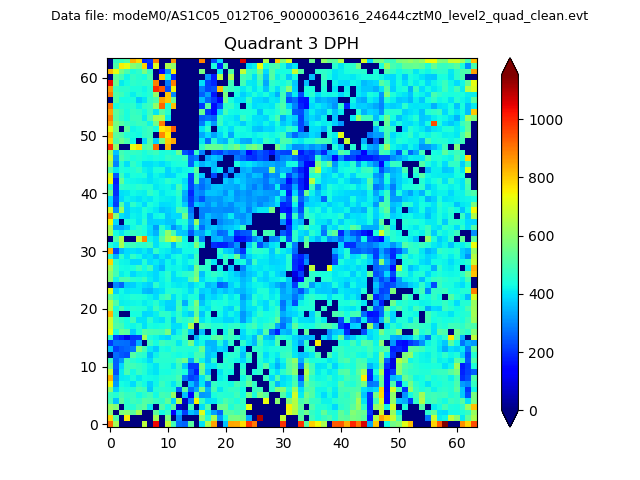 |
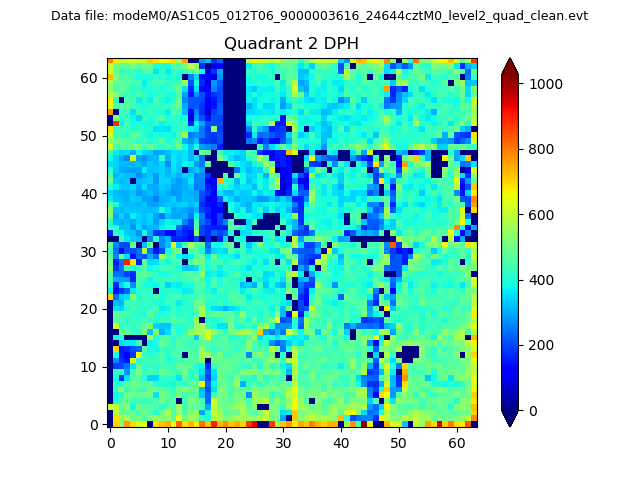 |
Quadrant C |
| Plot type | Count rate plots | Images |
|---|---|---|
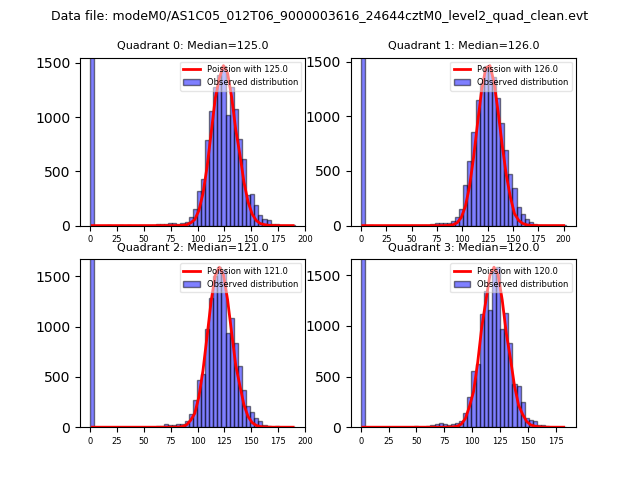
| Comparison with Poisson distribution Blue bars denote a histogram of data divided into 1 sec bins. Red curve is a Poisson curve with rate = median count rate of data. |
 |
 |
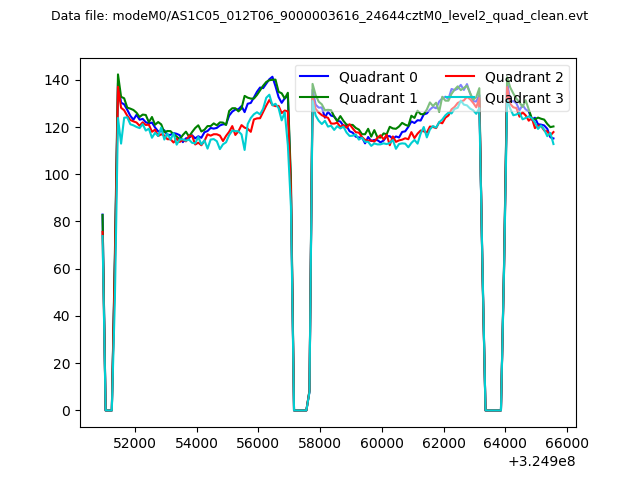
| Quadrant-wise count rates Data is divided into 100 sec bins |
 |
|
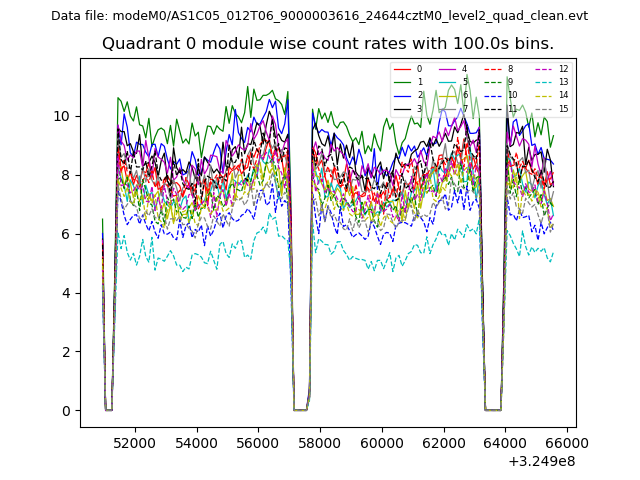
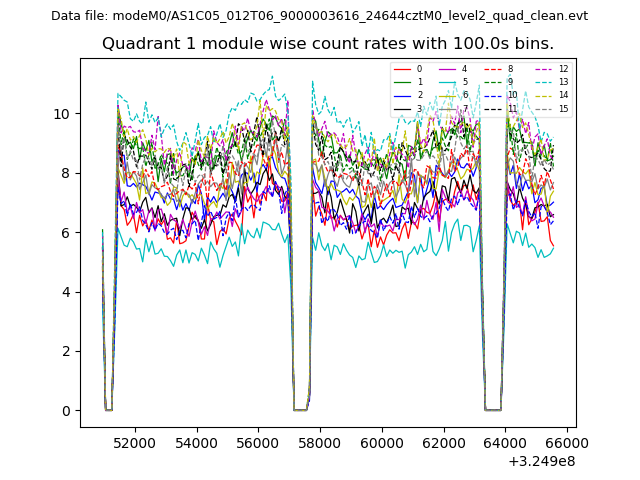
| Module-wise count rates for Quadrant A Data is divided into 100 sec bins |
 |
 |
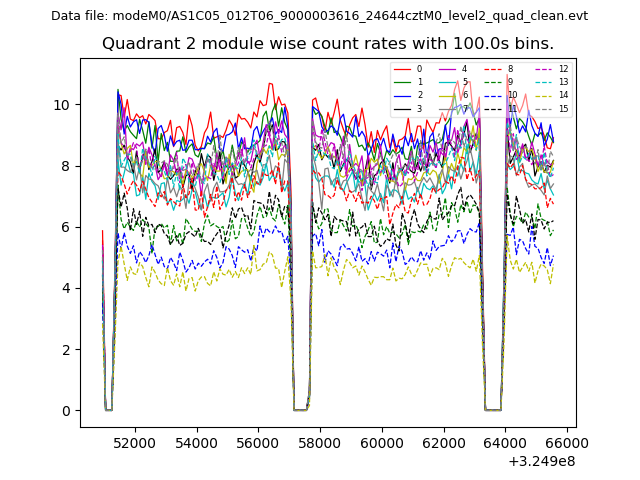
| Module-wise count rates for Quadrant B Data is divided into 100 sec bins |
 |
 |
| Module-wise count rates for Quadrant C Data is divided into 100 sec bins |
 |
 |
| Module-wise count rates for Quadrant D Data is divided into 100 sec bins |
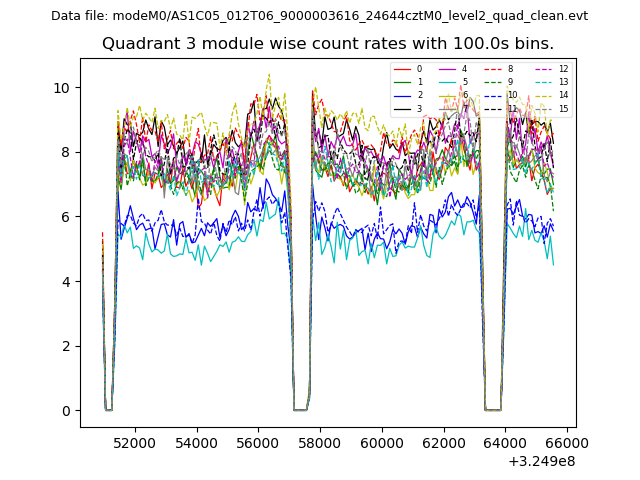 |
 |
| Parameter | Plot |
|---|---|
| CZT HV Monitor | 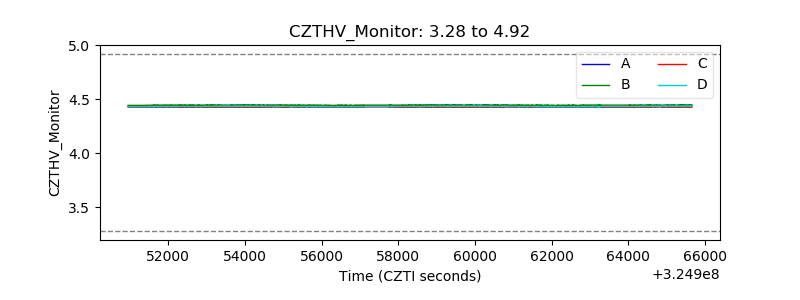 |
| D_VDD | 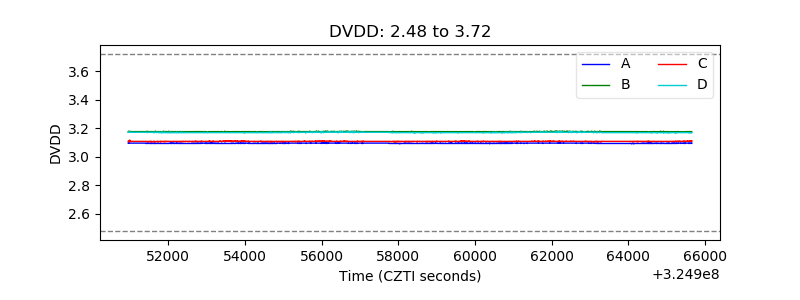 |
| Temperature 1 | 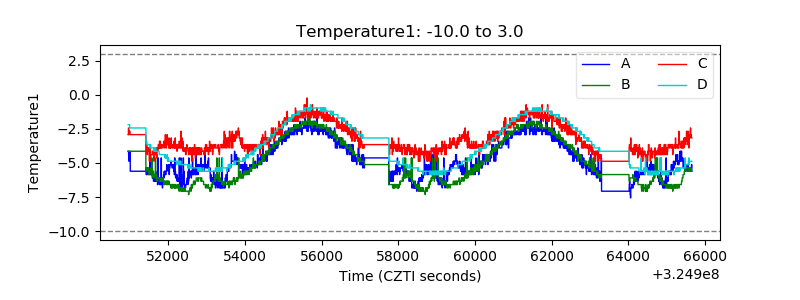 |
| Veto HV Monitor | 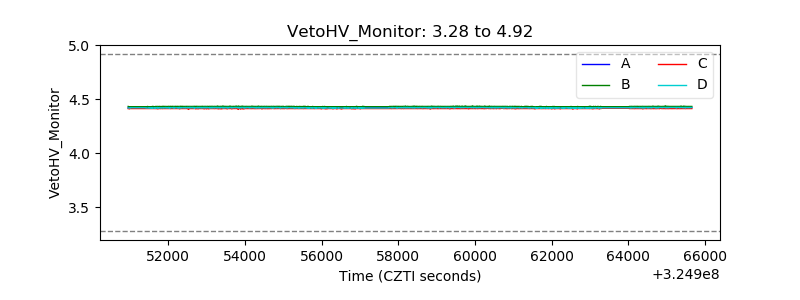 |
| Veto LLD | 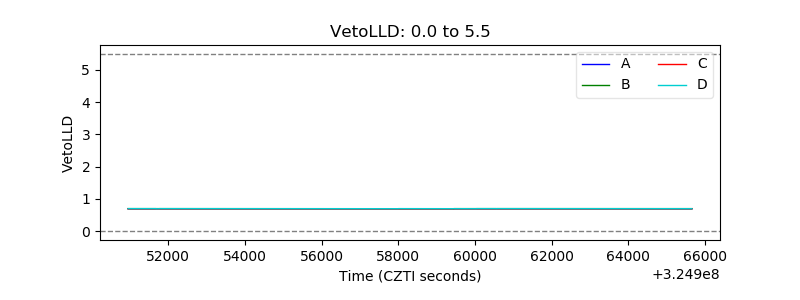 |
| Alpha Counter | 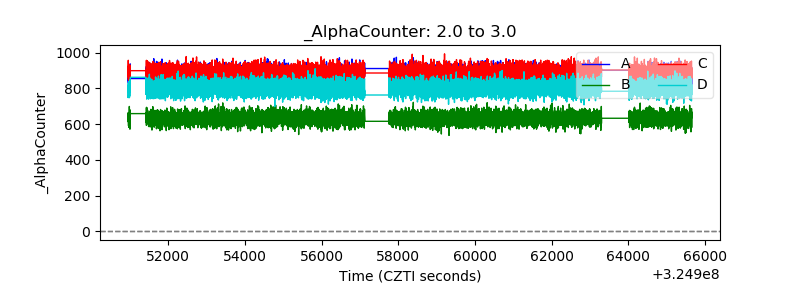 |
| _CPM_Rate | 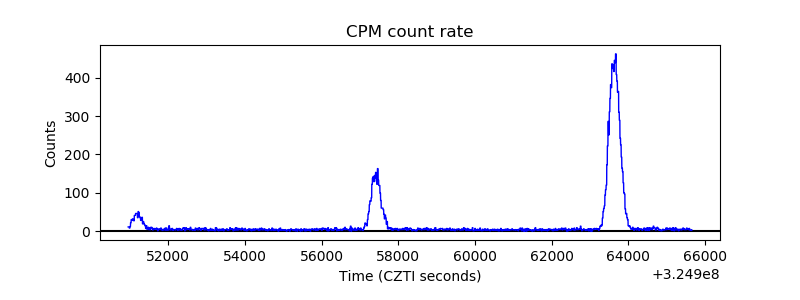 |
| CZT Counter | 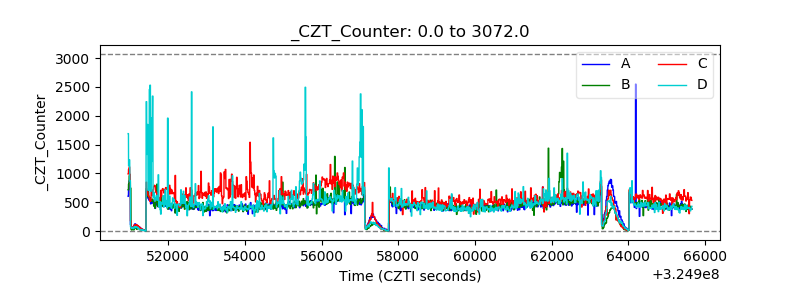 |
| +2.5 Volts monitor | 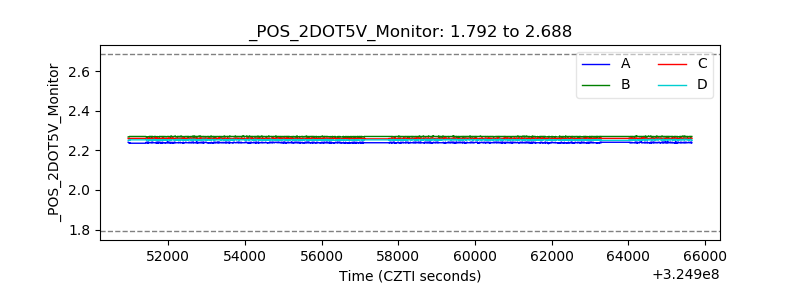 |
| +5 Volts monitor |  |
| _ROLL_ROT | 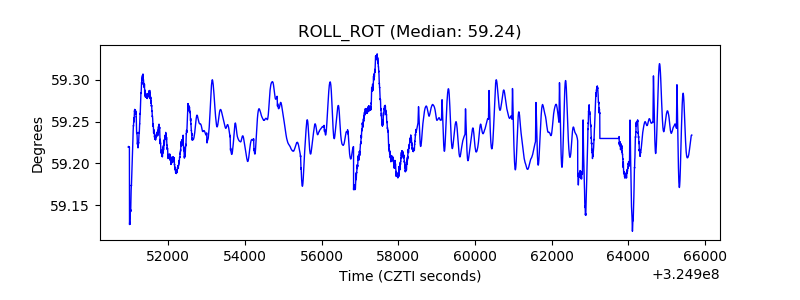 |
| _Roll_DEC | 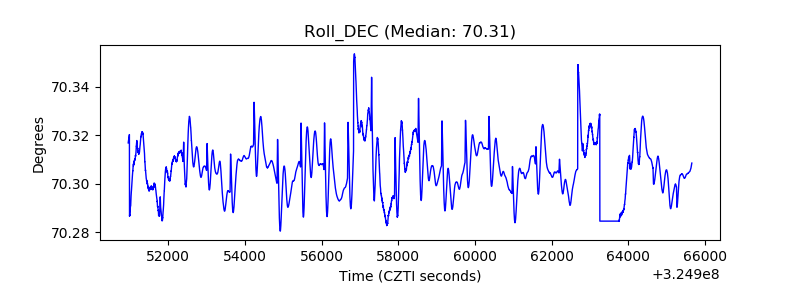 |
| _Roll_RA | 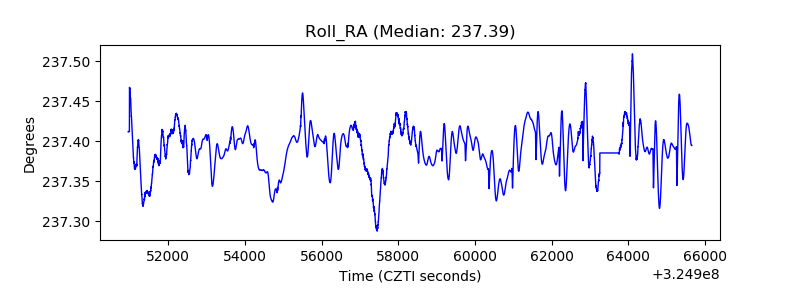 |
| Veto Counter | 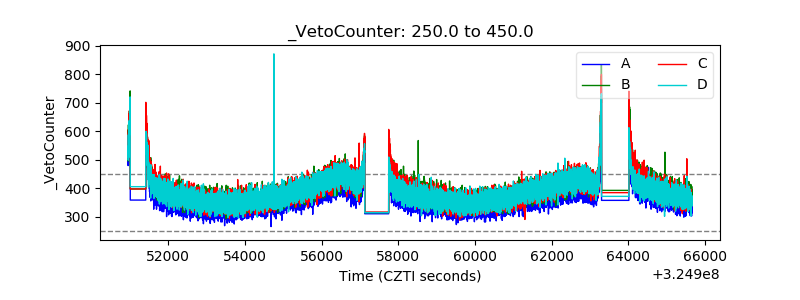 |