| Param | Original file | Final file |
|---|---|---|
| Filename | modeM0/AS1C05_012T06_9000003616_24645cztM0_level2.evt | modeM0/AS1C05_012T06_9000003616_24645cztM0_level2_quad_clean.evt |
| Size (bytes) | 464,025,600 | 125,953,920 |
| Size | 442.5 MB | 120.1 MB |
| Events in quadrant A | 3,057,630 | 853,212 |
| Events in quadrant B | 3,232,171 | 863,442 |
| Events in quadrant C | 4,053,505 | 816,163 |
| Events in quadrant D | 3,255,230 | 815,828 |
| Mode M0 | |||
|---|---|---|---|
| Quadrant | BADHDUFLAG | Total packets | Discarded packets |
| A | 0 | 13501 | 1 |
| B | 0 | 13913 | 1 |
| C | 0 | 16497 | 1 |
| D | 0 | 14331 | 1 |
| Mode SS | |||
|---|---|---|---|
| Quadrant | BADHDUFLAG | Total packets | Discarded packets |
| A | 0 | 136 | 0 |
| B | 0 | 136 | 0 |
| C | 0 | 136 | 0 |
| D | 0 | 136 | 0 |
| Mode M9 | |||
|---|---|---|---|
| Quadrant | BADHDUFLAG | Total packets | Discarded packets |
| A | 0 | 9 | 0 |
| B | 0 | 9 | 0 |
| C | 0 | 9 | 0 |
| D | 0 | 9 | 0 |
| Quadrant | Total seconds | Saturated seconds | Saturation percentage |
|---|---|---|---|
| A | 6688 | 19 | 0.284091% |
| B | 6688 | 47 | 0.702751% |
| C | 6688 | 118 | 1.764354% |
| D | 6688 | 16 | 0.239234% |
Noise dominated data is calculated using 1-second bins in cleaned event files. If a bin has >2000 counts, and if more than 50% of those come from <1% of pixels, then it is considered to be noise-dominated and hence unusable.
| Quadrant | # 1 sec bins | Bins with >0 counts | Bins with >2000 counts | High rate bins dominated by noise | Noise dominated (total time) | Noise dominated (detector-on time) | Marked lightcurve |
|---|---|---|---|---|---|---|---|
| A | 7608 | 6689 | 2 | 2 | 0.03% | 0.03% | 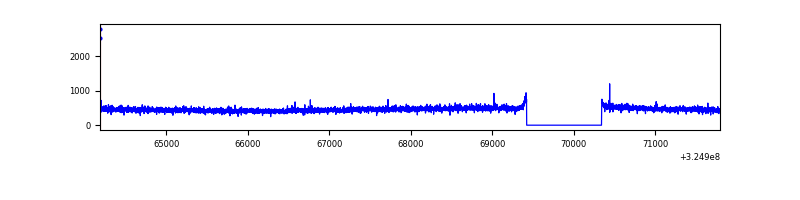 |
| B | 7608 | 6689 | 14 | 14 | 0.18% | 0.21% | 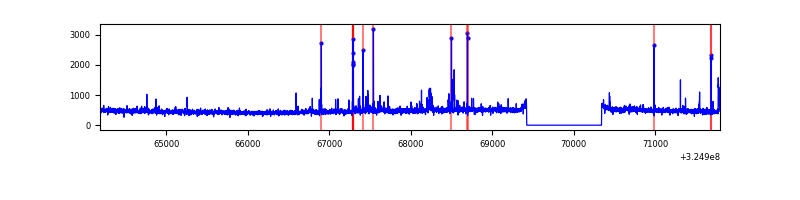 |
| C | 7608 | 6689 | 61 | 61 | 0.80% | 0.91% | 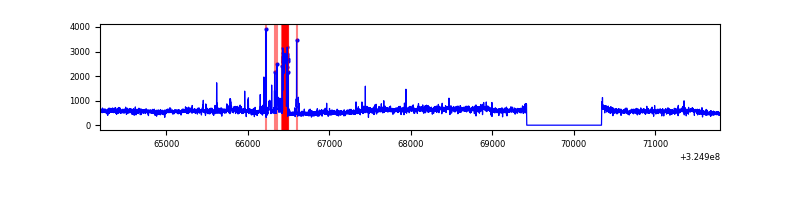 |
| D | 7608 | 6689 | 5 | 5 | 0.07% | 0.07% | 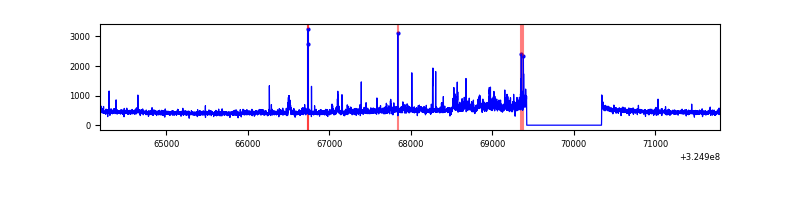 |
Top three noisy pixels from each quadrant. If the there are fewer than three noisy pixels in the level2.evt file, extra rows are filled as -1
| Pixel properties | Quadrant properties | ||||||
|---|---|---|---|---|---|---|---|
| Quadrant | DetID | PixID | Counts | Sigma | Mean | Median | Sigma |
| A | 13 | 254 | 11231 | 65.41 | 790 | 773 | 159.9 |
| A | 3 | 137 | 7209 | 40.26 | 790 | 773 | 159.9 |
| A | 0 | 226 | 6830 | 37.89 | 790 | 773 | 159.9 |
| B | 5 | 172 | 95103 | 632.6 | 785 | 765 | 149.1 |
| B | 12 | 111 | 18742 | 120.55 | 785 | 765 | 149.1 |
| B | 15 | 32 | 17817 | 114.34 | 785 | 765 | 149.1 |
| C | 7 | 247 | 698348 | 4004.25 | 749 | 755 | 174.2 |
| C | 2 | 16 | 236782 | 1354.82 | 749 | 755 | 174.2 |
| C | 14 | 238 | 120148 | 685.33 | 749 | 755 | 174.2 |
| D | 7 | 238 | 179412 | 960.26 | 766 | 744 | 186.1 |
| D | 8 | 195 | 90950 | 484.82 | 766 | 744 | 186.1 |
| D | 1 | 52 | 61110 | 324.44 | 766 | 744 | 186.1 |
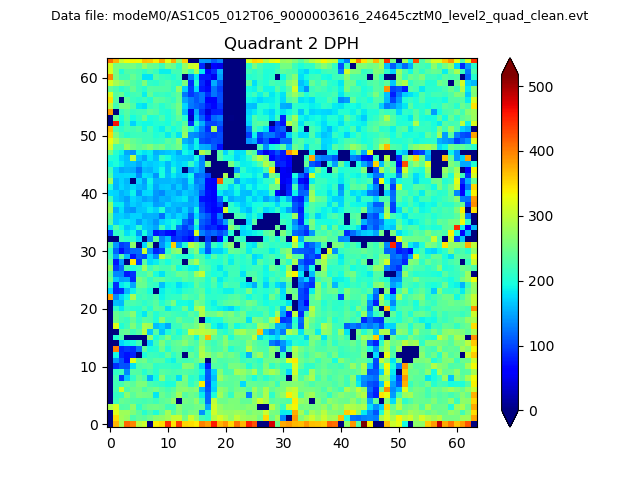
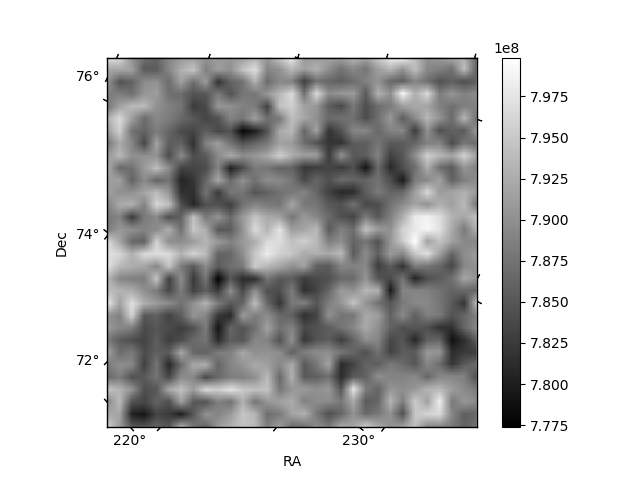
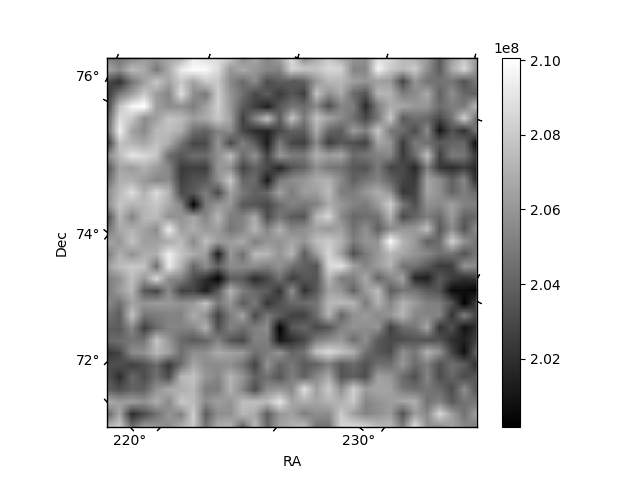
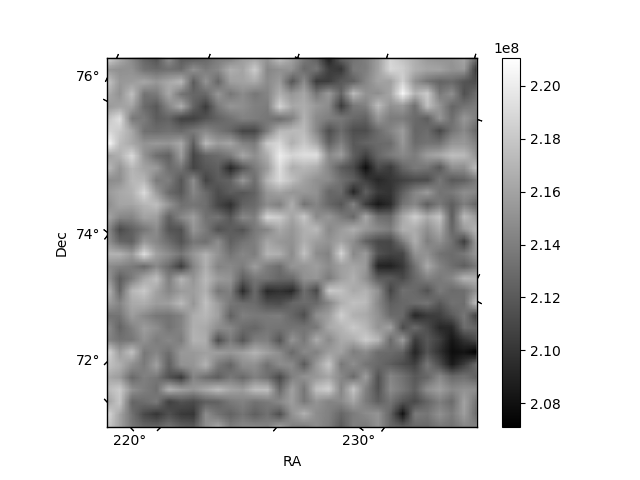
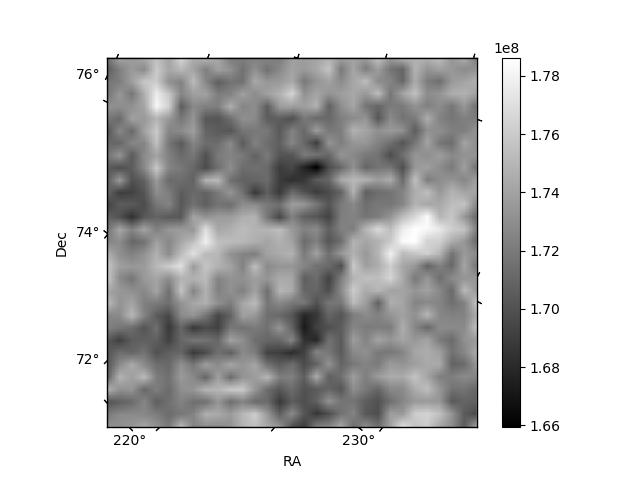
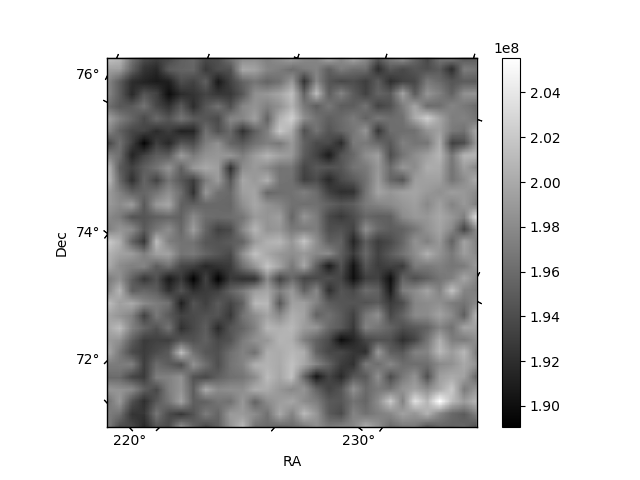
Histogram calculated using DETX and DETY for each event in the final _common_clean file
| Quadrant A | 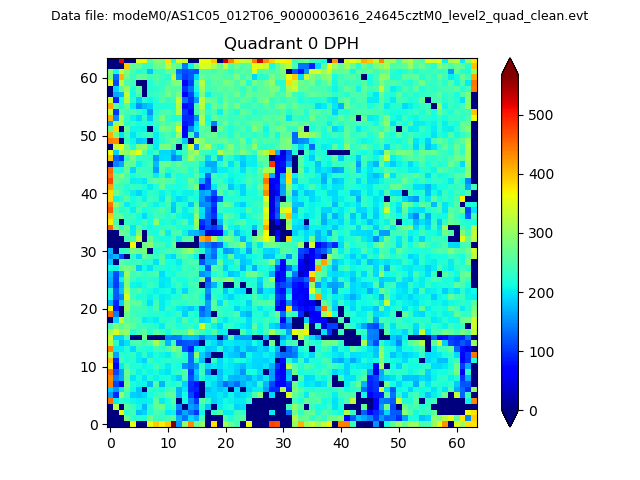 |
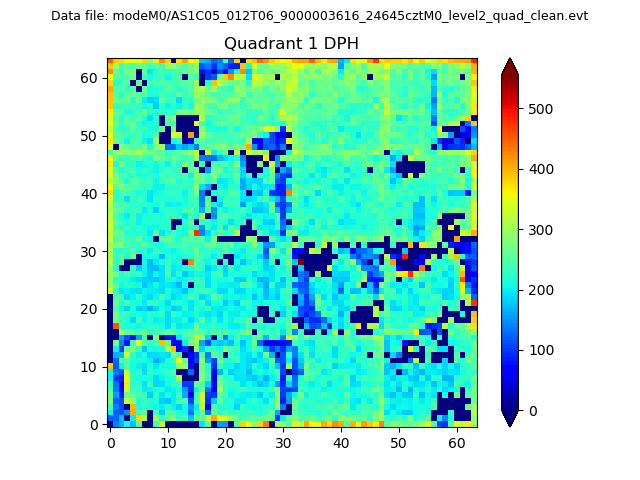 |
Quadrant B |
|---|---|---|---|
| Quadrant D | 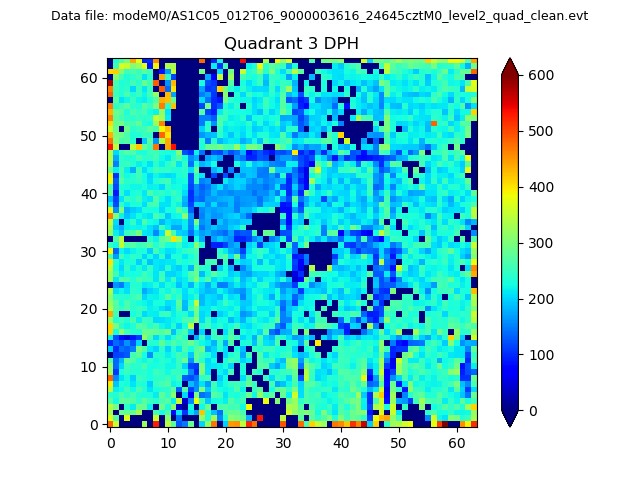 |
 |
Quadrant C |
| Plot type | Count rate plots | Images |
|---|---|---|
| Comparison with Poisson distribution Blue bars denote a histogram of data divided into 1 sec bins. Red curve is a Poisson curve with rate = median count rate of data. |
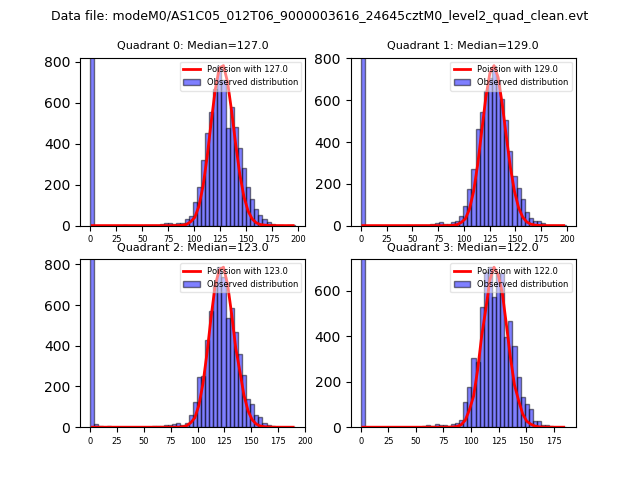 |
 |
| Quadrant-wise count rates Data is divided into 100 sec bins |
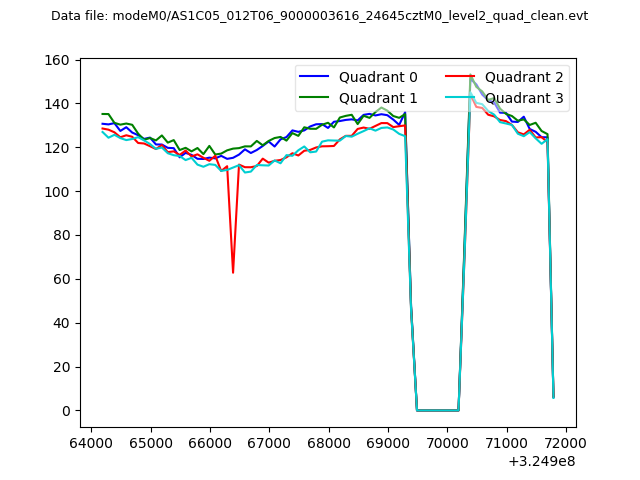 |
|
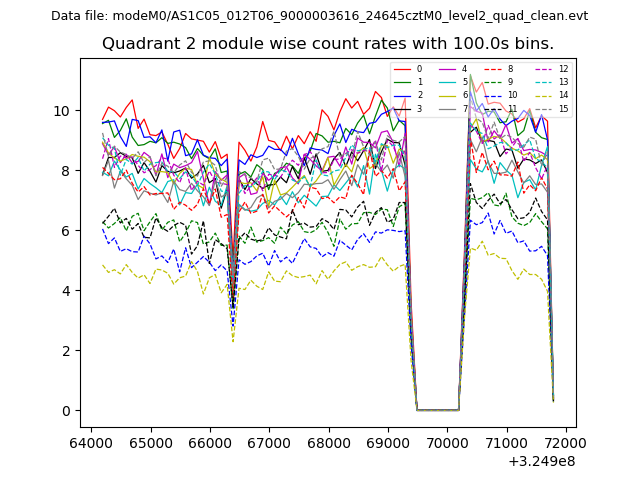
| Module-wise count rates for Quadrant A Data is divided into 100 sec bins |
 |
 |
| Module-wise count rates for Quadrant B Data is divided into 100 sec bins |
 |
 |
| Module-wise count rates for Quadrant C Data is divided into 100 sec bins |
 |
 |
| Module-wise count rates for Quadrant D Data is divided into 100 sec bins |
 |
 |
| Parameter | Plot |
|---|---|
| CZT HV Monitor |  |
| D_VDD |  |
| Temperature 1 | 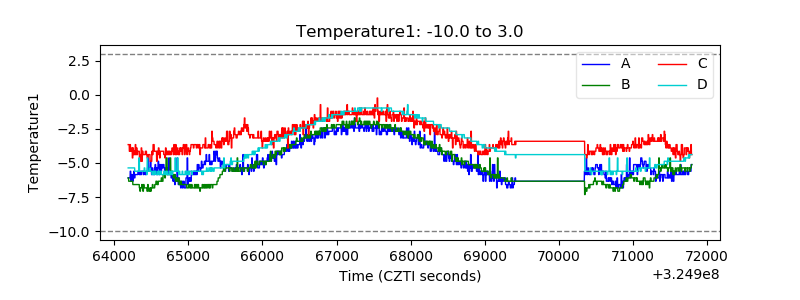 |
| Veto HV Monitor | 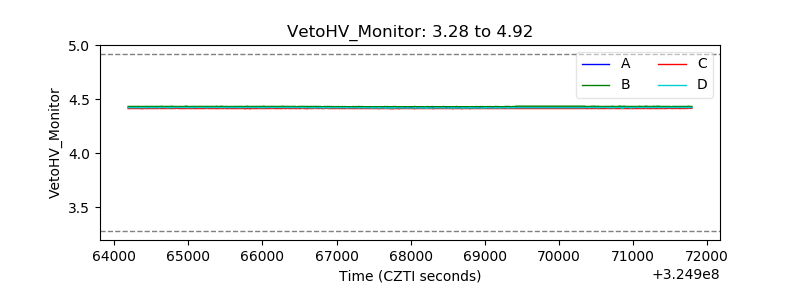 |
| Veto LLD |  |
| Alpha Counter | 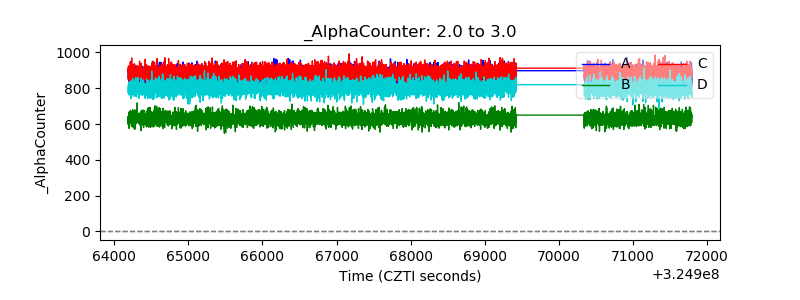 |
| _CPM_Rate | 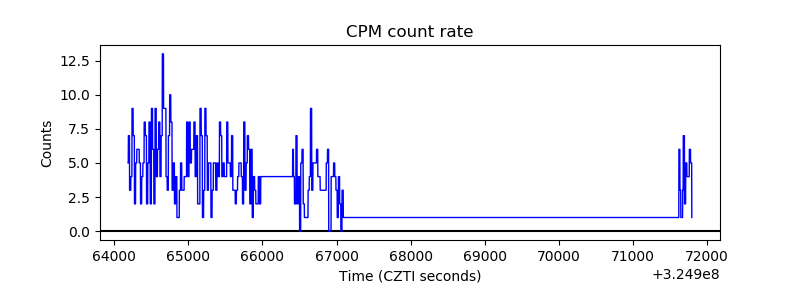 |
| CZT Counter | 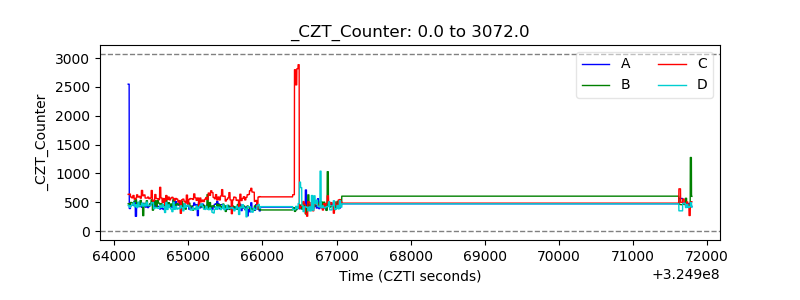 |
| +2.5 Volts monitor |  |
| +5 Volts monitor |  |
| _ROLL_ROT |  |
| _Roll_DEC | 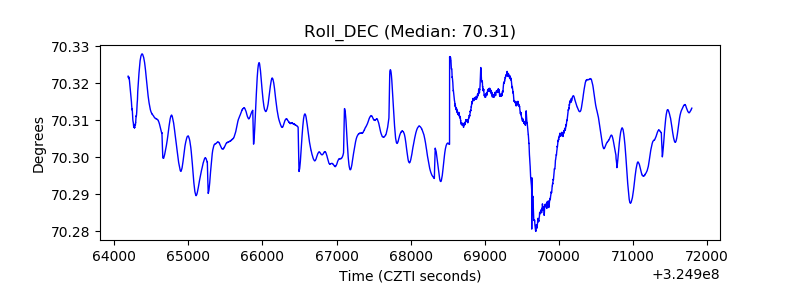 |
| _Roll_RA | 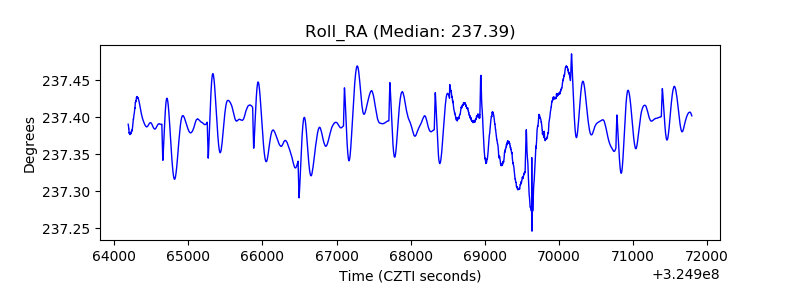 |
| Veto Counter |  |