| Param | Original file | Final file |
|---|---|---|
| Filename | modeM0/AS1C05_012T06_9000003616_24646cztM0_level2.evt | modeM0/AS1C05_012T06_9000003616_24646cztM0_level2_quad_clean.evt |
| Size (bytes) | 411,079,680 | 117,679,680 |
| Size | 392.0 MB | 112.2 MB |
| Events in quadrant A | 2,828,725 | 804,493 |
| Events in quadrant B | 2,973,170 | 810,762 |
| Events in quadrant C | 3,336,389 | 766,788 |
| Events in quadrant D | 2,903,518 | 763,417 |
| Mode M0 | |||
|---|---|---|---|
| Quadrant | BADHDUFLAG | Total packets | Discarded packets |
| A | 0 | 12231 | 1 |
| B | 0 | 12608 | 1 |
| C | 0 | 13721 | 1 |
| D | 0 | 12580 | 1 |
| Mode SS | |||
|---|---|---|---|
| Quadrant | BADHDUFLAG | Total packets | Discarded packets |
| A | 0 | 122 | 0 |
| B | 0 | 122 | 0 |
| C | 0 | 122 | 0 |
| D | 0 | 122 | 0 |
| Mode M9 | |||
|---|---|---|---|
| Quadrant | BADHDUFLAG | Total packets | Discarded packets |
| A | 0 | 11 | 0 |
| B | 0 | 11 | 0 |
| C | 0 | 11 | 0 |
| D | 0 | 11 | 0 |
| Quadrant | Total seconds | Saturated seconds | Saturation percentage |
|---|---|---|---|
| A | 5996 | 30 | 0.500334% |
| B | 5997 | 44 | 0.733700% |
| C | 5997 | 63 | 1.050525% |
| D | 5997 | 26 | 0.433550% |
Noise dominated data is calculated using 1-second bins in cleaned event files. If a bin has >2000 counts, and if more than 50% of those come from <1% of pixels, then it is considered to be noise-dominated and hence unusable.
| Quadrant | # 1 sec bins | Bins with >0 counts | Bins with >2000 counts | High rate bins dominated by noise | Noise dominated (total time) | Noise dominated (detector-on time) | Marked lightcurve |
|---|---|---|---|---|---|---|---|
| A | 7066 | 5996 | 0 | 0 | 0.00% | 0.00% | 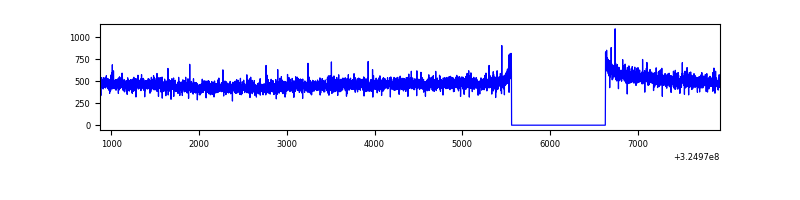 |
| B | 7067 | 5997 | 6 | 6 | 0.08% | 0.10% | 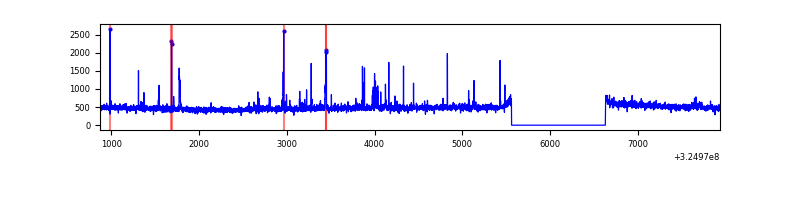 |
| C | 7067 | 5997 | 2 | 2 | 0.03% | 0.03% | 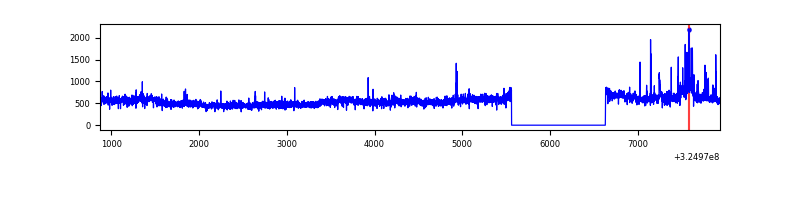 |
| D | 7067 | 5998 | 11 | 11 | 0.16% | 0.18% | 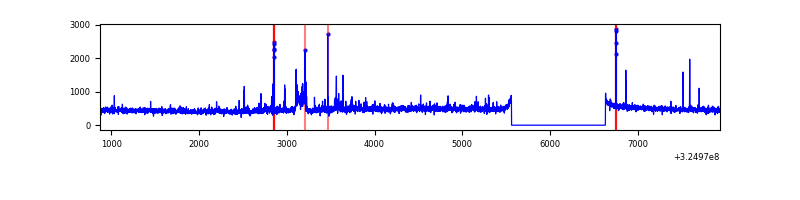 |
Top three noisy pixels from each quadrant. If the there are fewer than three noisy pixels in the level2.evt file, extra rows are filled as -1
| Pixel properties | Quadrant properties | ||||||
|---|---|---|---|---|---|---|---|
| Quadrant | DetID | PixID | Counts | Sigma | Mean | Median | Sigma |
| A | 13 | 254 | 9975 | 63.09 | 732 | 718 | 146.7 |
| A | 3 | 137 | 6432 | 38.94 | 732 | 718 | 146.7 |
| A | 0 | 226 | 6271 | 37.85 | 732 | 718 | 146.7 |
| B | 5 | 172 | 74615 | 537.91 | 721 | 703 | 137.4 |
| B | 15 | 32 | 28750 | 204.12 | 721 | 703 | 137.4 |
| B | 0 | 189 | 17068 | 119.1 | 721 | 703 | 137.4 |
| C | 7 | 247 | 495986 | 3092.06 | 690 | 692 | 160.2 |
| C | 14 | 238 | 112690 | 699.19 | 690 | 692 | 160.2 |
| C | 2 | 16 | 18091 | 108.62 | 690 | 692 | 160.2 |
| D | 7 | 238 | 77453 | 442.36 | 707 | 685 | 173.5 |
| D | 8 | 195 | 72460 | 413.59 | 707 | 685 | 173.5 |
| D | 1 | 52 | 54174 | 308.22 | 707 | 685 | 173.5 |
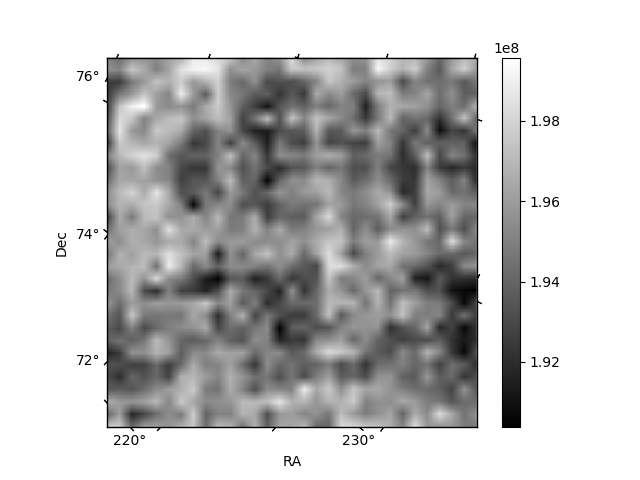
Histogram calculated using DETX and DETY for each event in the final _common_clean file
| Quadrant A |  |
 |
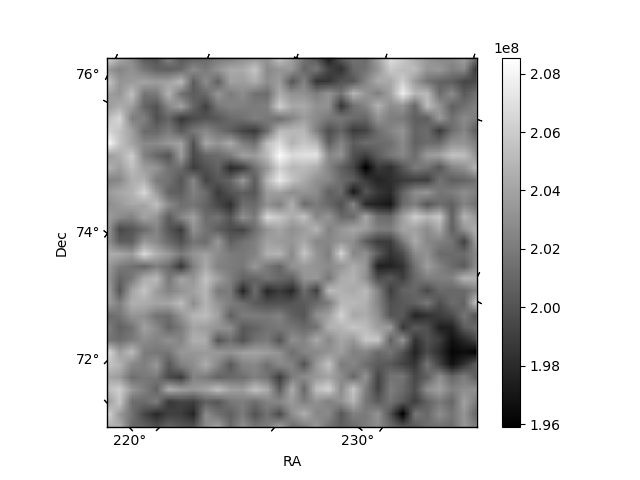
Quadrant B |
|---|---|---|---|
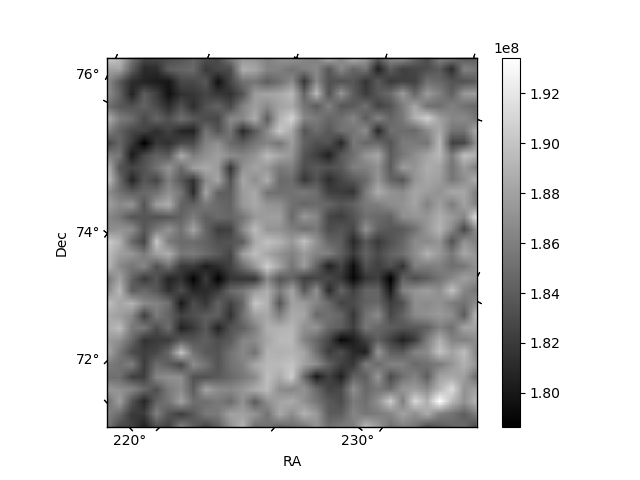
| Quadrant D |  |
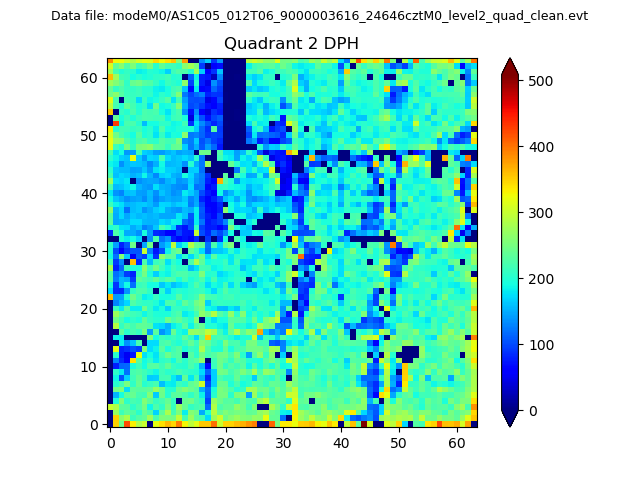 |
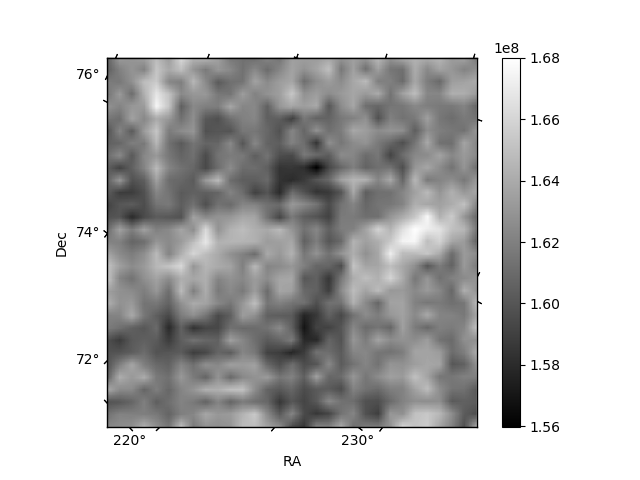
Quadrant C |
| Plot type | Count rate plots | Images |
|---|---|---|
| Comparison with Poisson distribution Blue bars denote a histogram of data divided into 1 sec bins. Red curve is a Poisson curve with rate = median count rate of data. |
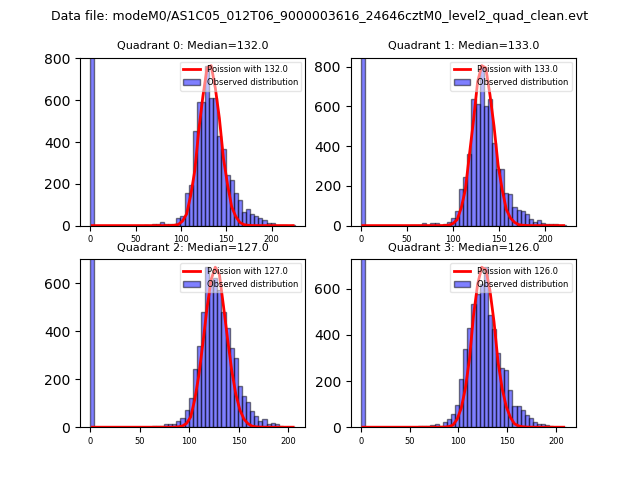 |
 |
| Quadrant-wise count rates Data is divided into 100 sec bins |
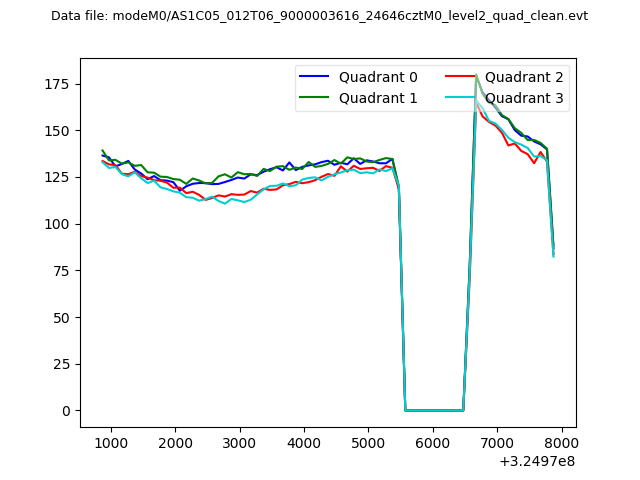 |
|
| Module-wise count rates for Quadrant A Data is divided into 100 sec bins |
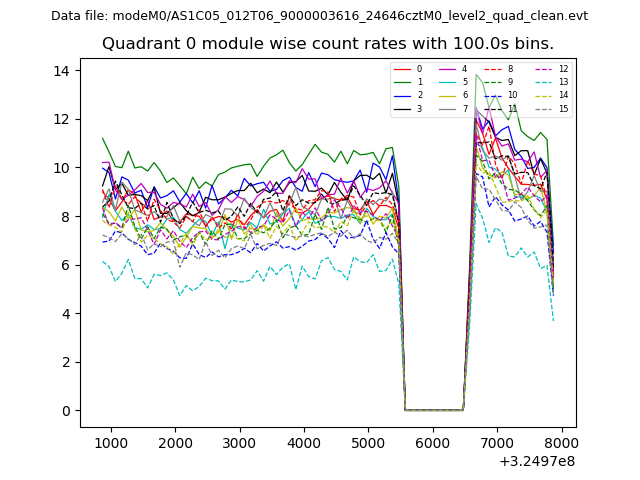 |
 |
| Module-wise count rates for Quadrant B Data is divided into 100 sec bins |
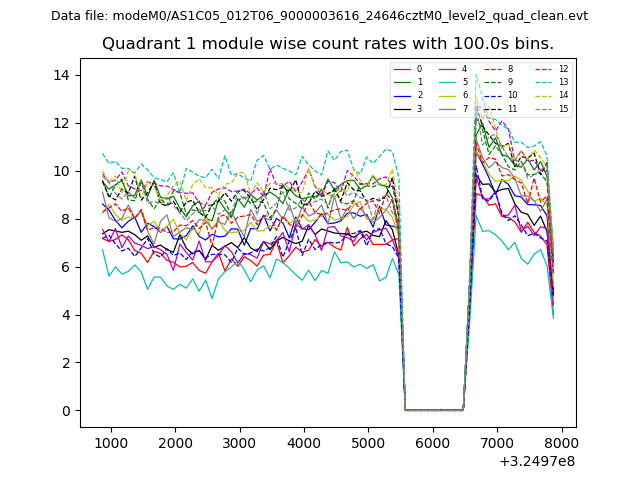 |
 |
| Module-wise count rates for Quadrant C Data is divided into 100 sec bins |
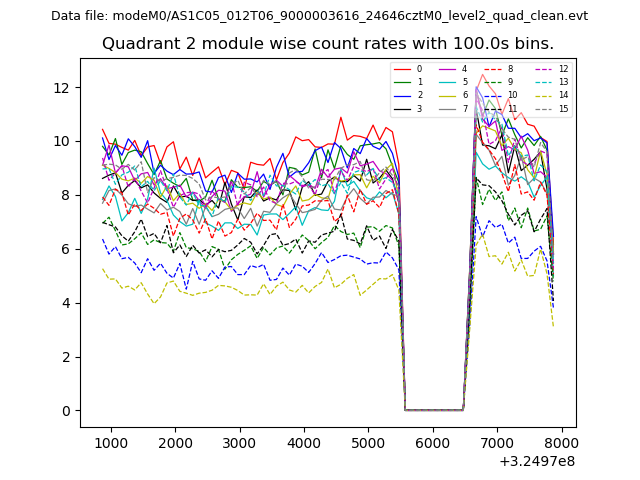 |
 |
| Module-wise count rates for Quadrant D Data is divided into 100 sec bins |
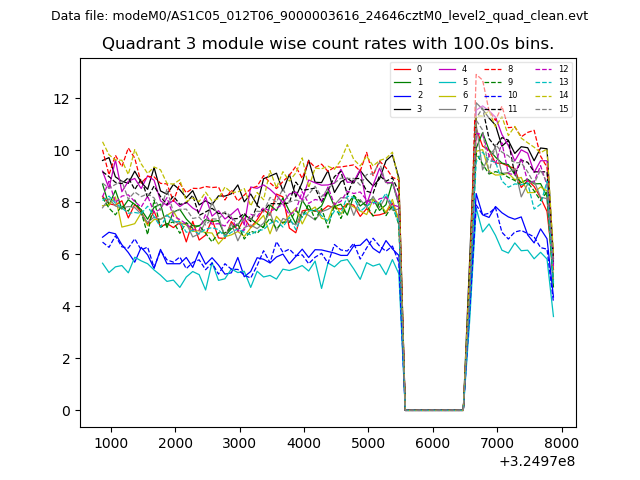 |
 |
| Parameter | Plot |
|---|---|
| CZT HV Monitor | 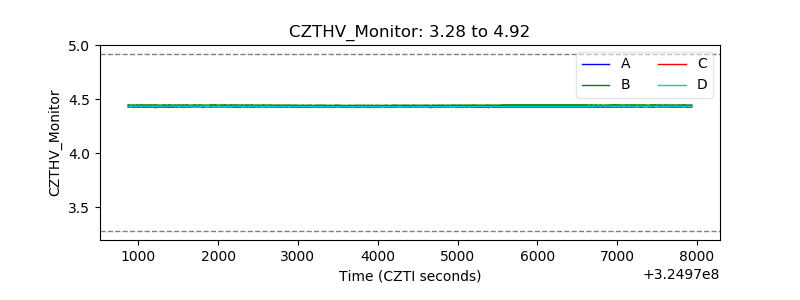 |
| D_VDD | 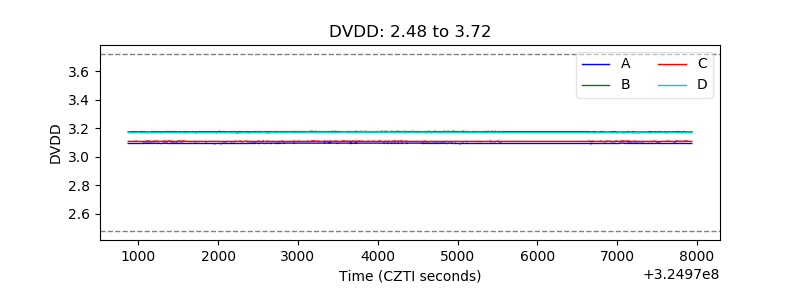 |
| Temperature 1 | 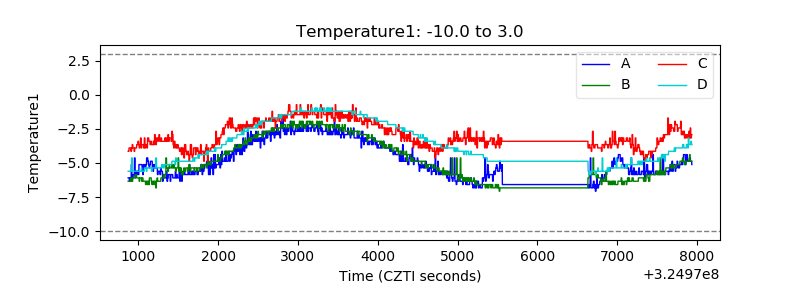 |
| Veto HV Monitor | 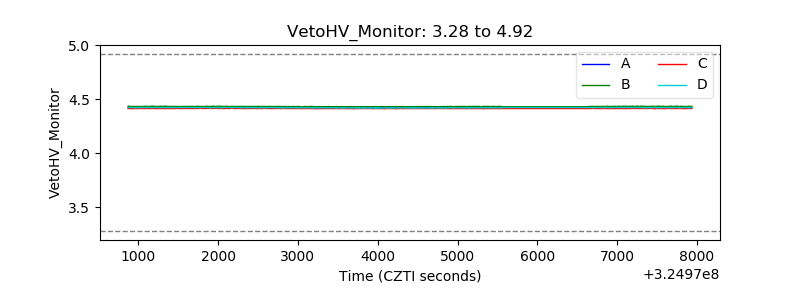 |
| Veto LLD |  |
| Alpha Counter | 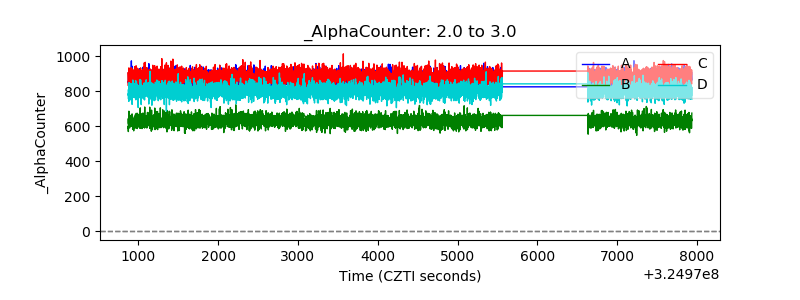 |
| _CPM_Rate | 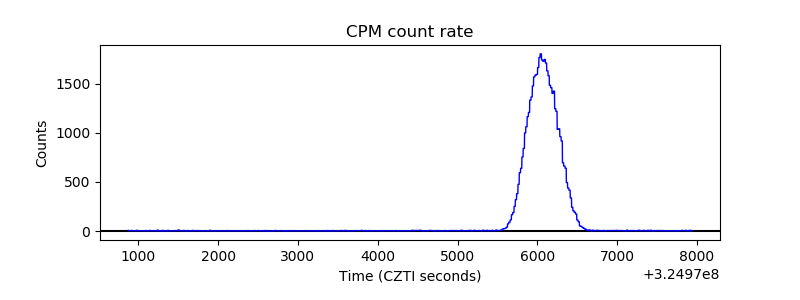 |
| CZT Counter | 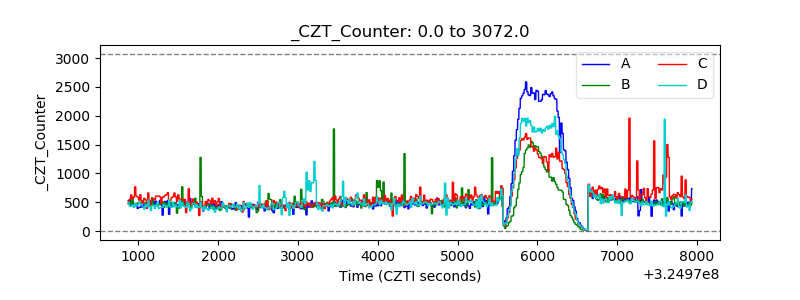 |
| +2.5 Volts monitor |  |
| +5 Volts monitor | 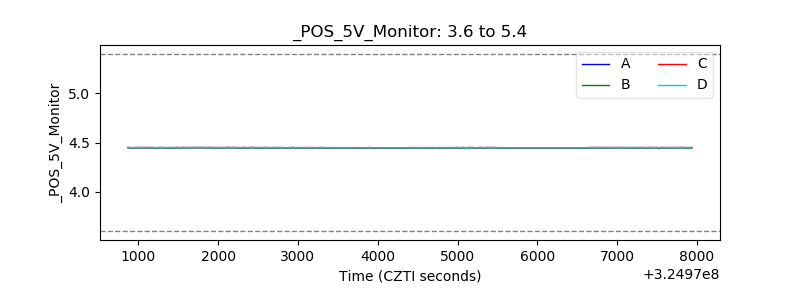 |
| _ROLL_ROT | 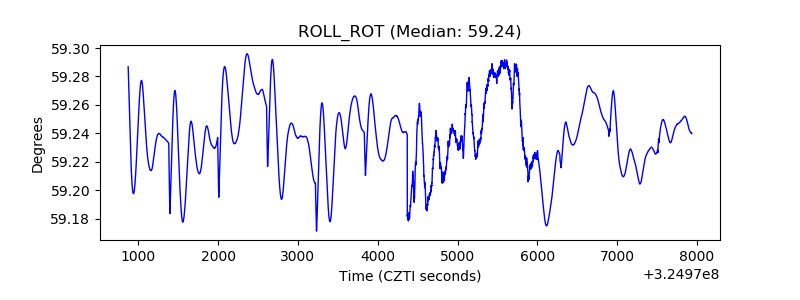 |
| _Roll_DEC | 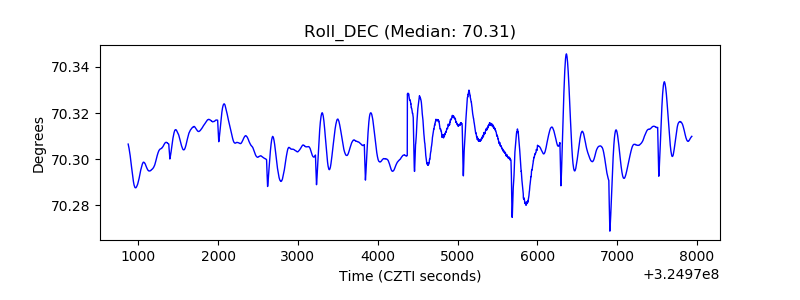 |
| _Roll_RA | 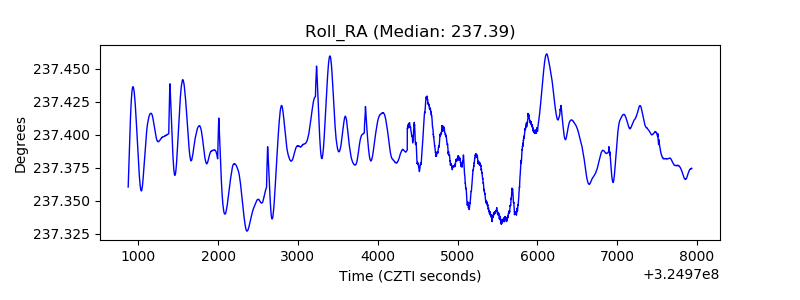 |
| Veto Counter | 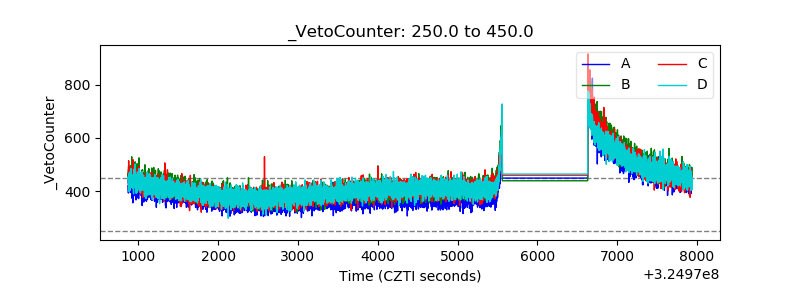 |