| Param | Original file | Final file |
|---|---|---|
| Filename | modeM0/AS1C05_012T06_9000003616_24648cztM0_level2.evt | modeM0/AS1C05_012T06_9000003616_24648cztM0_level2_quad_clean.evt |
| Size (bytes) | 339,264,000 | 92,496,960 |
| Size | 323.5 MB | 88.2 MB |
| Events in quadrant A | 2,192,209 | 640,003 |
| Events in quadrant B | 2,325,820 | 642,121 |
| Events in quadrant C | 3,223,280 | 593,736 |
| Events in quadrant D | 2,221,265 | 603,658 |
| Mode M0 | |||
|---|---|---|---|
| Quadrant | BADHDUFLAG | Total packets | Discarded packets |
| A | 0 | 9360 | 1 |
| B | 0 | 9754 | 1 |
| C | 0 | 12735 | 1 |
| D | 0 | 9566 | 1 |
| Mode SS | |||
|---|---|---|---|
| Quadrant | BADHDUFLAG | Total packets | Discarded packets |
| A | 0 | 92 | 0 |
| B | 0 | 92 | 0 |
| C | 0 | 92 | 0 |
| D | 0 | 92 | 0 |
| Quadrant | Total seconds | Saturated seconds | Saturation percentage |
|---|---|---|---|
| A | 4577 | 9 | 0.196635% |
| B | 4578 | 15 | 0.327654% |
| C | 4578 | 116 | 2.533858% |
| D | 4578 | 9 | 0.196592% |
Noise dominated data is calculated using 1-second bins in cleaned event files. If a bin has >2000 counts, and if more than 50% of those come from <1% of pixels, then it is considered to be noise-dominated and hence unusable.
| Quadrant | # 1 sec bins | Bins with >0 counts | Bins with >2000 counts | High rate bins dominated by noise | Noise dominated (total time) | Noise dominated (detector-on time) | Marked lightcurve |
|---|---|---|---|---|---|---|---|
| A | 4577 | 4577 | 0 | 0 | 0.00% | 0.00% |  |
| B | 4578 | 4578 | 4 | 4 | 0.09% | 0.09% |  |
| C | 4578 | 4578 | 47 | 47 | 1.03% | 1.03% |  |
| D | 4578 | 4578 | 6 | 6 | 0.13% | 0.13% |  |
Top three noisy pixels from each quadrant. If the there are fewer than three noisy pixels in the level2.evt file, extra rows are filled as -1
| Pixel properties | Quadrant properties | ||||||
|---|---|---|---|---|---|---|---|
| Quadrant | DetID | PixID | Counts | Sigma | Mean | Median | Sigma |
| A | 13 | 254 | 7499 | 61.53 | 567 | 557 | 112.8 |
| A | 0 | 226 | 4898 | 38.48 | 567 | 557 | 112.8 |
| A | 3 | 137 | 4856 | 38.1 | 567 | 557 | 112.8 |
| B | 5 | 172 | 63371 | 596.54 | 556 | 542 | 105.3 |
| B | 0 | 189 | 25849 | 240.28 | 556 | 542 | 105.3 |
| B | 0 | 245 | 18930 | 174.59 | 556 | 542 | 105.3 |
| C | 7 | 247 | 1024240 | 8282.02 | 530 | 533 | 123.6 |
| C | 14 | 238 | 85424 | 686.79 | 530 | 533 | 123.6 |
| C | 2 | 16 | 28238 | 224.14 | 530 | 533 | 123.6 |
| D | 8 | 195 | 83809 | 621.46 | 547 | 529 | 134.0 |
| D | 12 | 235 | 36977 | 271.98 | 547 | 529 | 134.0 |
| D | 2 | 120 | 17496 | 126.61 | 547 | 529 | 134.0 |
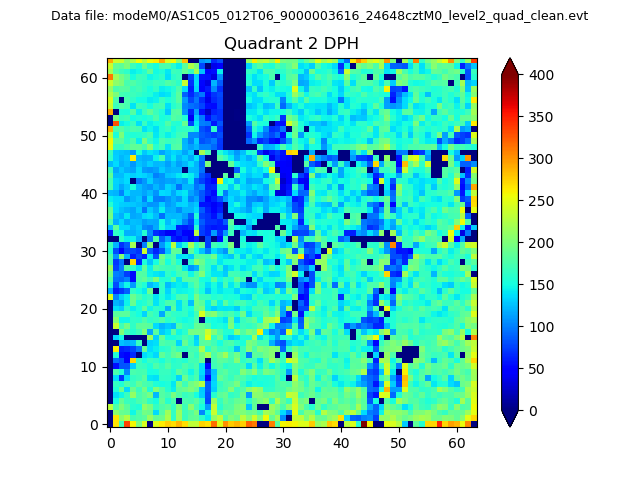
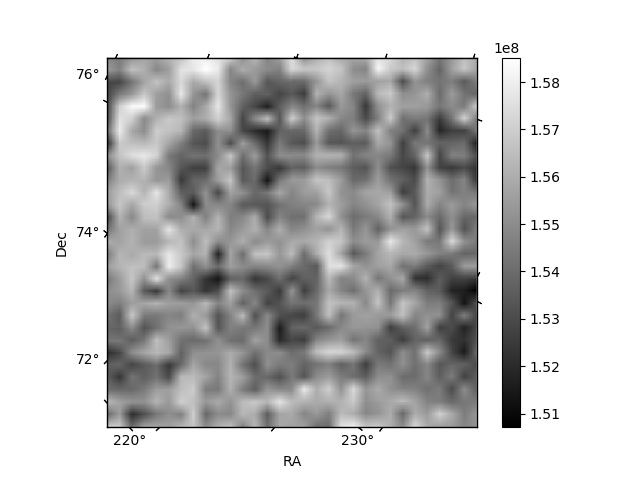
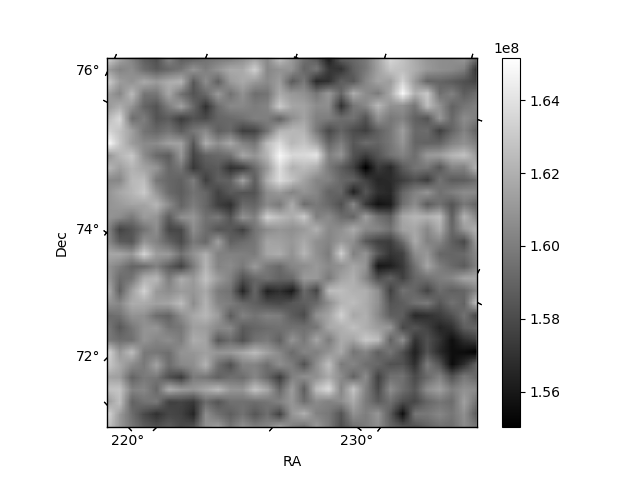
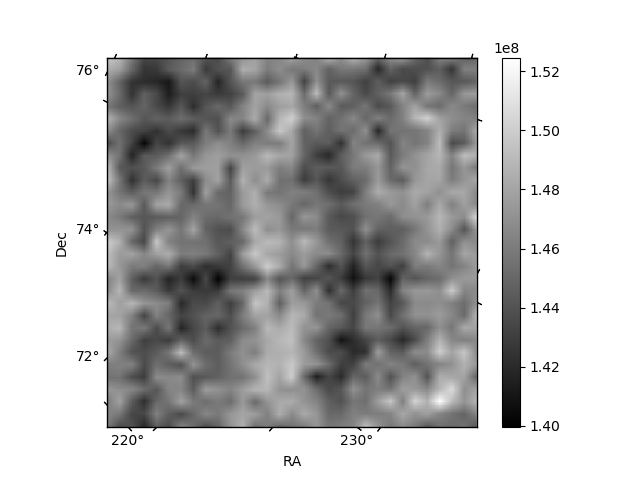
Histogram calculated using DETX and DETY for each event in the final _common_clean file
| Quadrant A | 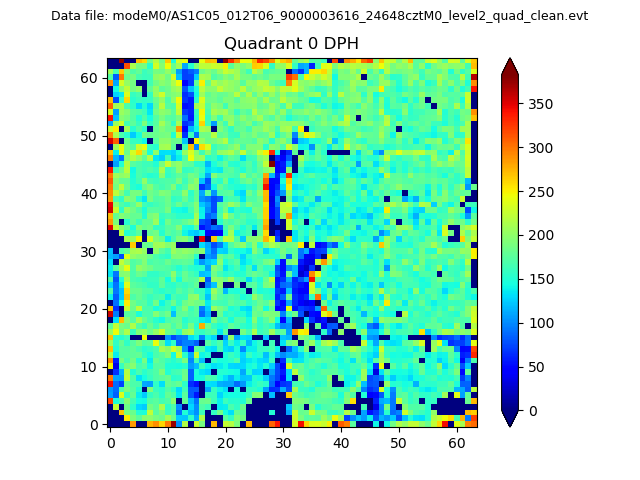 |
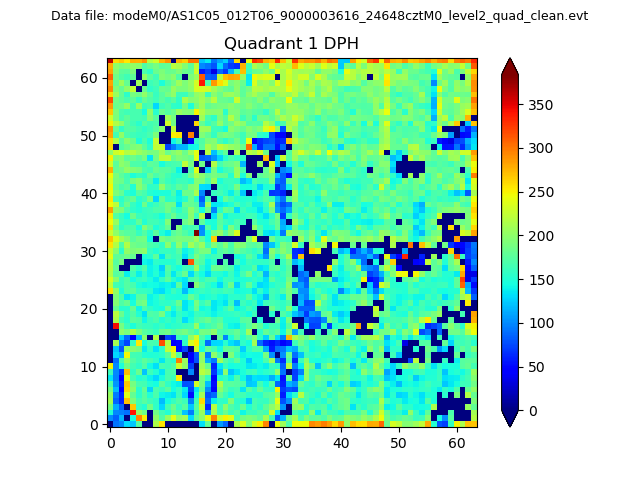 |
Quadrant B |
|---|---|---|---|
| Quadrant D | 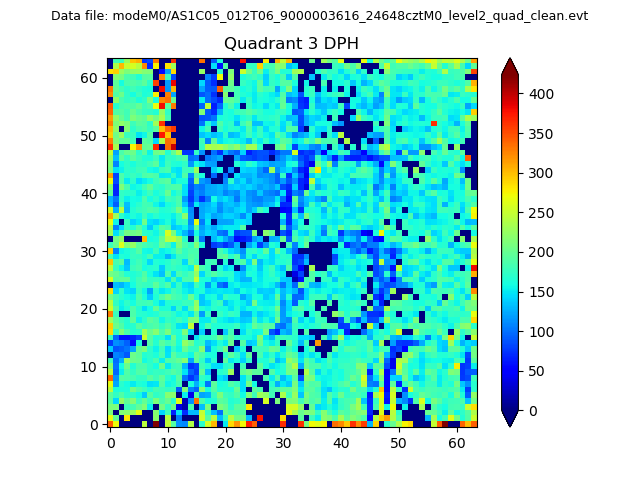 |
 |
Quadrant C |
| Plot type | Count rate plots | Images |
|---|---|---|
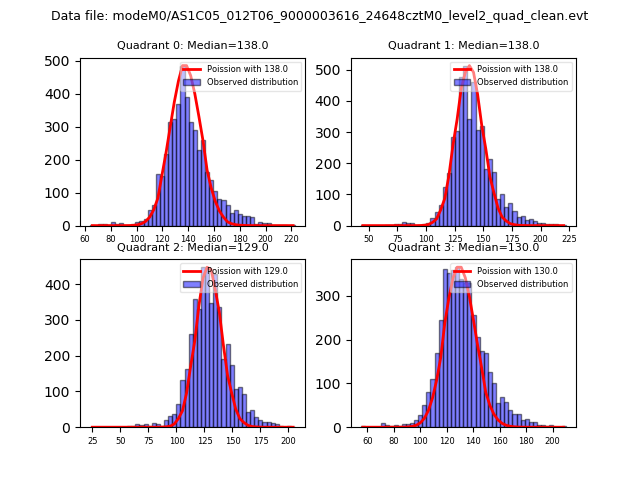
| Comparison with Poisson distribution Blue bars denote a histogram of data divided into 1 sec bins. Red curve is a Poisson curve with rate = median count rate of data. |
 |
 |
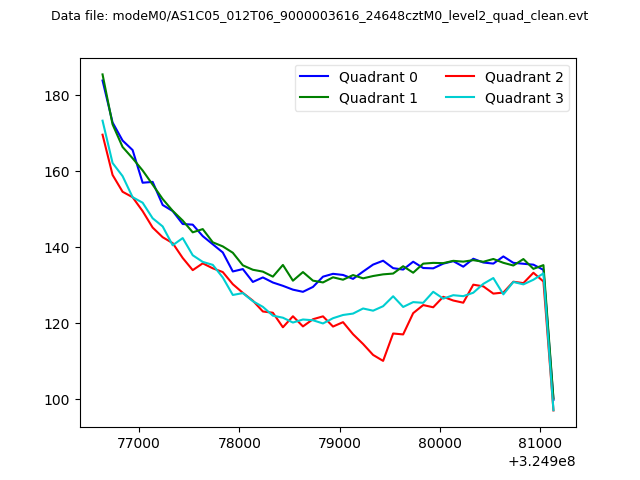
| Quadrant-wise count rates Data is divided into 100 sec bins |
 |
|
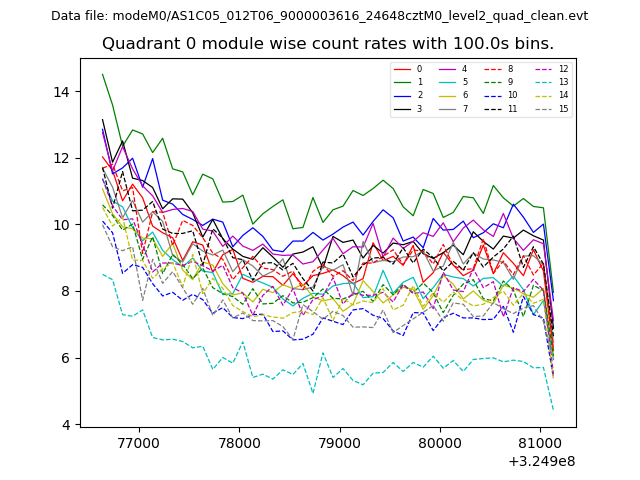
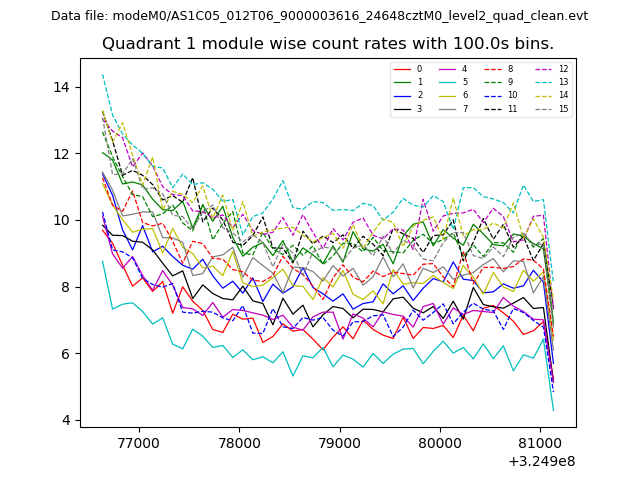
| Module-wise count rates for Quadrant A Data is divided into 100 sec bins |
 |
 |
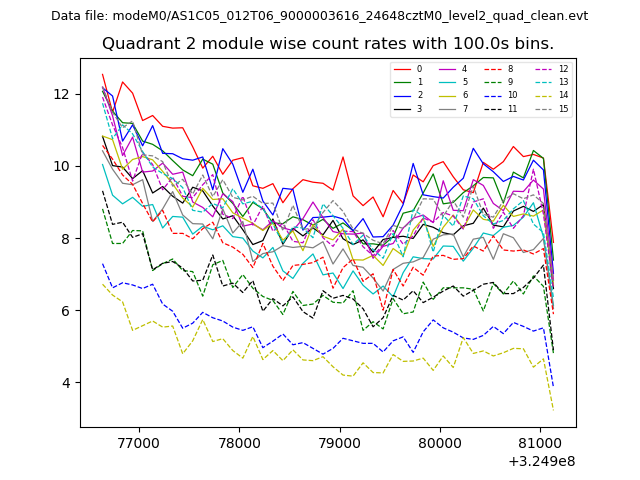
| Module-wise count rates for Quadrant B Data is divided into 100 sec bins |
 |
 |
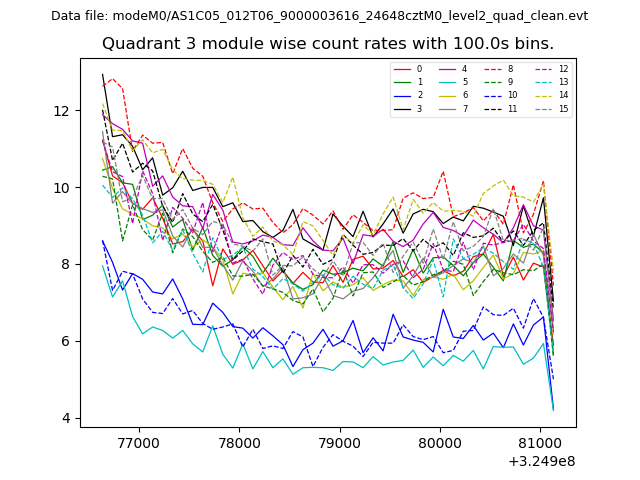
| Module-wise count rates for Quadrant C Data is divided into 100 sec bins |
 |
 |
| Module-wise count rates for Quadrant D Data is divided into 100 sec bins |
 |
 |
| Parameter | Plot |
|---|---|
| CZT HV Monitor | 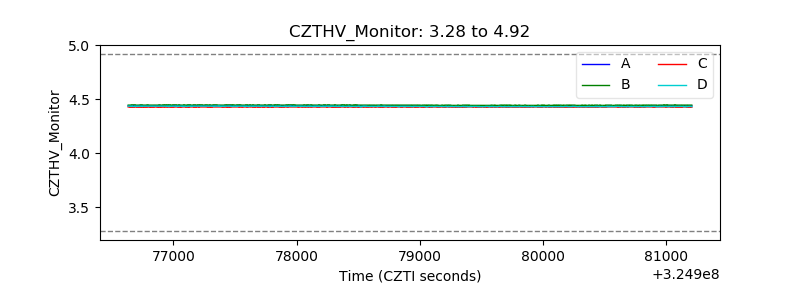 |
| D_VDD | 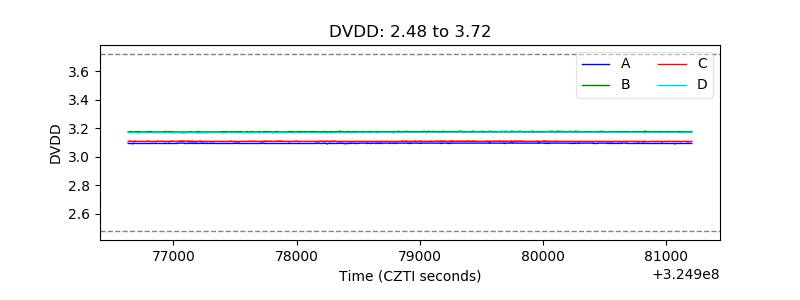 |
| Temperature 1 |  |
| Veto HV Monitor | 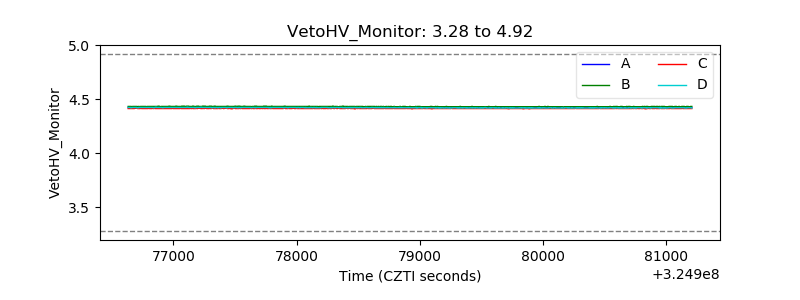 |
| Veto LLD | 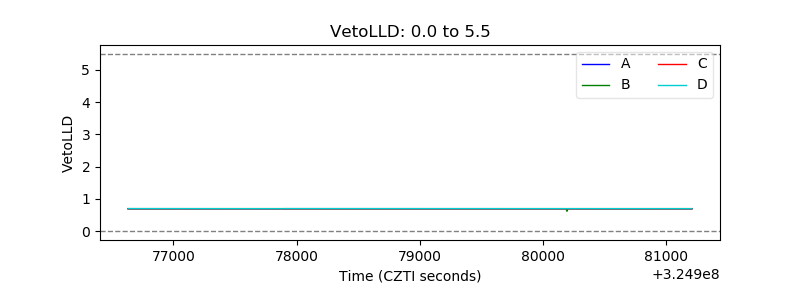 |
| Alpha Counter | 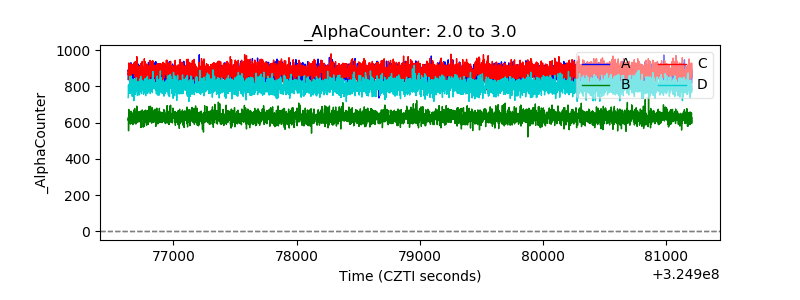 |
| _CPM_Rate | 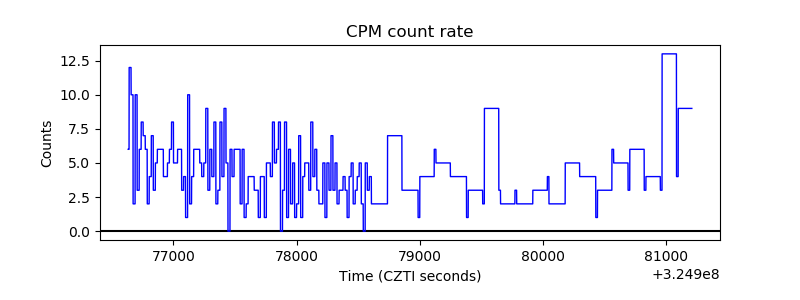 |
| CZT Counter | 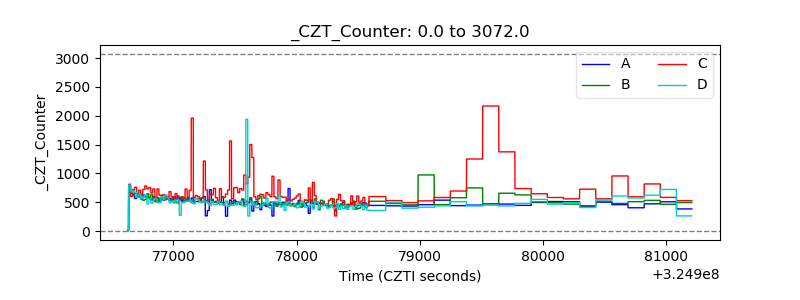 |
| +2.5 Volts monitor |  |
| +5 Volts monitor |  |
| _ROLL_ROT |  |
| _Roll_DEC | 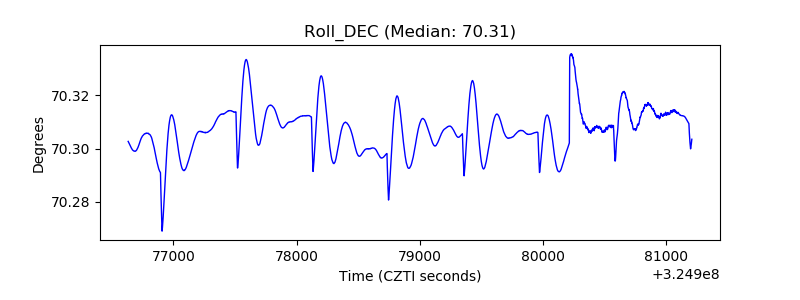 |
| _Roll_RA | 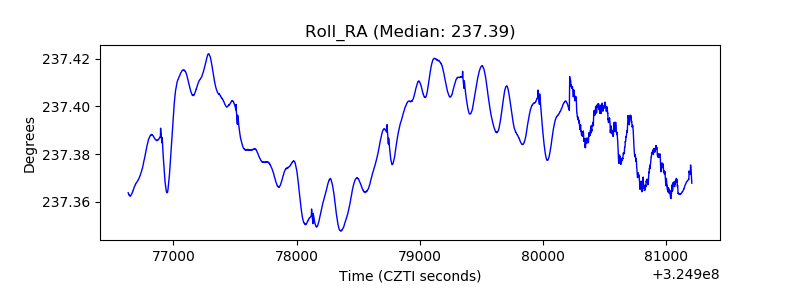 |
| Veto Counter | 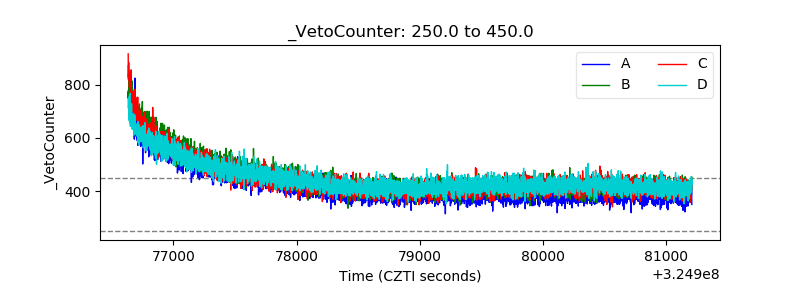 |