| Param | Original file | Final file |
|---|---|---|
| Filename | modeM0/AS1T03_191T01_9000003618_24648cztM0_level2.evt | modeM0/AS1T03_191T01_9000003618_24648cztM0_level2_quad_clean.evt |
| Size (bytes) | 129,493,440 | 34,225,920 |
| Size | 123.5 MB | 32.6 MB |
| Events in quadrant A | 834,609 | 243,624 |
| Events in quadrant B | 799,420 | 245,882 |
| Events in quadrant C | 1,364,016 | 219,046 |
| Events in quadrant D | 830,879 | 228,156 |
| Mode M9 | |||
|---|---|---|---|
| Quadrant | BADHDUFLAG | Total packets | Discarded packets |
| A | 0 | 1 | 0 |
| B | 0 | 1 | 0 |
| C | 0 | 1 | 0 |
| D | 0 | 1 | 0 |
| Mode M0 | |||
|---|---|---|---|
| Quadrant | BADHDUFLAG | Total packets | Discarded packets |
| A | 0 | 3442 | 1 |
| B | 0 | 3297 | 1 |
| C | 0 | 5037 | 1 |
| D | 0 | 3384 | 1 |
| Mode SS | |||
|---|---|---|---|
| Quadrant | BADHDUFLAG | Total packets | Discarded packets |
| A | 0 | 26 | 0 |
| B | 0 | 26 | 0 |
| C | 0 | 26 | 0 |
| D | 0 | 26 | 0 |
| Quadrant | Total seconds | Saturated seconds | Saturation percentage |
|---|---|---|---|
| A | 1331 | 12 | 0.901578% |
| B | 1331 | 10 | 0.751315% |
| C | 1331 | 136 | 10.217881% |
| D | 1330 | 9 | 0.676692% |
Noise dominated data is calculated using 1-second bins in cleaned event files. If a bin has >2000 counts, and if more than 50% of those come from <1% of pixels, then it is considered to be noise-dominated and hence unusable.
| Quadrant | # 1 sec bins | Bins with >0 counts | Bins with >2000 counts | High rate bins dominated by noise | Noise dominated (total time) | Noise dominated (detector-on time) | Marked lightcurve |
|---|---|---|---|---|---|---|---|
| A | 1331 | 1331 | 2 | 2 | 0.15% | 0.15% | 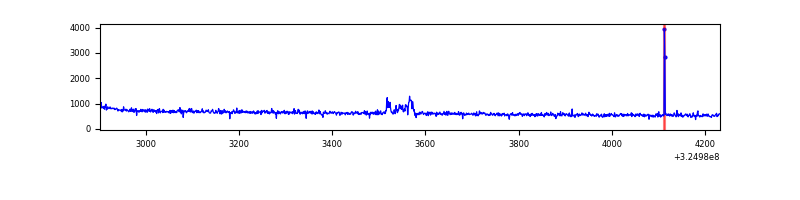 |
| B | 1331 | 1331 | 0 | 0 | 0.00% | 0.00% | 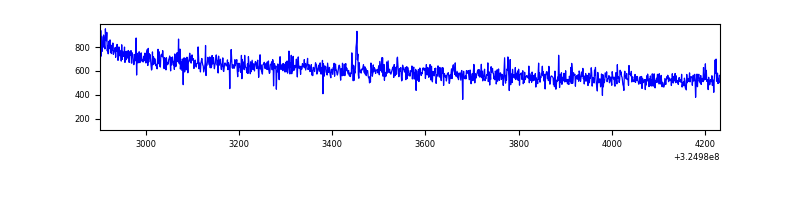 |
| C | 1331 | 1331 | 22 | 22 | 1.65% | 1.65% | 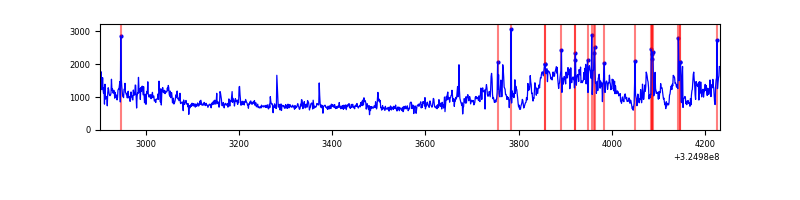 |
| D | 1330 | 1330 | 0 | 0 | 0.00% | 0.00% | 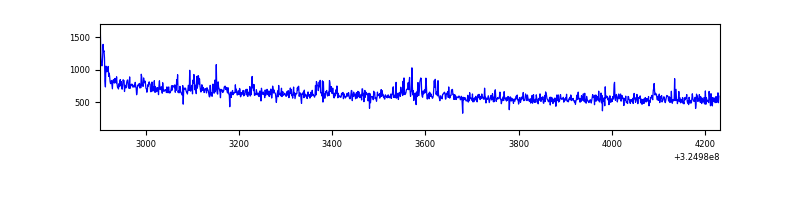 |
Top three noisy pixels from each quadrant. If the there are fewer than three noisy pixels in the level2.evt file, extra rows are filled as -1
| Pixel properties | Quadrant properties | ||||||
|---|---|---|---|---|---|---|---|
| Quadrant | DetID | PixID | Counts | Sigma | Mean | Median | Sigma |
| A | 6 | 16 | 15529 | 358.46 | 210 | 207 | 42.7 |
| A | 10 | 255 | 7110 | 161.5 | 210 | 207 | 42.7 |
| A | 13 | 254 | 2127 | 44.92 | 210 | 207 | 42.7 |
| B | 12 | 111 | 4301 | 104.24 | 204 | 200 | 39.3 |
| B | 11 | 111 | 3896 | 93.95 | 204 | 200 | 39.3 |
| B | 14 | 111 | 3766 | 90.64 | 204 | 200 | 39.3 |
| C | 7 | 247 | 542718 | 11730.81 | 196 | 198 | 46.2 |
| C | 14 | 238 | 32128 | 690.42 | 196 | 198 | 46.2 |
| C | 2 | 16 | 17137 | 366.27 | 196 | 198 | 46.2 |
| D | 12 | 235 | 18863 | 368.35 | 207 | 201 | 50.7 |
| D | 7 | 238 | 16711 | 325.88 | 207 | 201 | 50.7 |
| D | 8 | 195 | 12274 | 238.3 | 207 | 201 | 50.7 |
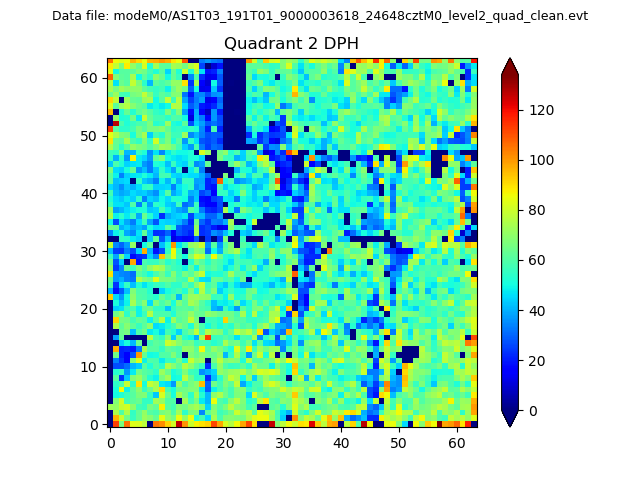
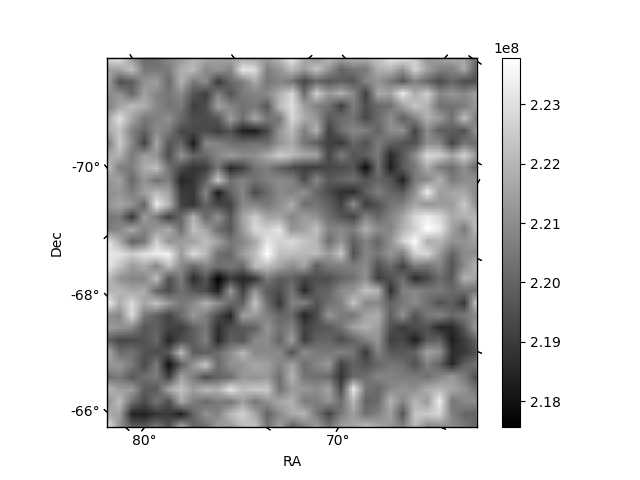
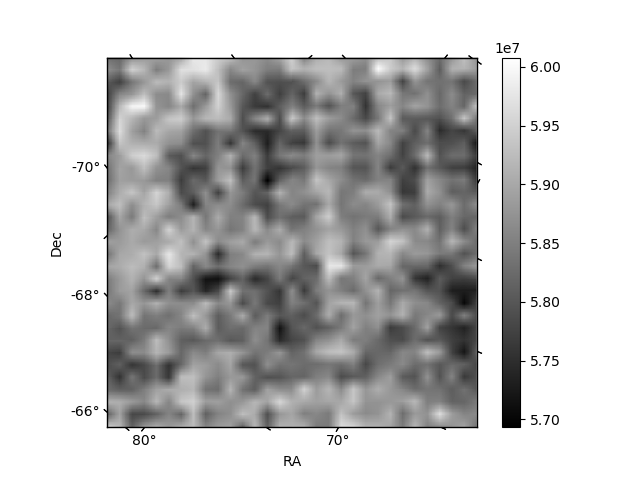
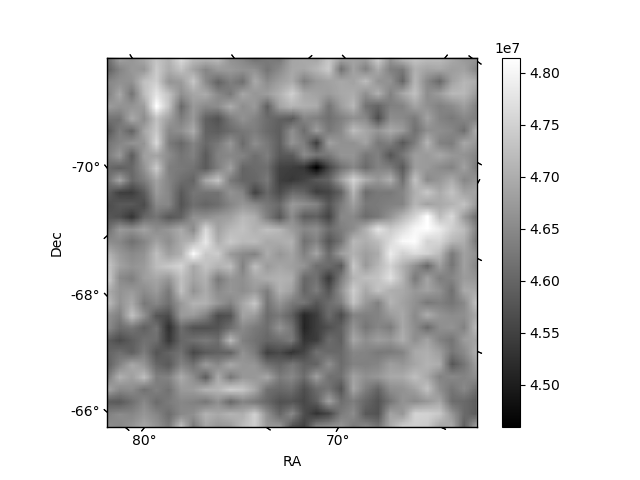
Histogram calculated using DETX and DETY for each event in the final _common_clean file
| Quadrant A | 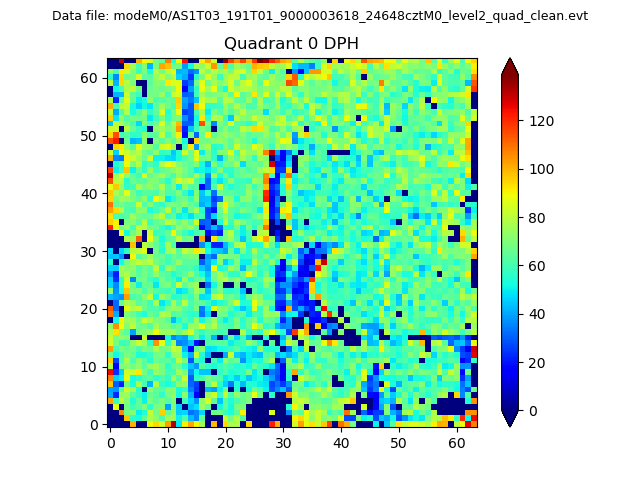 |
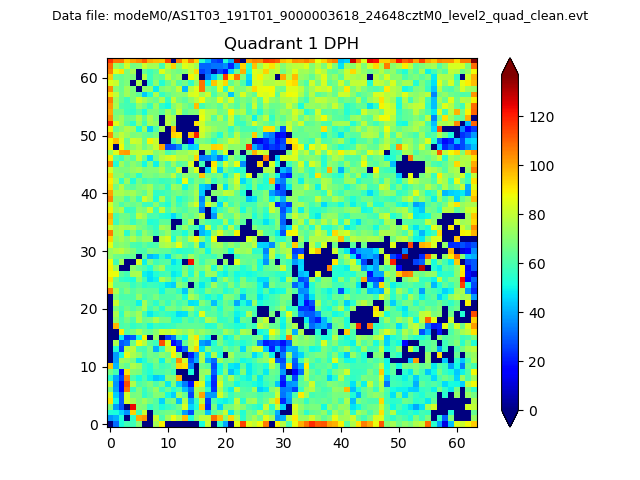 |
Quadrant B |
|---|---|---|---|
| Quadrant D | 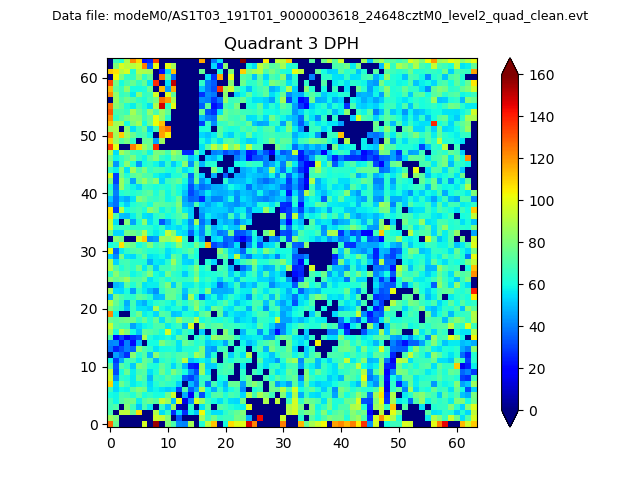 |
 |
Quadrant C |
| Plot type | Count rate plots | Images |
|---|---|---|
| Comparison with Poisson distribution Blue bars denote a histogram of data divided into 1 sec bins. Red curve is a Poisson curve with rate = median count rate of data. |
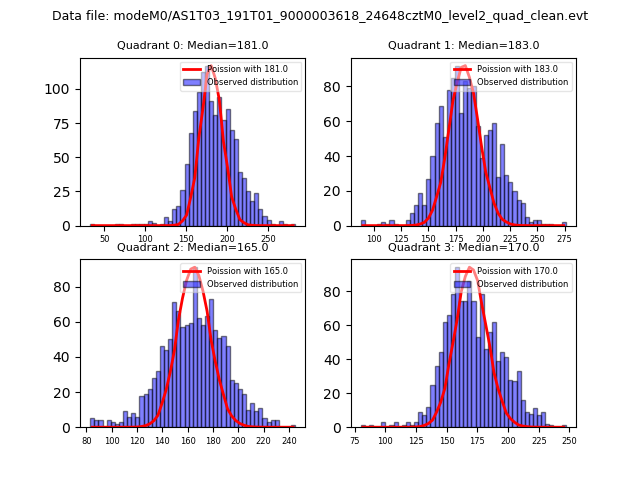 |
 |
| Quadrant-wise count rates Data is divided into 100 sec bins |
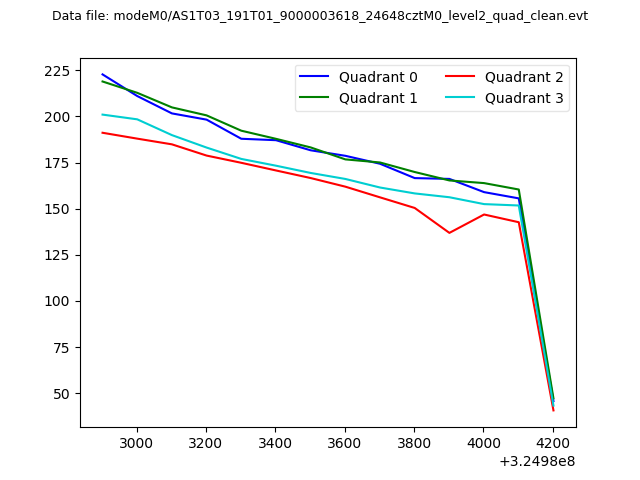 |
|
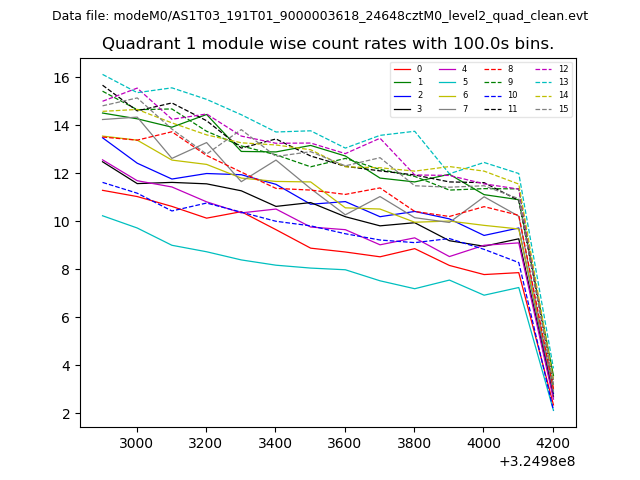
| Module-wise count rates for Quadrant A Data is divided into 100 sec bins |
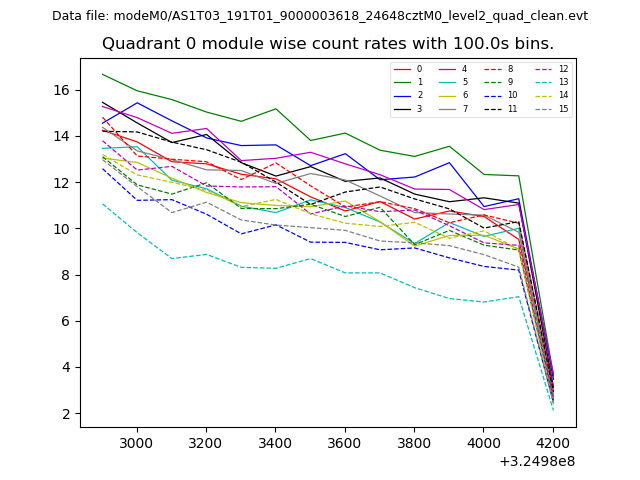 |
 |
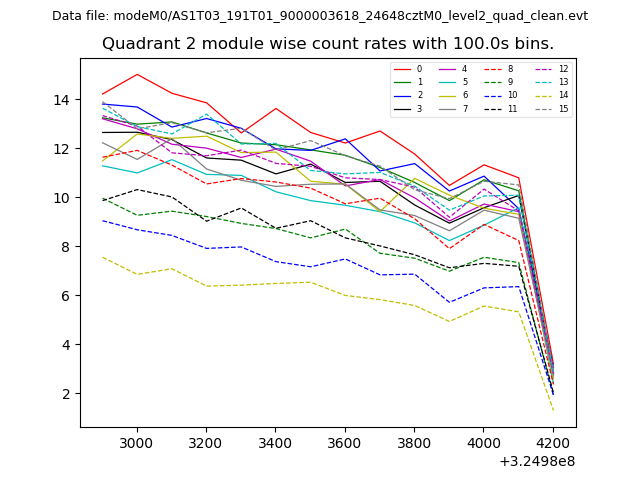
| Module-wise count rates for Quadrant B Data is divided into 100 sec bins |
 |
 |
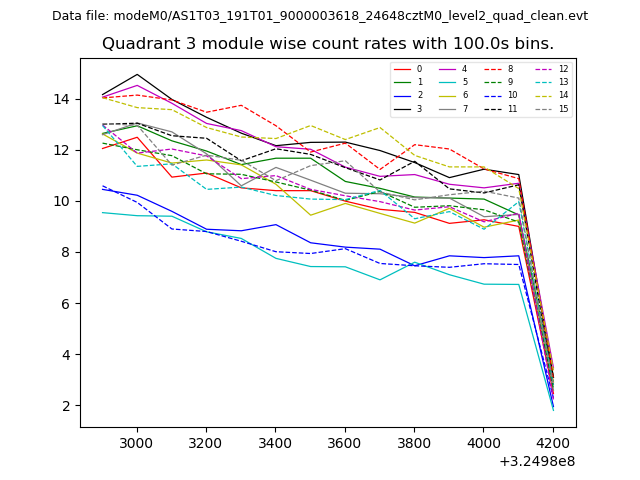
| Module-wise count rates for Quadrant C Data is divided into 100 sec bins |
 |
 |
| Module-wise count rates for Quadrant D Data is divided into 100 sec bins |
 |
 |
| Parameter | Plot |
|---|---|
| CZT HV Monitor | 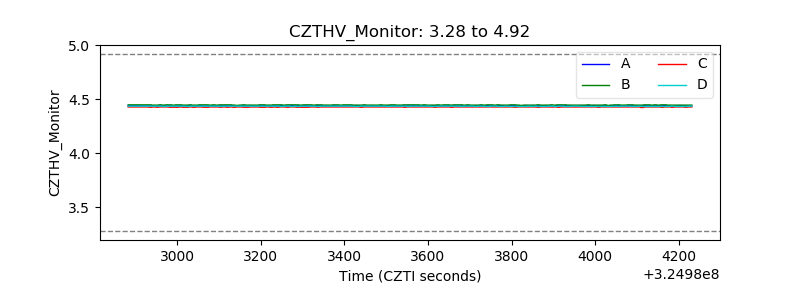 |
| D_VDD | 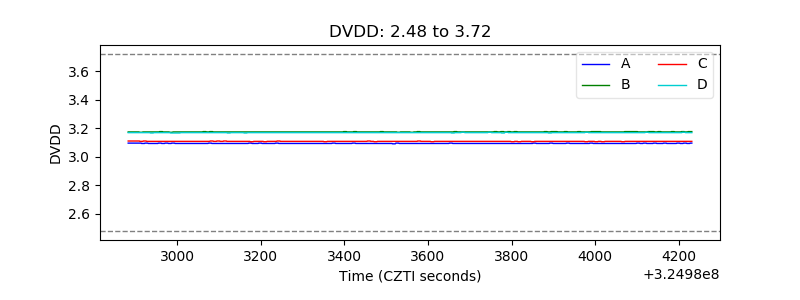 |
| Temperature 1 |  |
| Veto HV Monitor | 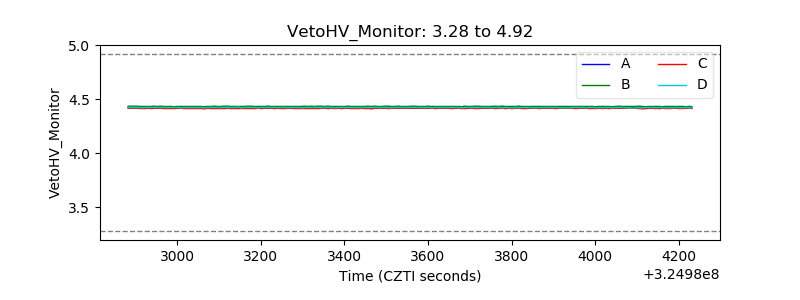 |
| Veto LLD | 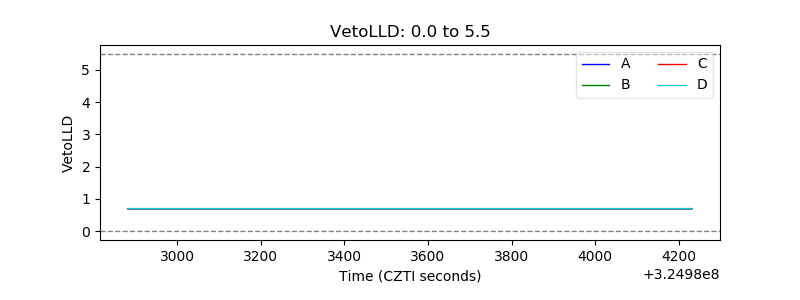 |
| Alpha Counter | 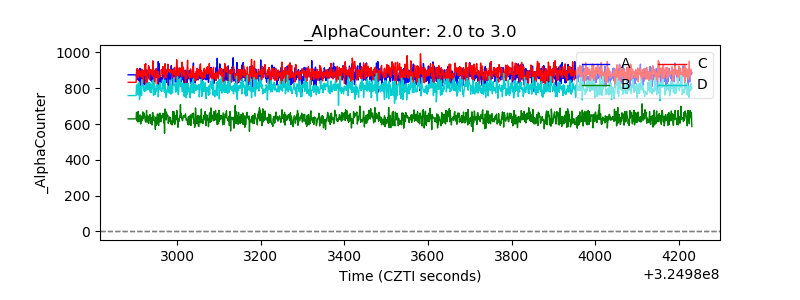 |
| _CPM_Rate | 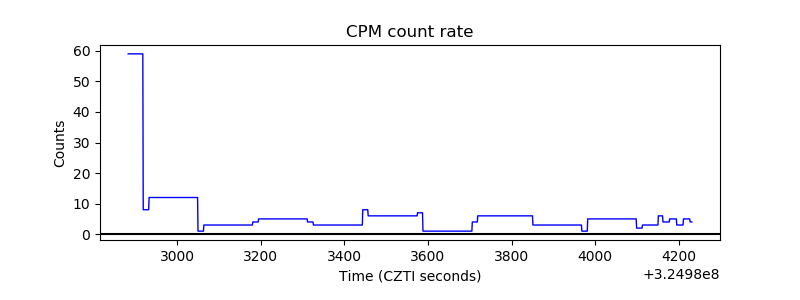 |
| CZT Counter | 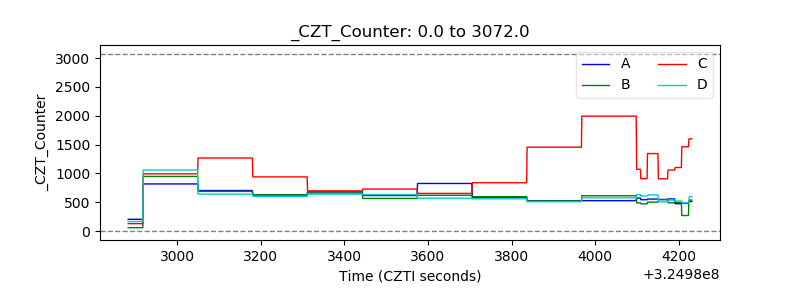 |
| +2.5 Volts monitor |  |
| +5 Volts monitor |  |
| _ROLL_ROT | 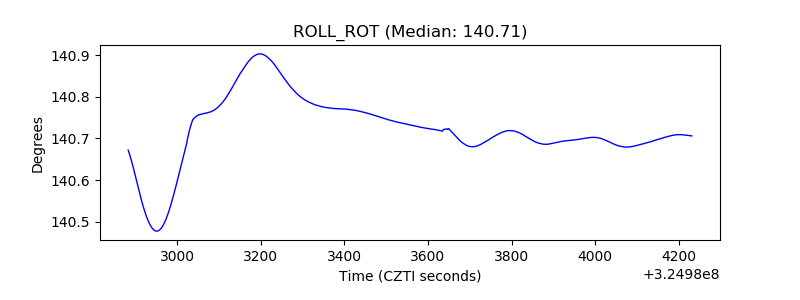 |
| _Roll_DEC | 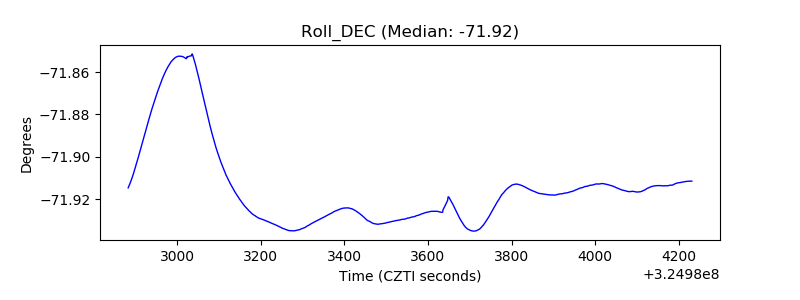 |
| _Roll_RA | 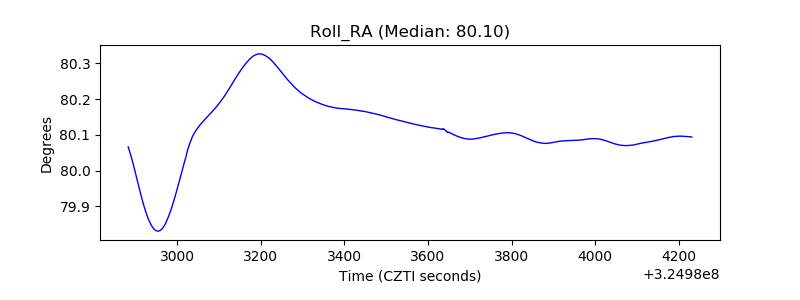 |
| Veto Counter | 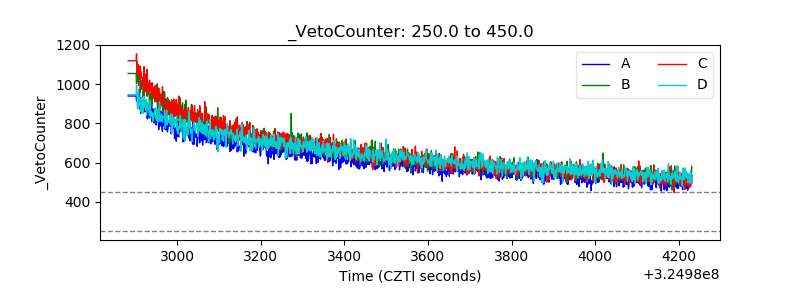 |