| Param | Original file | Final file |
|---|---|---|
| Filename | modeM0/AS1T03_191T01_9000003618_24649cztM0_level2.evt | modeM0/AS1T03_191T01_9000003618_24649cztM0_level2_quad_clean.evt |
| Size (bytes) | 528,439,680 | 141,791,040 |
| Size | 504.0 MB | 135.2 MB |
| Events in quadrant A | 3,354,618 | 1,000,426 |
| Events in quadrant B | 3,507,515 | 997,767 |
| Events in quadrant C | 5,247,763 | 912,360 |
| Events in quadrant D | 3,467,183 | 944,711 |
| Mode M9 | |||
|---|---|---|---|
| Quadrant | BADHDUFLAG | Total packets | Discarded packets |
| A | 0 | 12 | 0 |
| B | 0 | 12 | 0 |
| C | 0 | 12 | 0 |
| D | 0 | 12 | 0 |
| Mode M0 | |||
|---|---|---|---|
| Quadrant | BADHDUFLAG | Total packets | Discarded packets |
| A | 0 | 14005 | 1 |
| B | 0 | 14392 | 1 |
| C | 0 | 19859 | 1 |
| D | 0 | 14345 | 1 |
| Mode SS | |||
|---|---|---|---|
| Quadrant | BADHDUFLAG | Total packets | Discarded packets |
| A | 0 | 130 | 0 |
| B | 0 | 130 | 0 |
| C | 0 | 130 | 0 |
| D | 0 | 130 | 0 |
| Quadrant | Total seconds | Saturated seconds | Saturation percentage |
|---|---|---|---|
| A | 6290 | 73 | 1.160572% |
| B | 6290 | 102 | 1.621622% |
| C | 6290 | 408 | 6.486486% |
| D | 6291 | 61 | 0.969639% |
Noise dominated data is calculated using 1-second bins in cleaned event files. If a bin has >2000 counts, and if more than 50% of those come from <1% of pixels, then it is considered to be noise-dominated and hence unusable.
| Quadrant | # 1 sec bins | Bins with >0 counts | Bins with >2000 counts | High rate bins dominated by noise | Noise dominated (total time) | Noise dominated (detector-on time) | Marked lightcurve |
|---|---|---|---|---|---|---|---|
| A | 7560 | 6290 | 3 | 3 | 0.04% | 0.05% | 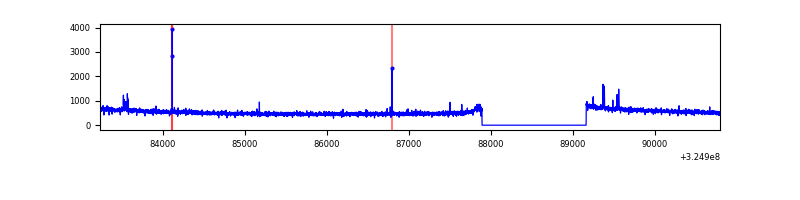 |
| B | 7560 | 6291 | 33 | 33 | 0.44% | 0.52% | 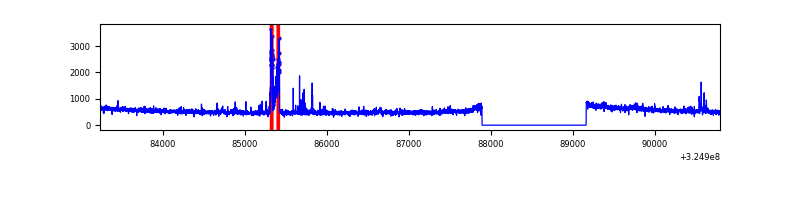 |
| C | 7560 | 6290 | 149 | 149 | 1.97% | 2.37% | 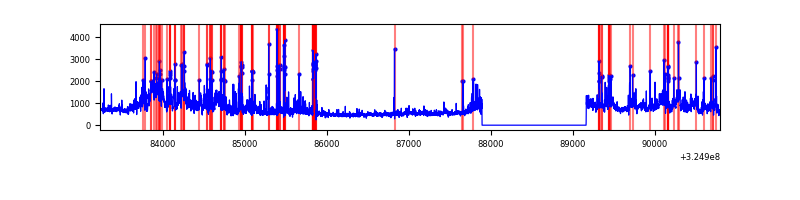 |
| D | 7561 | 6291 | 6 | 6 | 0.08% | 0.10% | 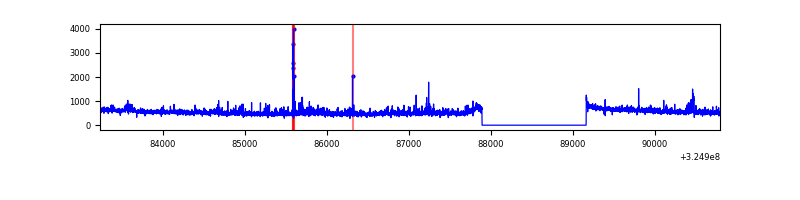 |
Top three noisy pixels from each quadrant. If the there are fewer than three noisy pixels in the level2.evt file, extra rows are filled as -1
| Pixel properties | Quadrant properties | ||||||
|---|---|---|---|---|---|---|---|
| Quadrant | DetID | PixID | Counts | Sigma | Mean | Median | Sigma |
| A | 6 | 16 | 38735 | 226.46 | 856 | 842 | 167.3 |
| A | 10 | 255 | 16042 | 90.84 | 856 | 842 | 167.3 |
| A | 13 | 254 | 10126 | 55.48 | 856 | 842 | 167.3 |
| B | 5 | 172 | 178927 | 1154.01 | 832 | 815 | 154.3 |
| B | 0 | 189 | 35053 | 221.83 | 832 | 815 | 154.3 |
| B | 0 | 190 | 24780 | 155.27 | 832 | 815 | 154.3 |
| C | 7 | 247 | 1560315 | 8691.38 | 786 | 794 | 179.4 |
| C | 10 | 9 | 310063 | 1723.59 | 786 | 794 | 179.4 |
| C | 14 | 238 | 129790 | 718.91 | 786 | 794 | 179.4 |
| D | 8 | 195 | 207093 | 1044.6 | 830 | 809 | 197.5 |
| D | 12 | 235 | 38442 | 190.57 | 830 | 809 | 197.5 |
| D | 9 | 1 | 28197 | 138.69 | 830 | 809 | 197.5 |
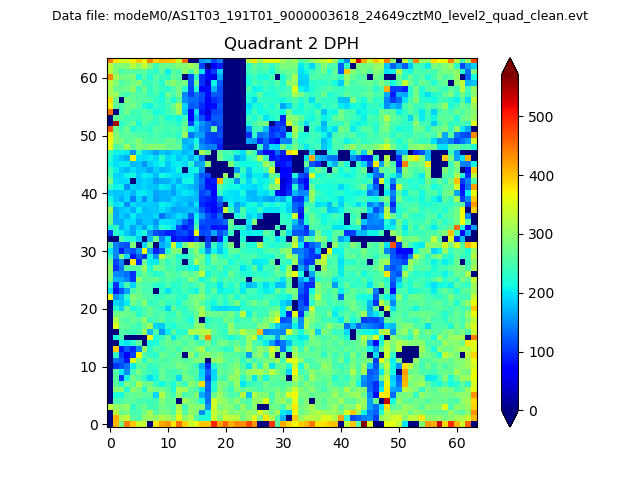
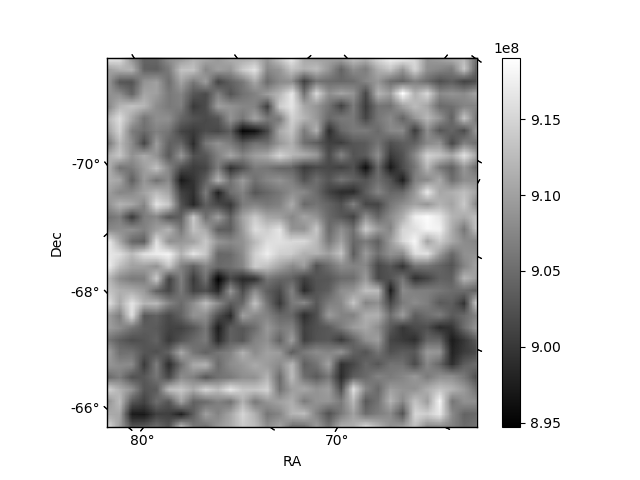
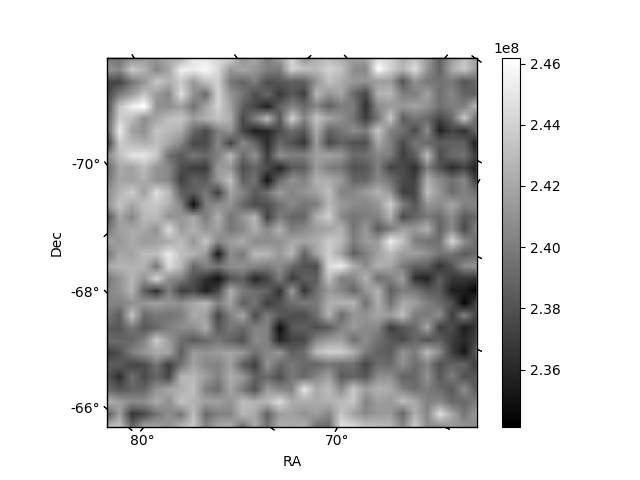
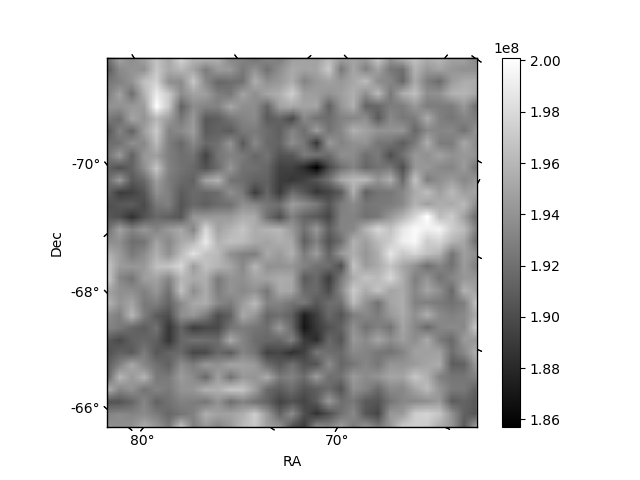
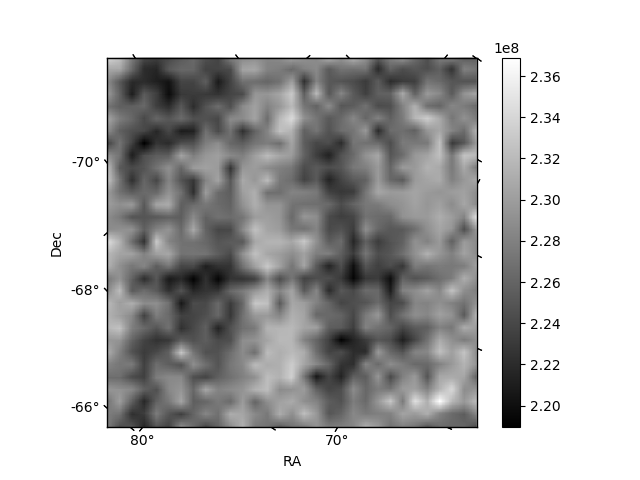
Histogram calculated using DETX and DETY for each event in the final _common_clean file
| Quadrant A | 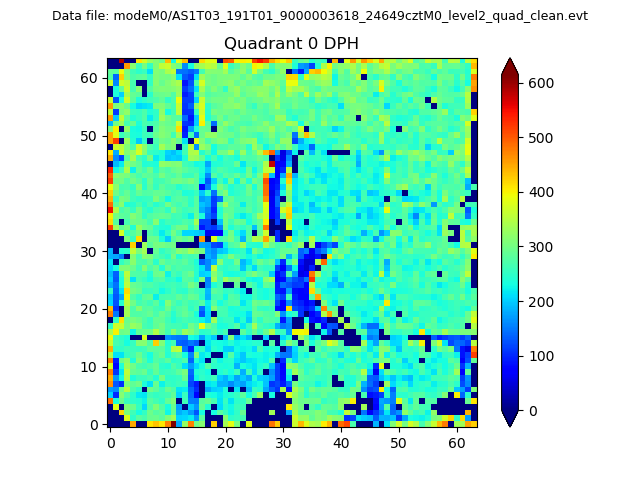 |
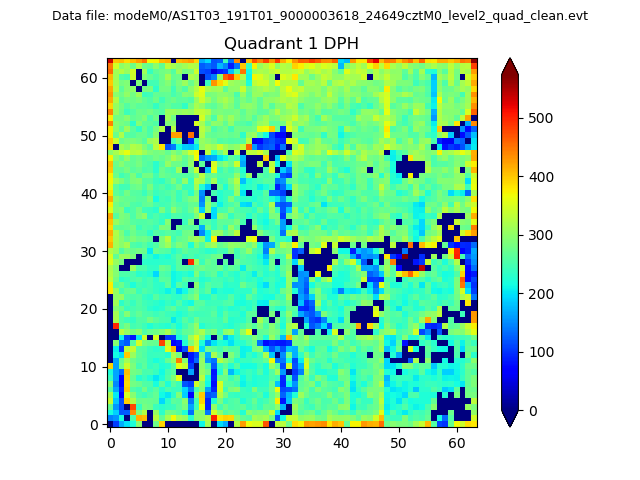 |
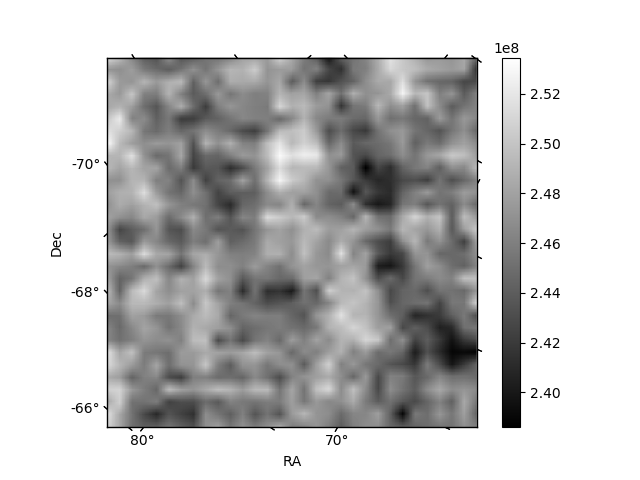
Quadrant B |
|---|---|---|---|
| Quadrant D | 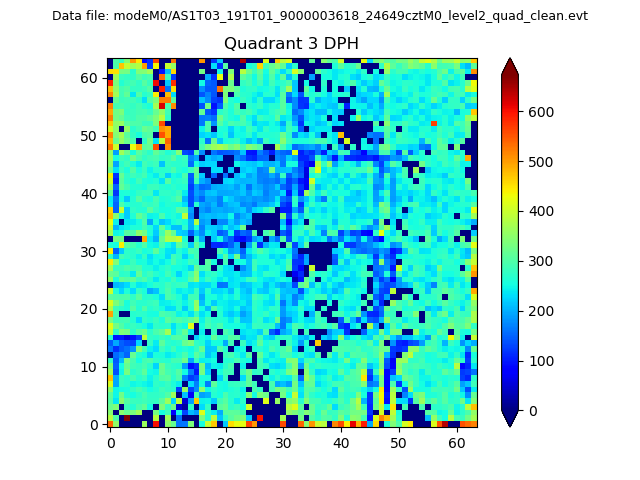 |
 |
Quadrant C |
| Plot type | Count rate plots | Images |
|---|---|---|
| Comparison with Poisson distribution Blue bars denote a histogram of data divided into 1 sec bins. Red curve is a Poisson curve with rate = median count rate of data. |
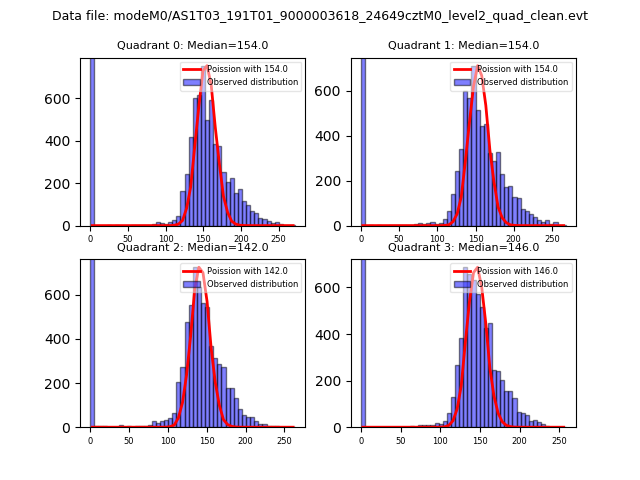 |
 |
| Quadrant-wise count rates Data is divided into 100 sec bins |
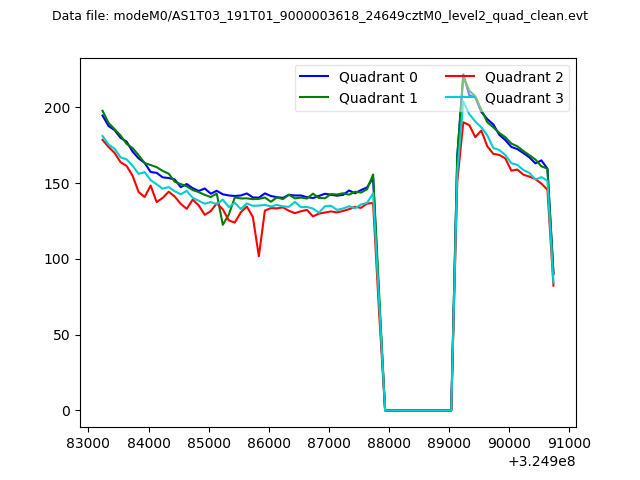 |
|
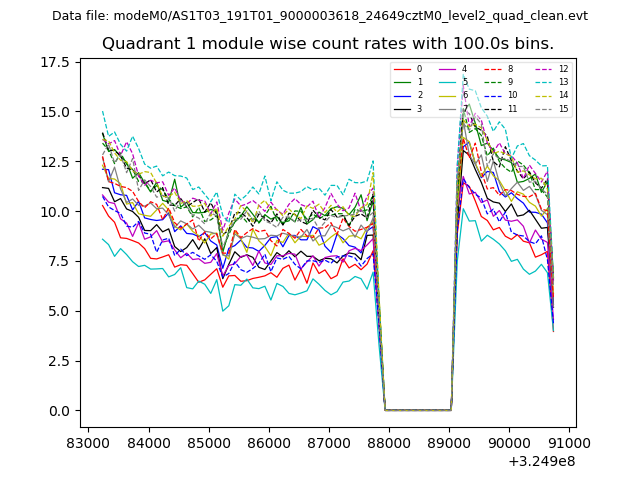
| Module-wise count rates for Quadrant A Data is divided into 100 sec bins |
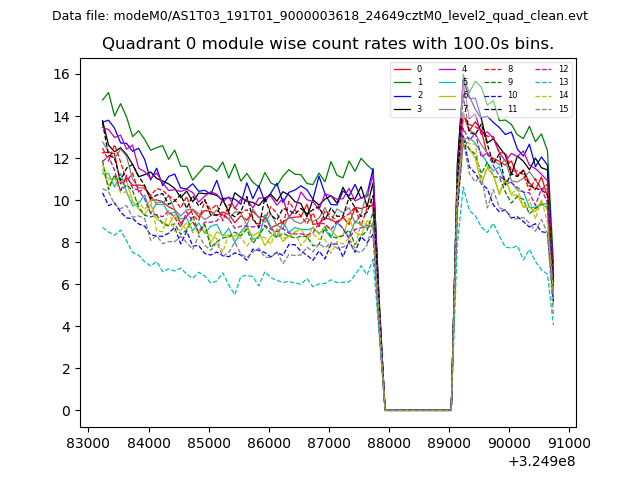 |
 |
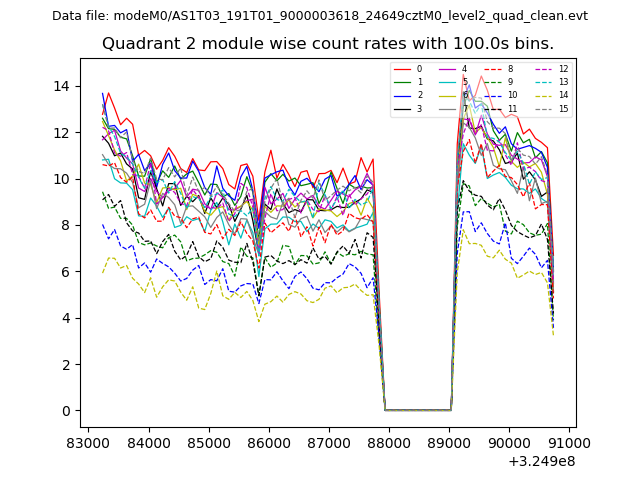
| Module-wise count rates for Quadrant B Data is divided into 100 sec bins |
 |
 |
| Module-wise count rates for Quadrant C Data is divided into 100 sec bins |
 |
 |
| Module-wise count rates for Quadrant D Data is divided into 100 sec bins |
 |
 |
| Parameter | Plot |
|---|---|
| CZT HV Monitor | 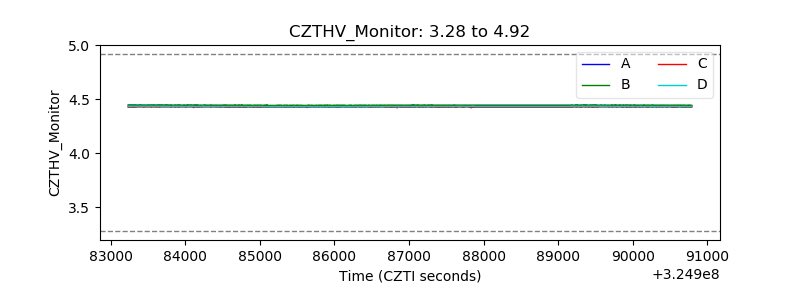 |
| D_VDD |  |
| Temperature 1 | 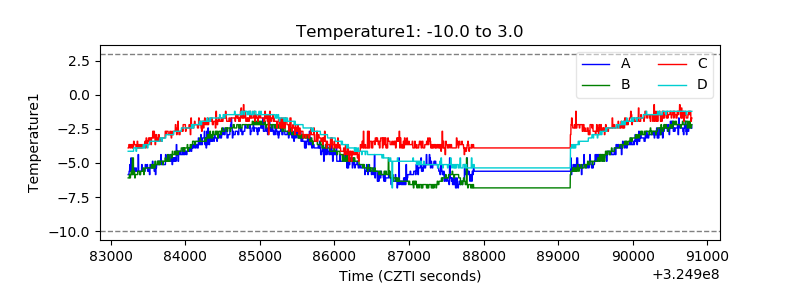 |
| Veto HV Monitor | 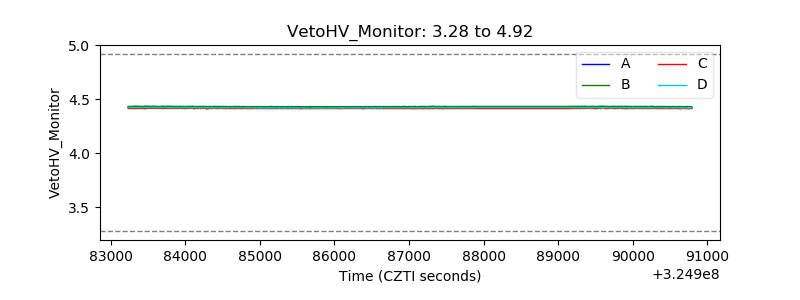 |
| Veto LLD |  |
| Alpha Counter | 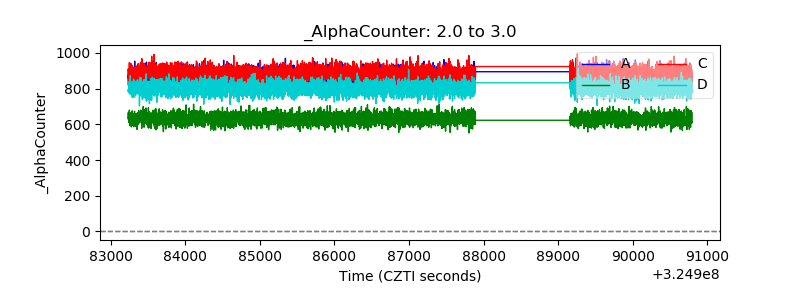 |
| _CPM_Rate | 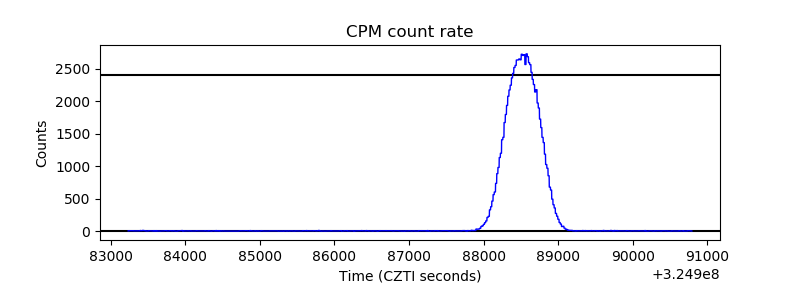 |
| CZT Counter | 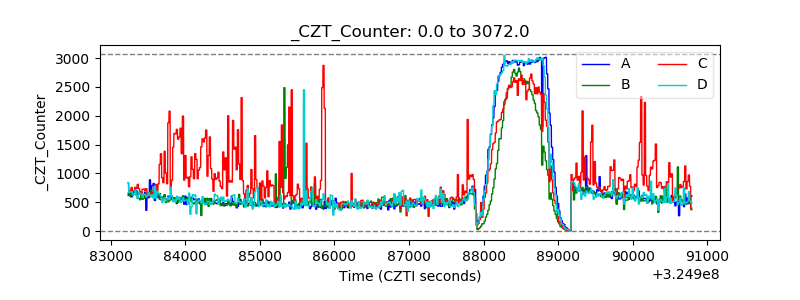 |
| +2.5 Volts monitor |  |
| +5 Volts monitor |  |
| _ROLL_ROT | 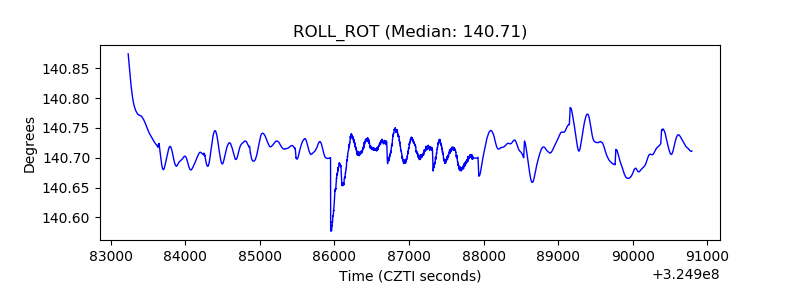 |
| _Roll_DEC | 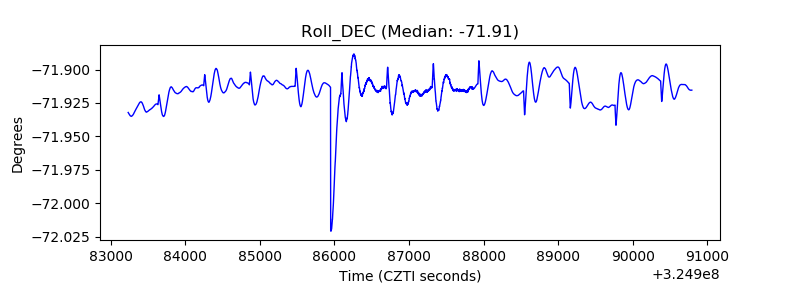 |
| _Roll_RA | 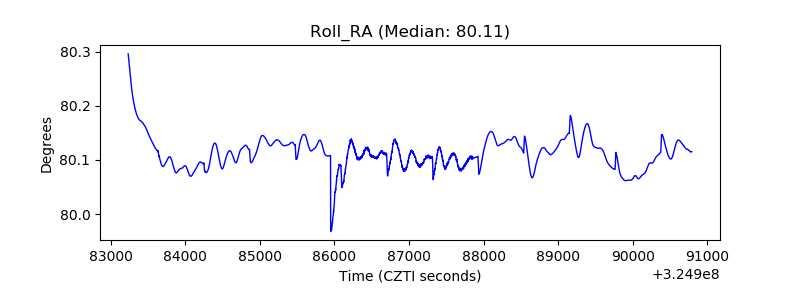 |
| Veto Counter |  |