| Param | Original file | Final file |
|---|---|---|
| Filename | modeM0/AS1T03_191T01_9000003618_24650cztM0_level2.evt | modeM0/AS1T03_191T01_9000003618_24650cztM0_level2_quad_clean.evt |
| Size (bytes) | 467,138,880 | 131,296,320 |
| Size | 445.5 MB | 125.2 MB |
| Events in quadrant A | 3,023,061 | 929,948 |
| Events in quadrant B | 3,108,702 | 923,198 |
| Events in quadrant C | 4,483,581 | 849,876 |
| Events in quadrant D | 3,139,989 | 869,964 |
| Mode M9 | |||
|---|---|---|---|
| Quadrant | BADHDUFLAG | Total packets | Discarded packets |
| A | 0 | 14 | 0 |
| B | 0 | 14 | 0 |
| C | 0 | 14 | 0 |
| D | 0 | 14 | 0 |
| Mode M0 | |||
|---|---|---|---|
| Quadrant | BADHDUFLAG | Total packets | Discarded packets |
| A | 0 | 12567 | 2 |
| B | 0 | 12839 | 1 |
| C | 0 | 17274 | 1 |
| D | 0 | 13044 | 1 |
| Mode SS | |||
|---|---|---|---|
| Quadrant | BADHDUFLAG | Total packets | Discarded packets |
| A | 0 | 116 | 0 |
| B | 0 | 116 | 0 |
| C | 0 | 116 | 0 |
| D | 0 | 116 | 0 |
| Quadrant | Total seconds | Saturated seconds | Saturation percentage |
|---|---|---|---|
| A | 5783 | 50 | 0.864603% |
| B | 5783 | 37 | 0.639806% |
| C | 5783 | 173 | 2.991527% |
| D | 5783 | 44 | 0.760851% |
Noise dominated data is calculated using 1-second bins in cleaned event files. If a bin has >2000 counts, and if more than 50% of those come from <1% of pixels, then it is considered to be noise-dominated and hence unusable.
| Quadrant | # 1 sec bins | Bins with >0 counts | Bins with >2000 counts | High rate bins dominated by noise | Noise dominated (total time) | Noise dominated (detector-on time) | Marked lightcurve |
|---|---|---|---|---|---|---|---|
| A | 7148 | 5784 | 0 | 0 | 0.00% | 0.00% | 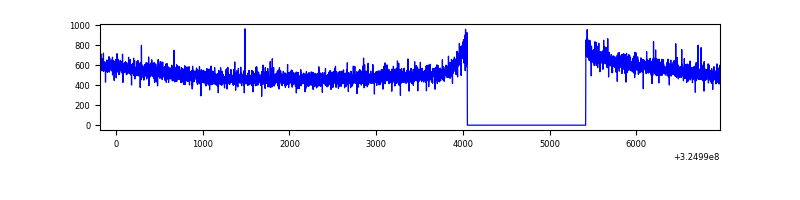 |
| B | 7148 | 5784 | 0 | 0 | 0.00% | 0.00% | 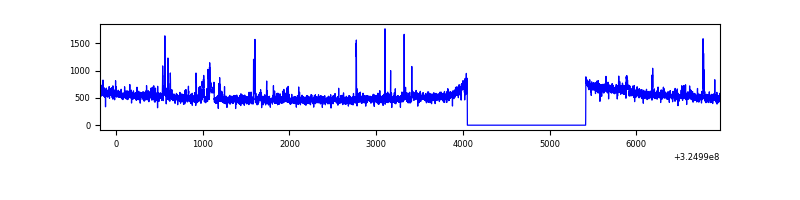 |
| C | 7148 | 5783 | 67 | 67 | 0.94% | 1.16% | 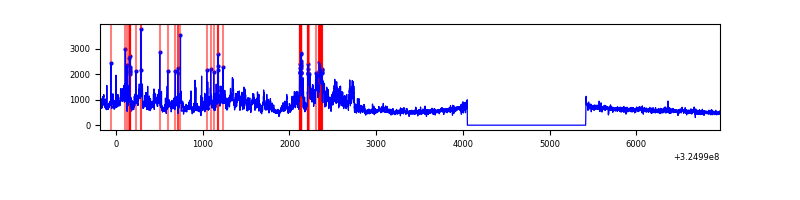 |
| D | 7148 | 5784 | 2 | 2 | 0.03% | 0.03% | 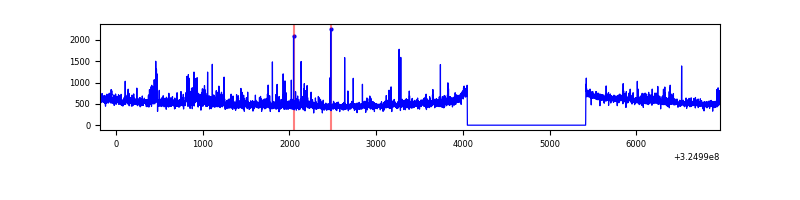 |
Top three noisy pixels from each quadrant. If the there are fewer than three noisy pixels in the level2.evt file, extra rows are filled as -1
| Pixel properties | Quadrant properties | ||||||
|---|---|---|---|---|---|---|---|
| Quadrant | DetID | PixID | Counts | Sigma | Mean | Median | Sigma |
| A | 13 | 254 | 9651 | 57.59 | 783 | 771 | 154.2 |
| A | 0 | 226 | 6870 | 39.56 | 783 | 771 | 154.2 |
| A | 3 | 137 | 6208 | 35.26 | 783 | 771 | 154.2 |
| B | 5 | 172 | 75295 | 528.18 | 760 | 743 | 141.1 |
| B | 0 | 190 | 19743 | 134.61 | 760 | 743 | 141.1 |
| B | 0 | 189 | 18487 | 125.71 | 760 | 743 | 141.1 |
| C | 7 | 247 | 1515058 | 9272.24 | 719 | 725 | 163.3 |
| C | 14 | 238 | 120214 | 731.63 | 719 | 725 | 163.3 |
| C | 3 | 233 | 16599 | 97.2 | 719 | 725 | 163.3 |
| D | 8 | 195 | 190772 | 1064.67 | 752 | 732 | 178.5 |
| D | 1 | 52 | 53935 | 298.06 | 752 | 732 | 178.5 |
| D | 12 | 235 | 27974 | 152.62 | 752 | 732 | 178.5 |
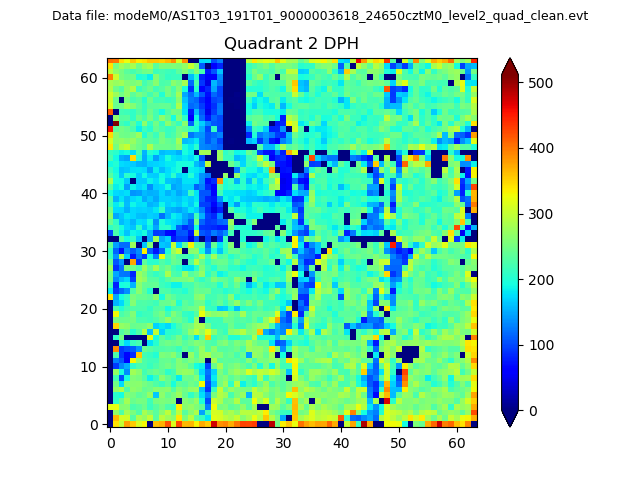
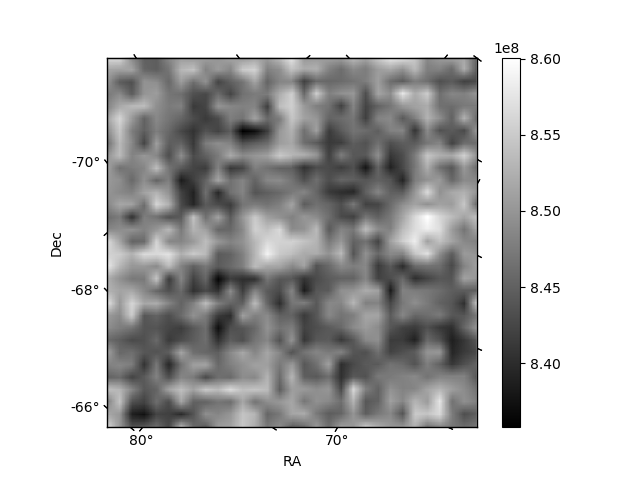
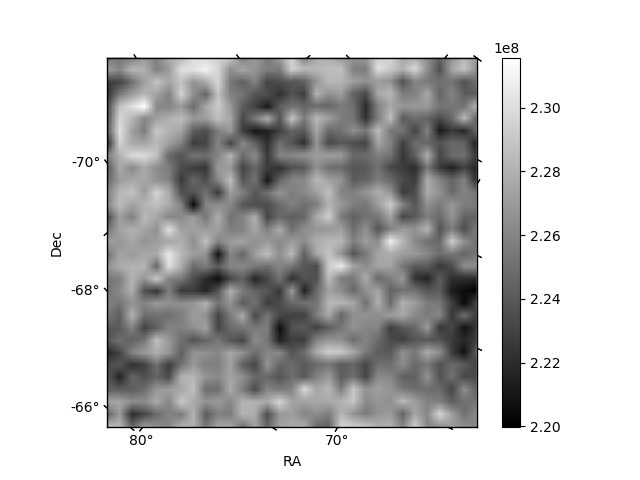
Histogram calculated using DETX and DETY for each event in the final _common_clean file
| Quadrant A | 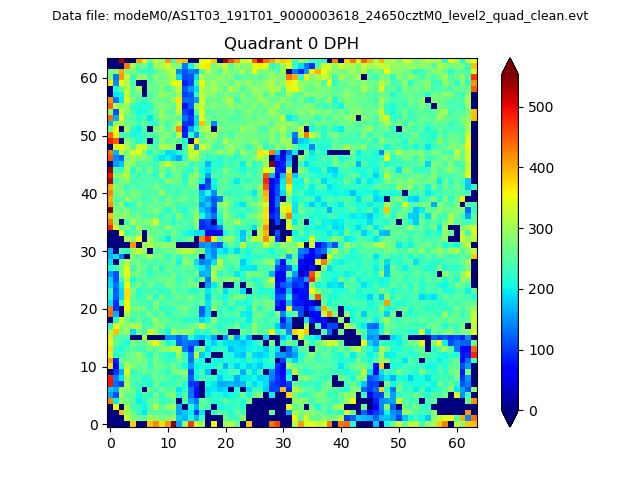 |
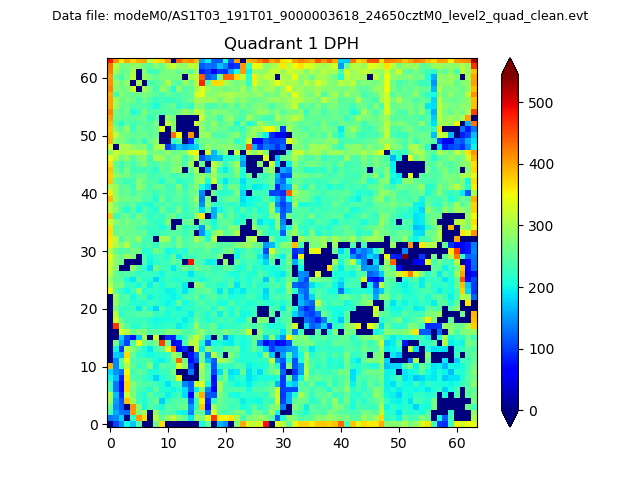 |
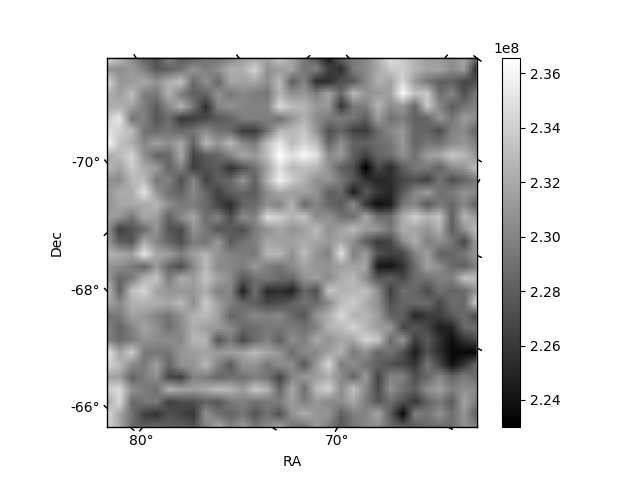
Quadrant B |
|---|---|---|---|
| Quadrant D | 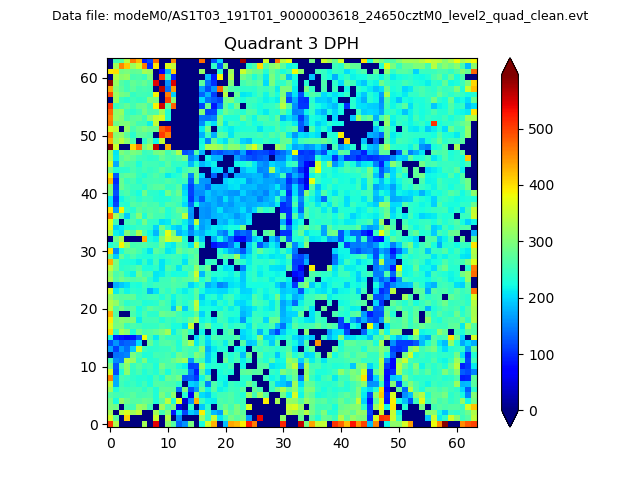 |
 |
Quadrant C |
| Plot type | Count rate plots | Images |
|---|---|---|
| Comparison with Poisson distribution Blue bars denote a histogram of data divided into 1 sec bins. Red curve is a Poisson curve with rate = median count rate of data. |
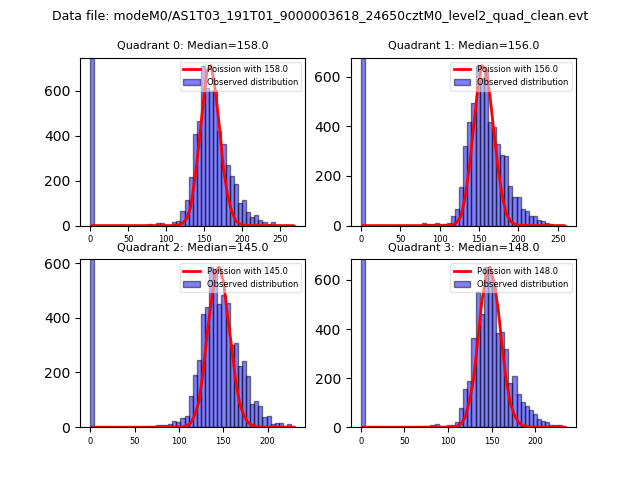 |
 |
| Quadrant-wise count rates Data is divided into 100 sec bins |
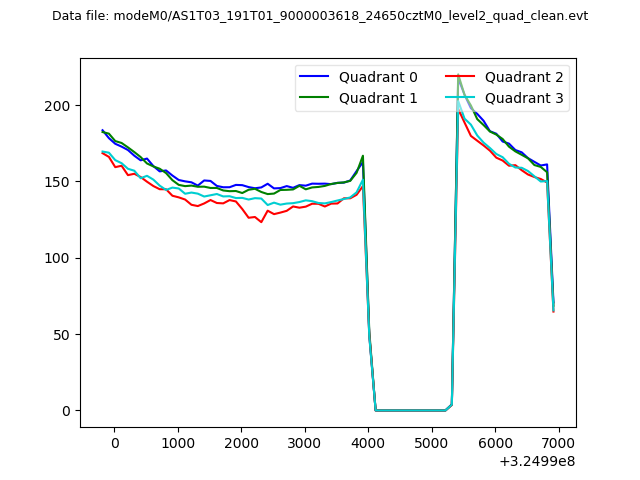 |
|
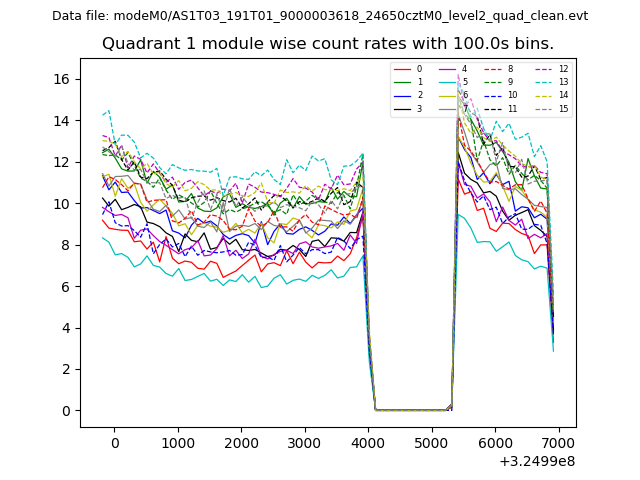
| Module-wise count rates for Quadrant A Data is divided into 100 sec bins |
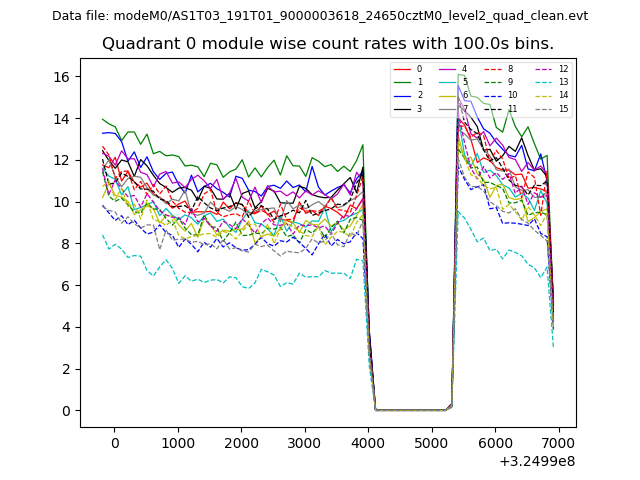 |
 |
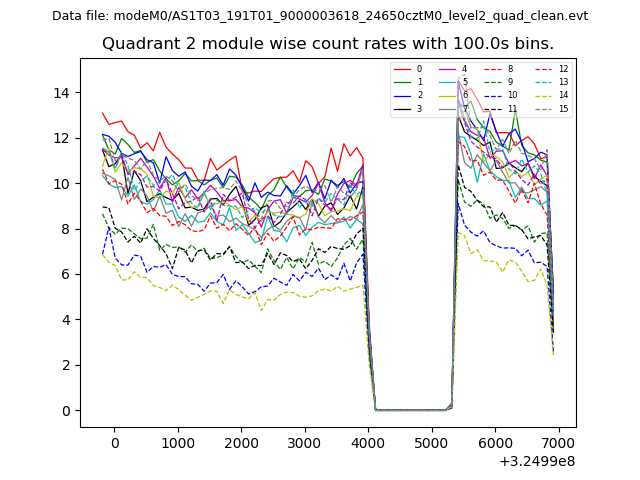
| Module-wise count rates for Quadrant B Data is divided into 100 sec bins |
 |
 |
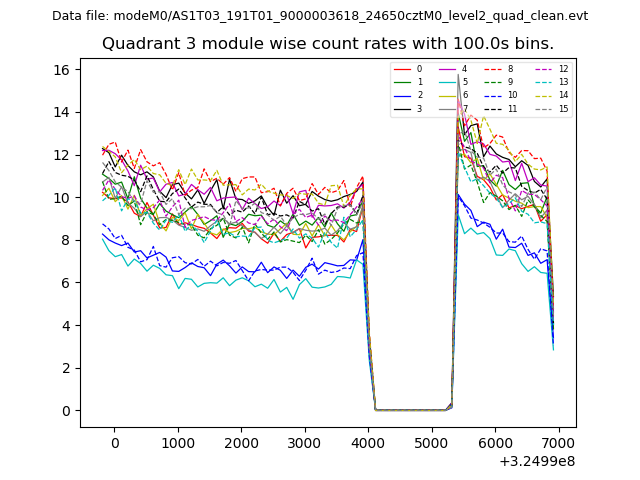
| Module-wise count rates for Quadrant C Data is divided into 100 sec bins |
 |
 |
| Module-wise count rates for Quadrant D Data is divided into 100 sec bins |
 |
 |
| Parameter | Plot |
|---|---|
| CZT HV Monitor | 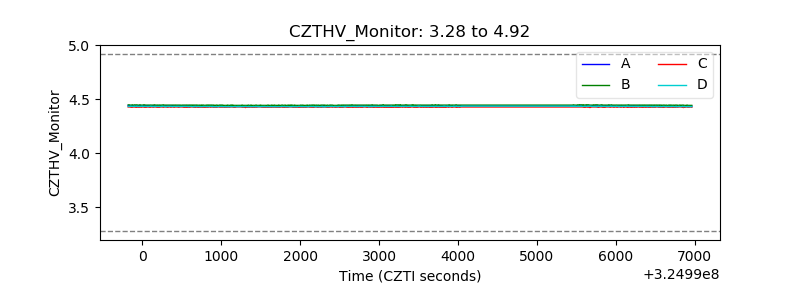 |
| D_VDD | 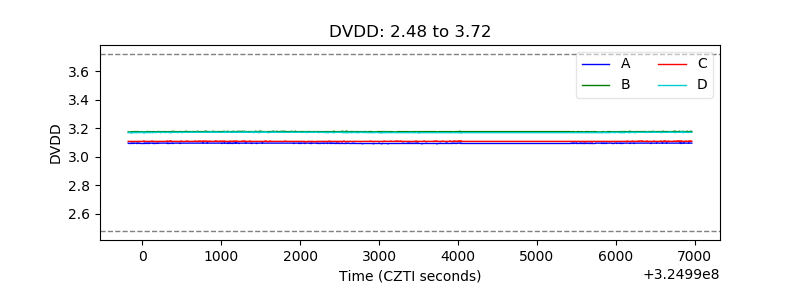 |
| Temperature 1 | 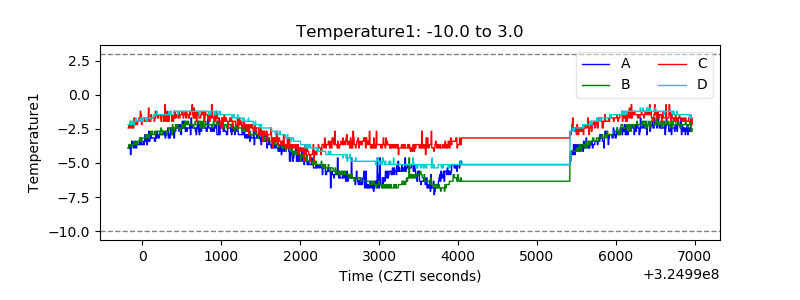 |
| Veto HV Monitor | 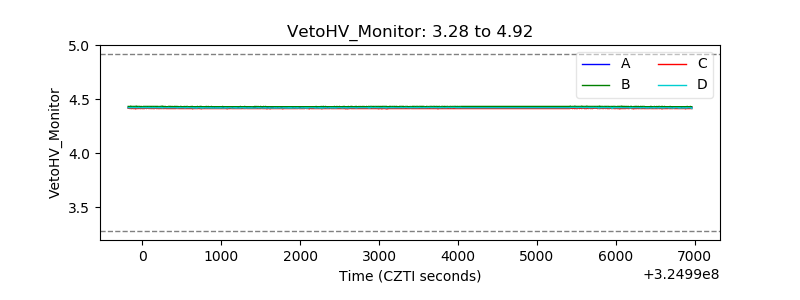 |
| Veto LLD |  |
| Alpha Counter | 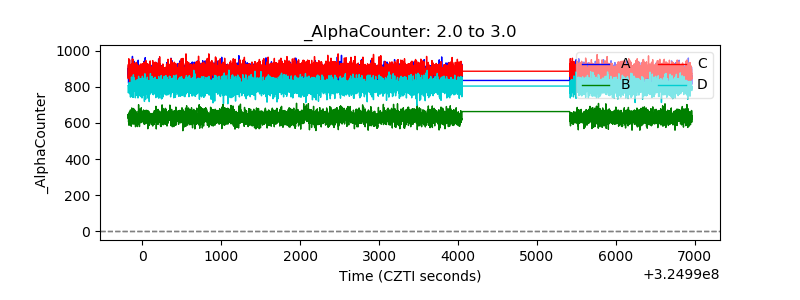 |
| _CPM_Rate | 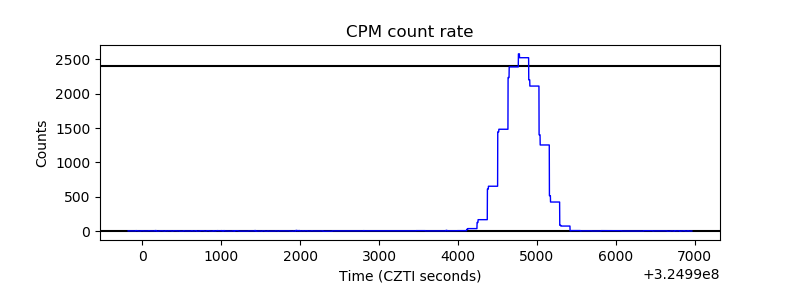 |
| CZT Counter | 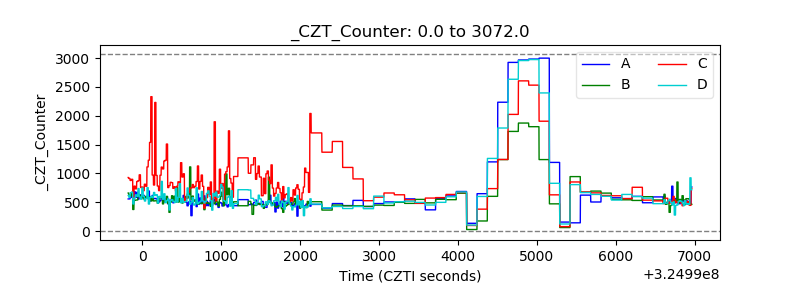 |
| +2.5 Volts monitor |  |
| +5 Volts monitor |  |
| _ROLL_ROT | 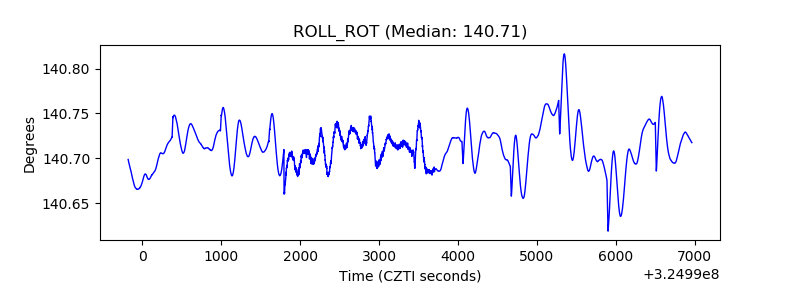 |
| _Roll_DEC | 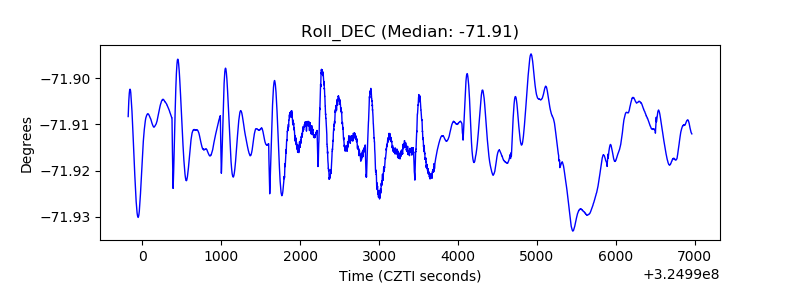 |
| _Roll_RA | 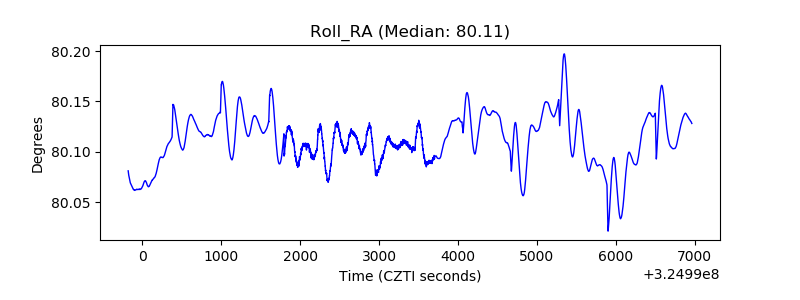 |
| Veto Counter | 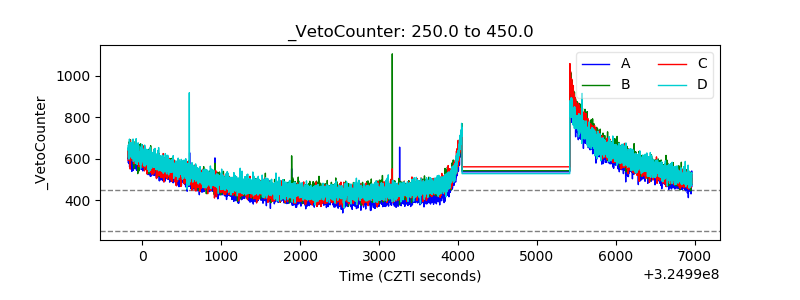 |