| Param | Original file | Final file |
|---|---|---|
| Filename | modeM0/AS1T03_191T01_9000003618_24651cztM0_level2.evt | modeM0/AS1T03_191T01_9000003618_24651cztM0_level2_quad_clean.evt |
| Size (bytes) | 438,382,080 | 133,888,320 |
| Size | 418.1 MB | 127.7 MB |
| Events in quadrant A | 3,096,685 | 944,824 |
| Events in quadrant B | 3,286,101 | 933,140 |
| Events in quadrant C | 3,217,866 | 874,525 |
| Events in quadrant D | 3,267,622 | 883,304 |
| Mode M9 | |||
|---|---|---|---|
| Quadrant | BADHDUFLAG | Total packets | Discarded packets |
| A | 0 | 13 | 0 |
| B | 0 | 13 | 0 |
| C | 0 | 13 | 0 |
| D | 0 | 13 | 0 |
| Mode M0 | |||
|---|---|---|---|
| Quadrant | BADHDUFLAG | Total packets | Discarded packets |
| A | 0 | 12848 | 2 |
| B | 0 | 13499 | 1 |
| C | 0 | 13385 | 1 |
| D | 0 | 13624 | 1 |
| Mode SS | |||
|---|---|---|---|
| Quadrant | BADHDUFLAG | Total packets | Discarded packets |
| A | 0 | 122 | 0 |
| B | 0 | 122 | 0 |
| C | 0 | 122 | 0 |
| D | 0 | 122 | 0 |
| Quadrant | Total seconds | Saturated seconds | Saturation percentage |
|---|---|---|---|
| A | 6007 | 61 | 1.015482% |
| B | 6008 | 85 | 1.414780% |
| C | 6008 | 98 | 1.631158% |
| D | 6008 | 64 | 1.065246% |
Noise dominated data is calculated using 1-second bins in cleaned event files. If a bin has >2000 counts, and if more than 50% of those come from <1% of pixels, then it is considered to be noise-dominated and hence unusable.
| Quadrant | # 1 sec bins | Bins with >0 counts | Bins with >2000 counts | High rate bins dominated by noise | Noise dominated (total time) | Noise dominated (detector-on time) | Marked lightcurve |
|---|---|---|---|---|---|---|---|
| A | 7347 | 6008 | 0 | 0 | 0.00% | 0.00% | 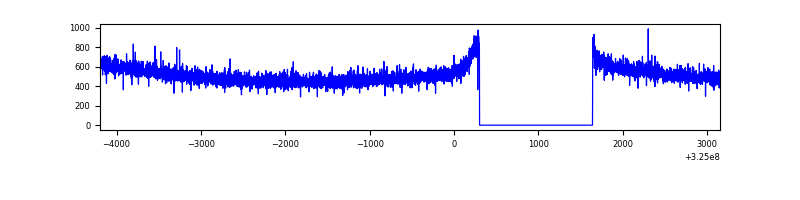 |
| B | 7348 | 6009 | 31 | 31 | 0.42% | 0.52% | 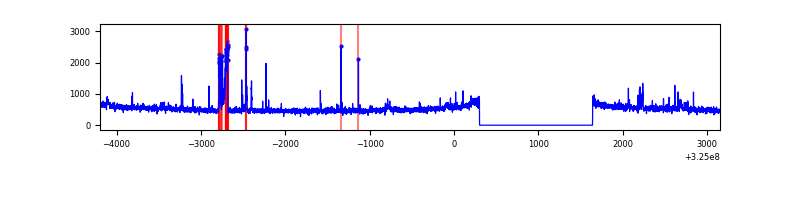 |
| C | 7348 | 6009 | 3 | 3 | 0.04% | 0.05% | 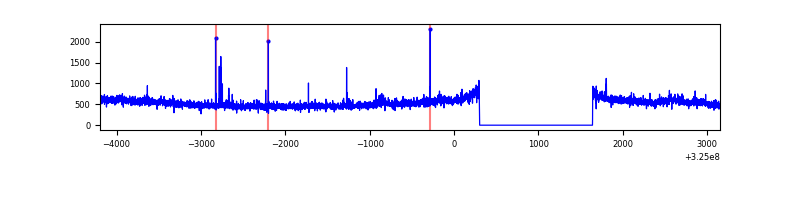 |
| D | 7348 | 6009 | 14 | 14 | 0.19% | 0.23% | 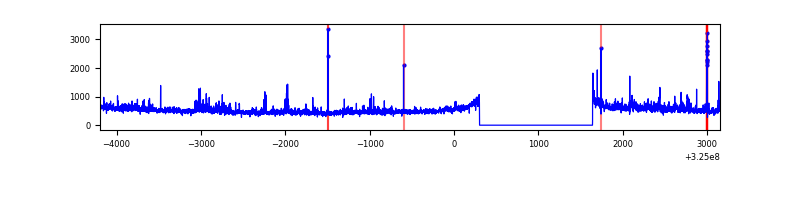 |
Top three noisy pixels from each quadrant. If the there are fewer than three noisy pixels in the level2.evt file, extra rows are filled as -1
| Pixel properties | Quadrant properties | ||||||
|---|---|---|---|---|---|---|---|
| Quadrant | DetID | PixID | Counts | Sigma | Mean | Median | Sigma |
| A | 13 | 254 | 10697 | 61.89 | 802 | 788 | 160.1 |
| A | 0 | 226 | 7054 | 39.14 | 802 | 788 | 160.1 |
| A | 3 | 137 | 6539 | 35.92 | 802 | 788 | 160.1 |
| B | 5 | 172 | 179361 | 1237.81 | 778 | 761 | 144.3 |
| B | 0 | 190 | 28603 | 192.96 | 778 | 761 | 144.3 |
| B | 0 | 189 | 18255 | 121.24 | 778 | 761 | 144.3 |
| C | 7 | 247 | 155685 | 921.14 | 737 | 743 | 168.2 |
| C | 14 | 238 | 124480 | 735.63 | 737 | 743 | 168.2 |
| C | 2 | 16 | 32169 | 186.83 | 737 | 743 | 168.2 |
| D | 8 | 195 | 215020 | 1176.17 | 767 | 746 | 182.2 |
| D | 12 | 235 | 53657 | 290.43 | 767 | 746 | 182.2 |
| D | 1 | 52 | 37719 | 202.95 | 767 | 746 | 182.2 |
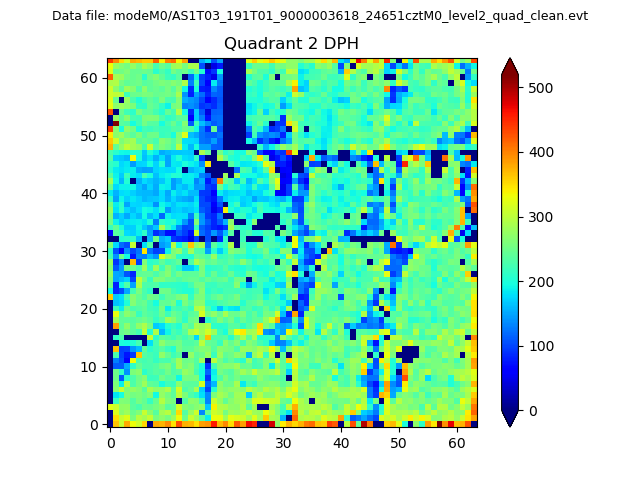
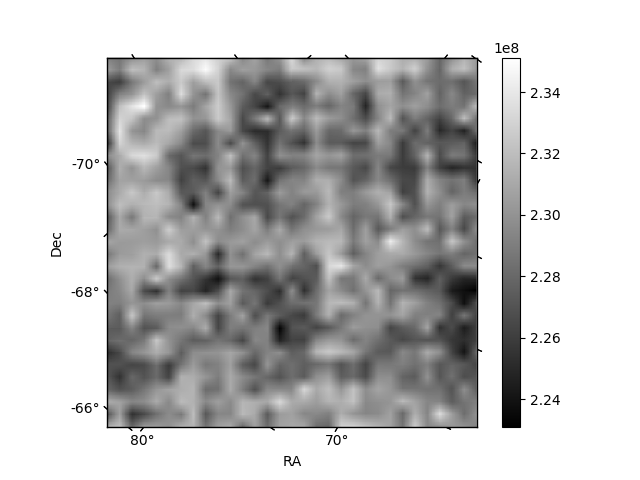
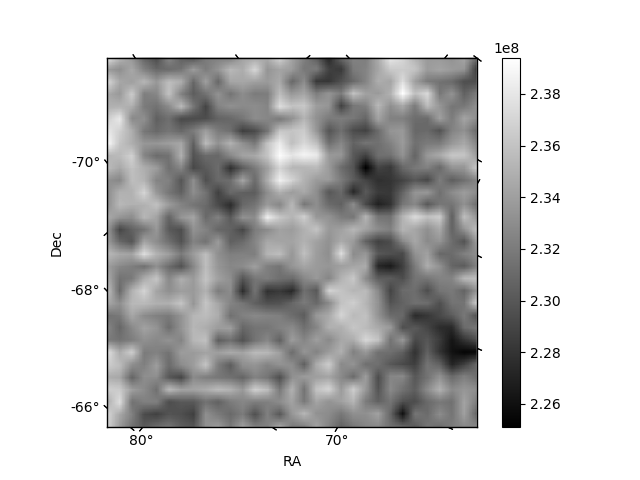
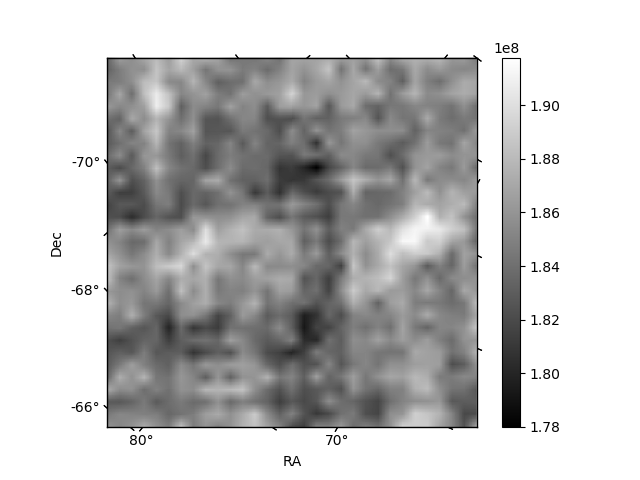
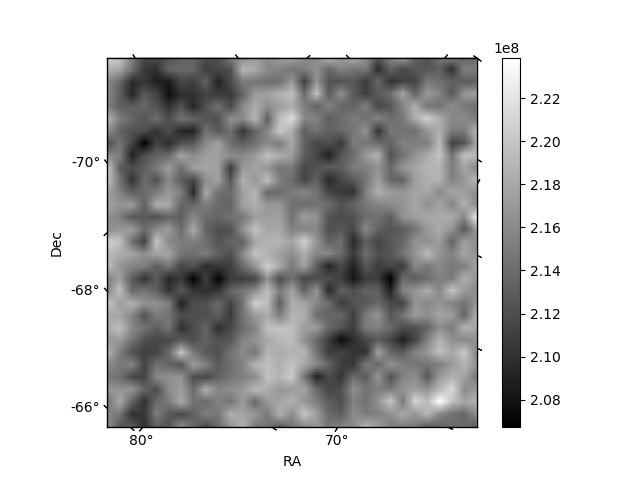
Histogram calculated using DETX and DETY for each event in the final _common_clean file
| Quadrant A | 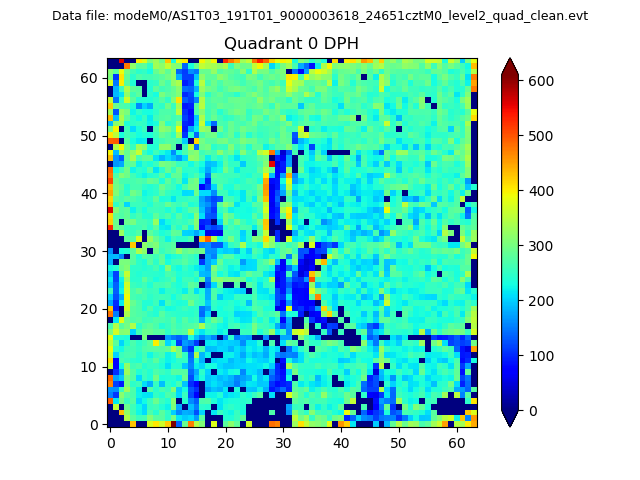 |
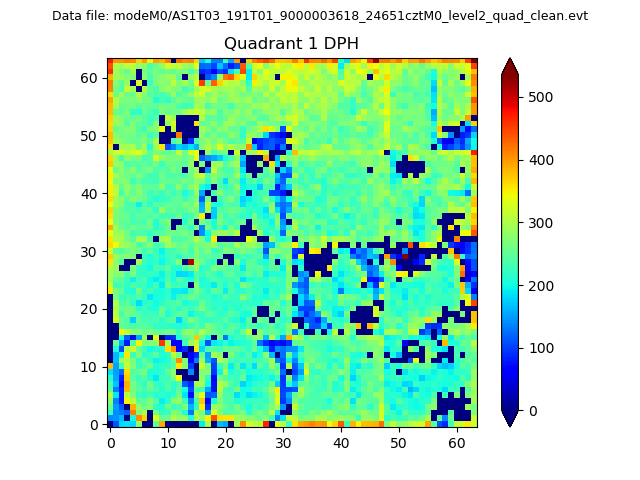 |
Quadrant B |
|---|---|---|---|
| Quadrant D | 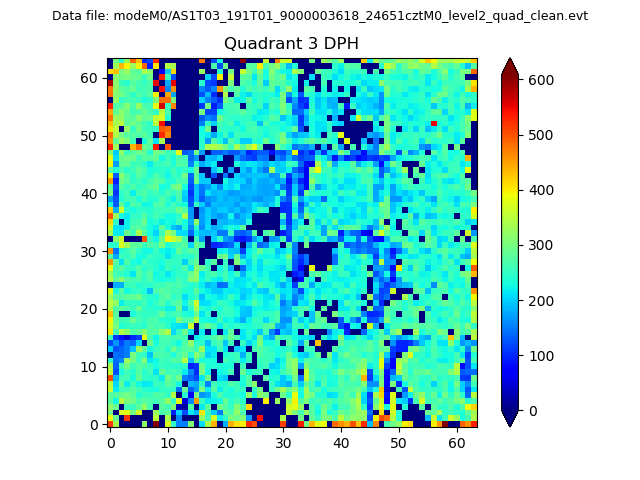 |
 |
Quadrant C |
| Plot type | Count rate plots | Images |
|---|---|---|
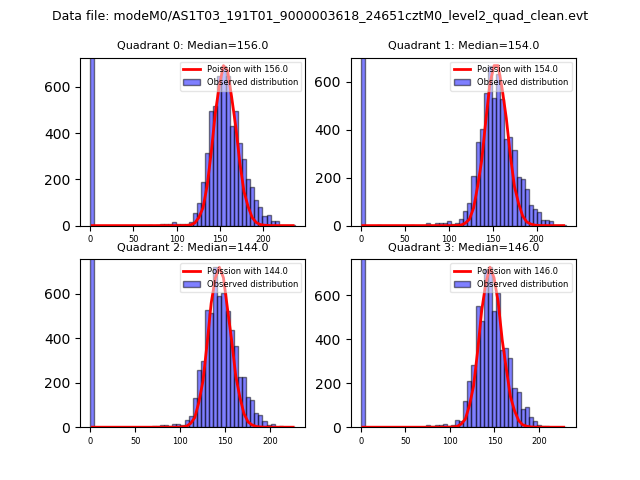
| Comparison with Poisson distribution Blue bars denote a histogram of data divided into 1 sec bins. Red curve is a Poisson curve with rate = median count rate of data. |
 |
 |
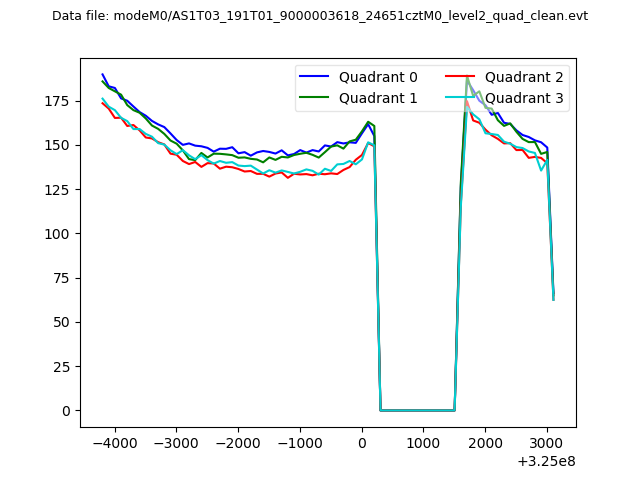
| Quadrant-wise count rates Data is divided into 100 sec bins |
 |
|
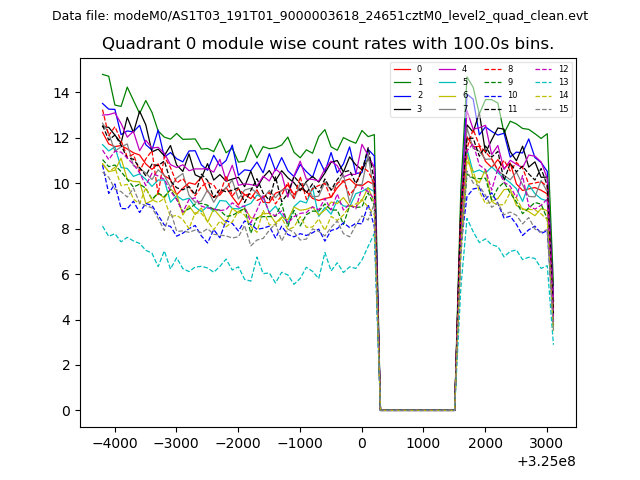
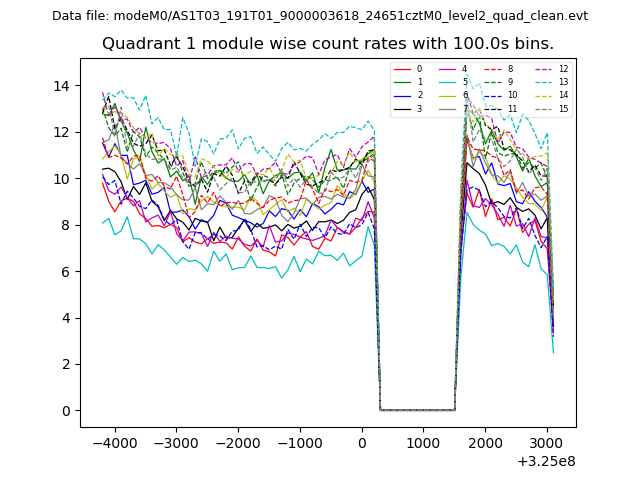
| Module-wise count rates for Quadrant A Data is divided into 100 sec bins |
 |
 |
| Module-wise count rates for Quadrant B Data is divided into 100 sec bins |
 |
 |
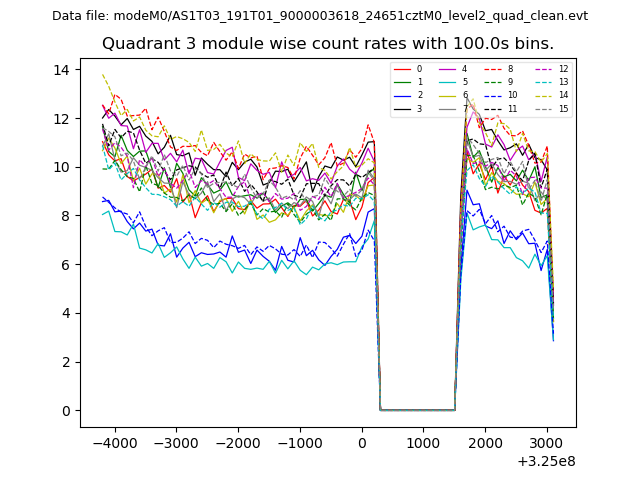
| Module-wise count rates for Quadrant C Data is divided into 100 sec bins |
 |
 |
| Module-wise count rates for Quadrant D Data is divided into 100 sec bins |
 |
 |
| Parameter | Plot |
|---|---|
| CZT HV Monitor | 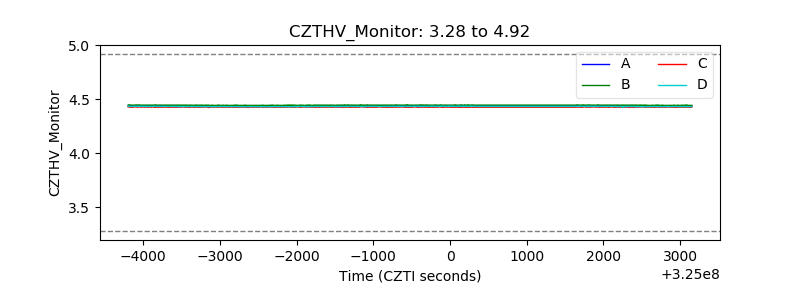 |
| D_VDD | 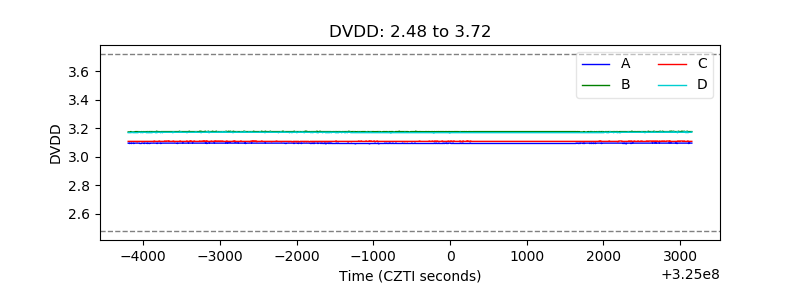 |
| Temperature 1 |  |
| Veto HV Monitor | 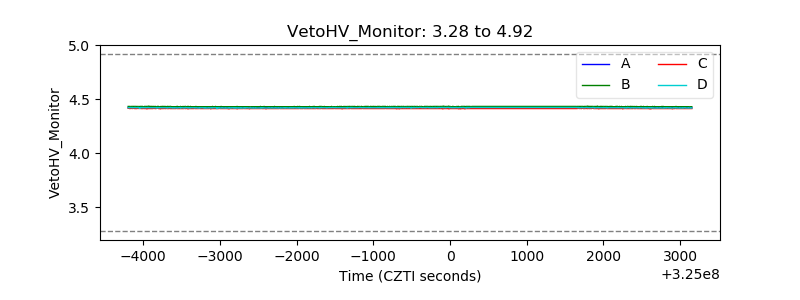 |
| Veto LLD | 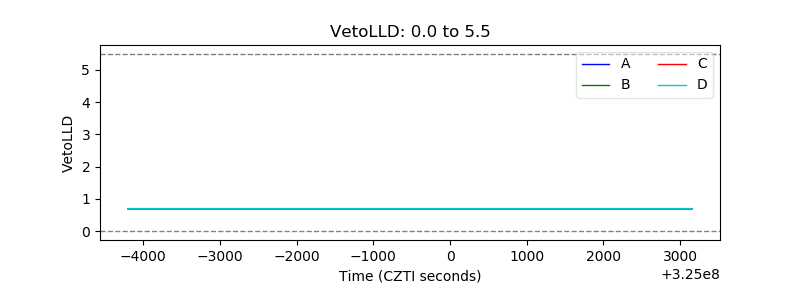 |
| Alpha Counter | 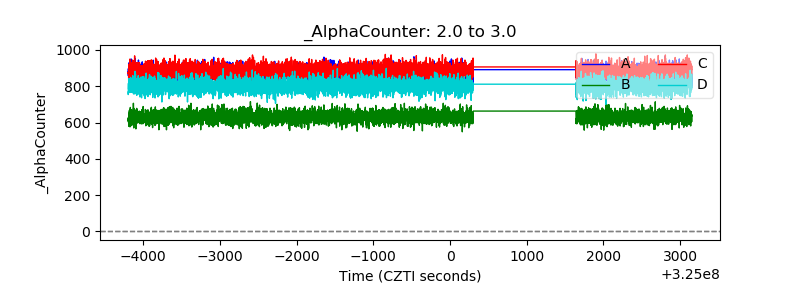 |
| _CPM_Rate | 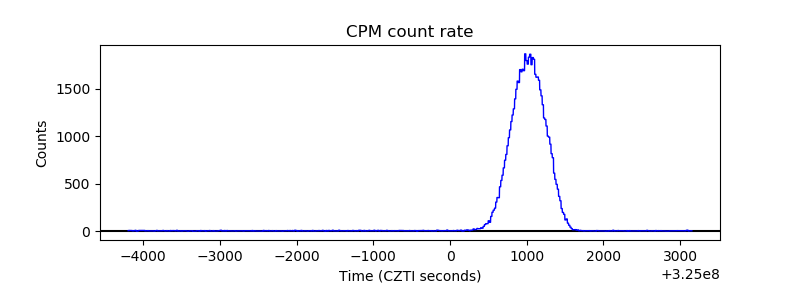 |
| CZT Counter | 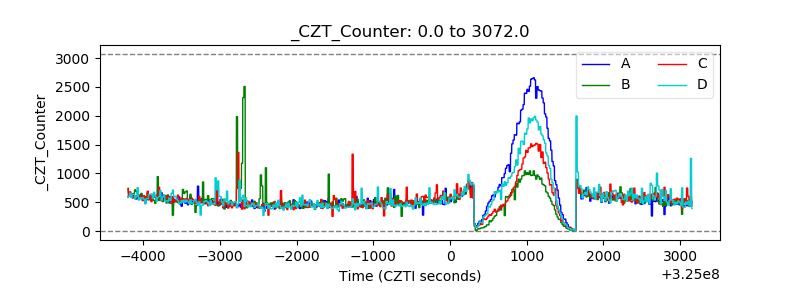 |
| +2.5 Volts monitor |  |
| +5 Volts monitor | 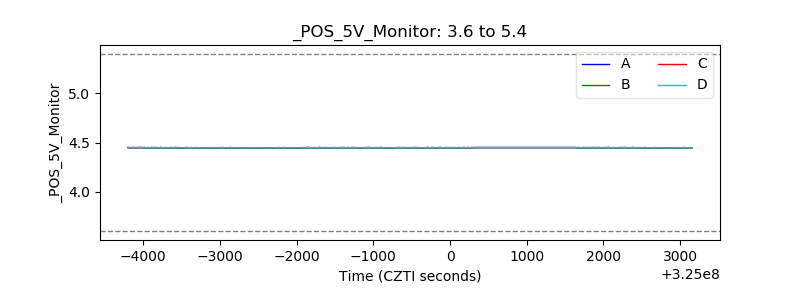 |
| _ROLL_ROT | 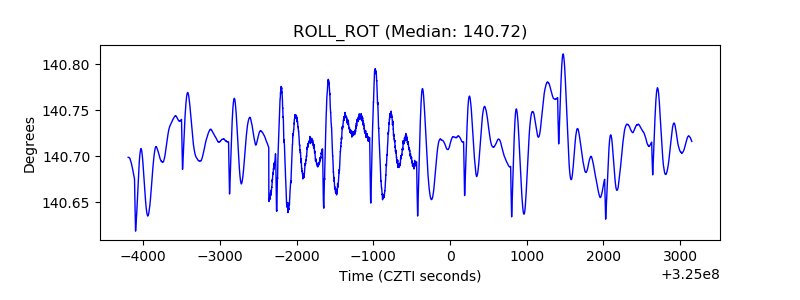 |
| _Roll_DEC | 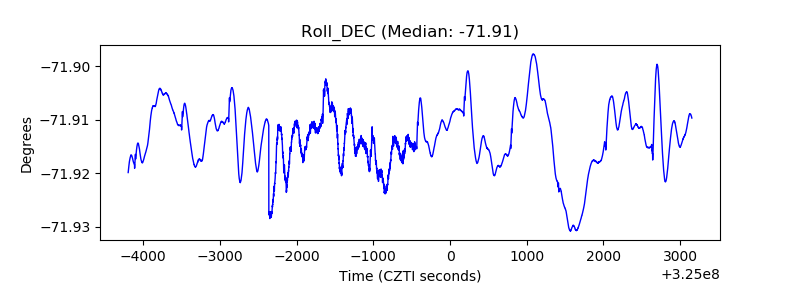 |
| _Roll_RA | 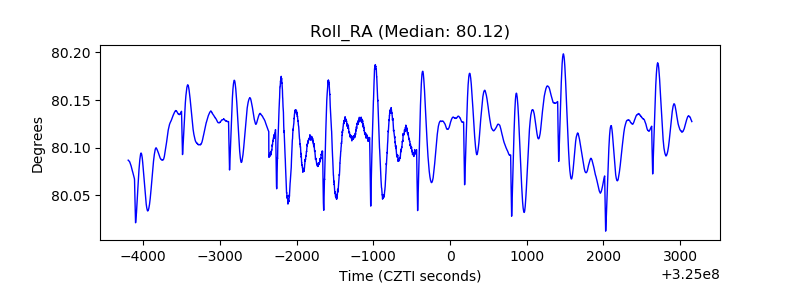 |
| Veto Counter |  |