| Param | Original file | Final file |
|---|---|---|
| Filename | modeM0/AS1T03_191T01_9000003618_24652cztM0_level2.evt | modeM0/AS1T03_191T01_9000003618_24652cztM0_level2_quad_clean.evt |
| Size (bytes) | 447,744,960 | 133,188,480 |
| Size | 427.0 MB | 127.0 MB |
| Events in quadrant A | 3,131,247 | 933,010 |
| Events in quadrant B | 3,225,617 | 924,043 |
| Events in quadrant C | 3,272,750 | 866,530 |
| Events in quadrant D | 3,502,731 | 871,581 |
| Mode M9 | |||
|---|---|---|---|
| Quadrant | BADHDUFLAG | Total packets | Discarded packets |
| A | 0 | 12 | 0 |
| B | 0 | 12 | 0 |
| C | 0 | 12 | 0 |
| D | 0 | 12 | 0 |
| Mode M0 | |||
|---|---|---|---|
| Quadrant | BADHDUFLAG | Total packets | Discarded packets |
| A | 0 | 13181 | 1 |
| B | 0 | 13555 | 1 |
| C | 0 | 13656 | 1 |
| D | 0 | 14523 | 1 |
| Mode SS | |||
|---|---|---|---|
| Quadrant | BADHDUFLAG | Total packets | Discarded packets |
| A | 0 | 128 | 0 |
| B | 0 | 128 | 0 |
| C | 0 | 128 | 0 |
| D | 0 | 128 | 0 |
| Quadrant | Total seconds | Saturated seconds | Saturation percentage |
|---|---|---|---|
| A | 6291 | 99 | 1.573677% |
| B | 6291 | 113 | 1.796217% |
| C | 6291 | 120 | 1.907487% |
| D | 6291 | 83 | 1.319345% |
Noise dominated data is calculated using 1-second bins in cleaned event files. If a bin has >2000 counts, and if more than 50% of those come from <1% of pixels, then it is considered to be noise-dominated and hence unusable.
| Quadrant | # 1 sec bins | Bins with >0 counts | Bins with >2000 counts | High rate bins dominated by noise | Noise dominated (total time) | Noise dominated (detector-on time) | Marked lightcurve |
|---|---|---|---|---|---|---|---|
| A | 7476 | 6291 | 0 | 0 | 0.00% | 0.00% |  |
| B | 7476 | 6292 | 3 | 3 | 0.04% | 0.05% |  |
| C | 7476 | 6291 | 3 | 3 | 0.04% | 0.05% |  |
| D | 7476 | 6292 | 18 | 18 | 0.24% | 0.29% |  |
Top three noisy pixels from each quadrant. If the there are fewer than three noisy pixels in the level2.evt file, extra rows are filled as -1
| Pixel properties | Quadrant properties | ||||||
|---|---|---|---|---|---|---|---|
| Quadrant | DetID | PixID | Counts | Sigma | Mean | Median | Sigma |
| A | 13 | 254 | 10769 | 61.81 | 811 | 797 | 161.3 |
| A | 0 | 226 | 7063 | 38.84 | 811 | 797 | 161.3 |
| A | 3 | 137 | 6993 | 38.41 | 811 | 797 | 161.3 |
| B | 5 | 172 | 66570 | 442.57 | 792 | 772 | 148.7 |
| B | 0 | 190 | 34624 | 227.69 | 792 | 772 | 148.7 |
| B | 12 | 111 | 17496 | 112.49 | 792 | 772 | 148.7 |
| C | 7 | 247 | 176251 | 1021.64 | 750 | 756 | 171.8 |
| C | 14 | 238 | 123367 | 713.78 | 750 | 756 | 171.8 |
| C | 2 | 16 | 26662 | 150.81 | 750 | 756 | 171.8 |
| D | 8 | 195 | 267182 | 1450.73 | 775 | 751 | 183.7 |
| D | 12 | 235 | 103870 | 561.49 | 775 | 751 | 183.7 |
| D | 1 | 52 | 80518 | 434.34 | 775 | 751 | 183.7 |
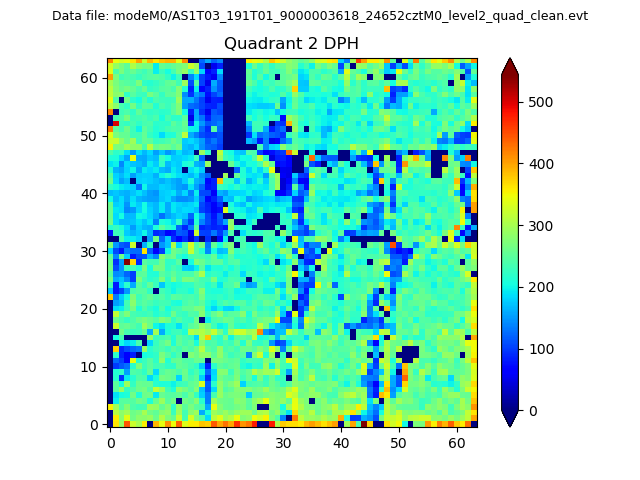
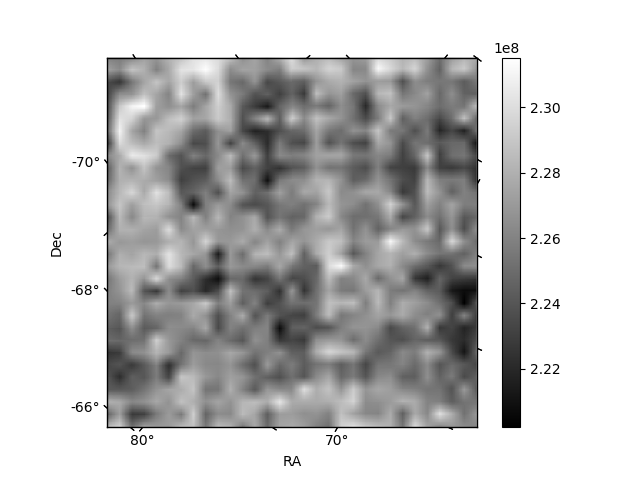
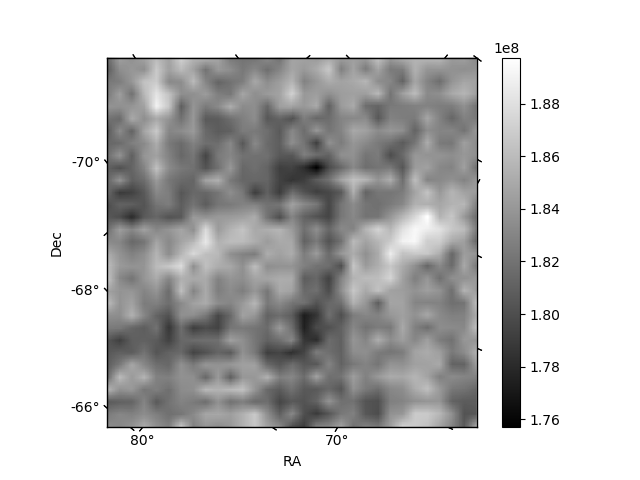
Histogram calculated using DETX and DETY for each event in the final _common_clean file
| Quadrant A | 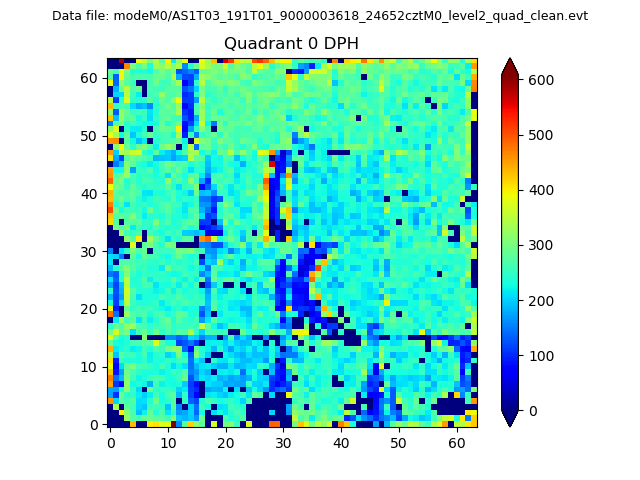 |
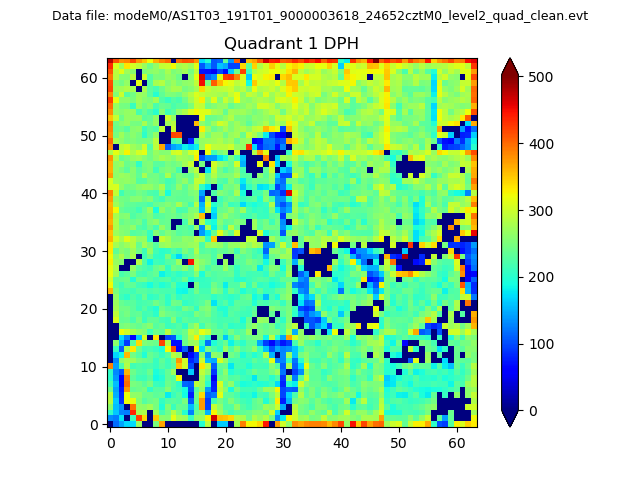 |
Quadrant B |
|---|---|---|---|
| Quadrant D | 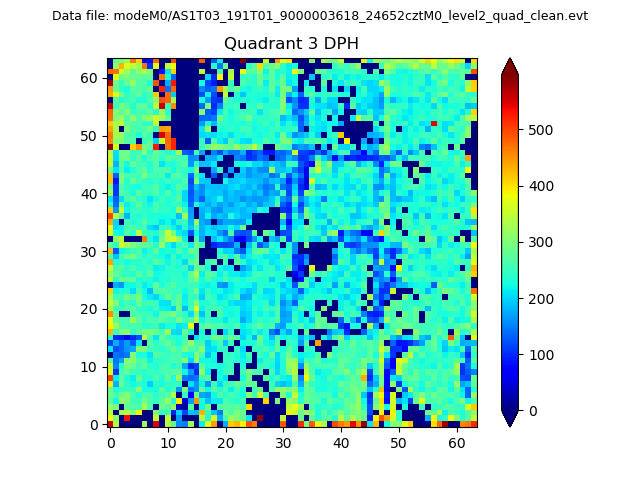 |
 |
Quadrant C |
| Plot type | Count rate plots | Images |
|---|---|---|
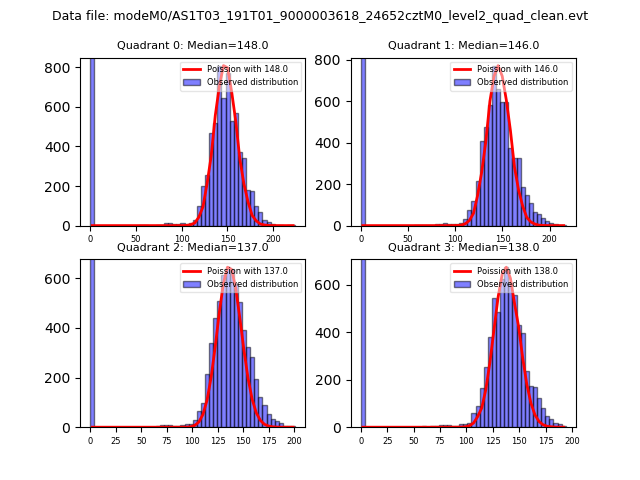
| Comparison with Poisson distribution Blue bars denote a histogram of data divided into 1 sec bins. Red curve is a Poisson curve with rate = median count rate of data. |
 |
 |
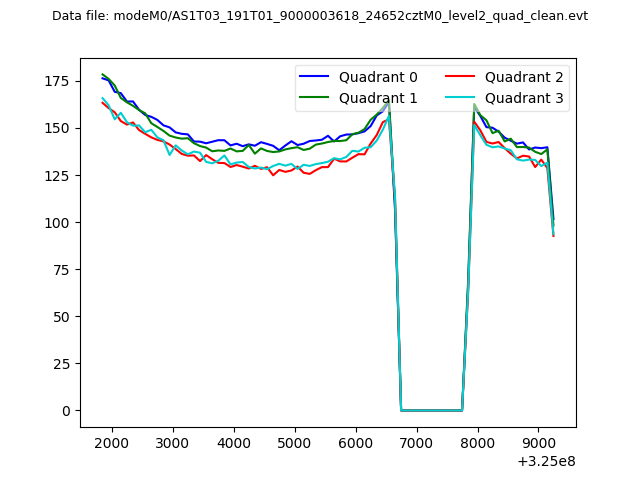
| Quadrant-wise count rates Data is divided into 100 sec bins |
 |
|
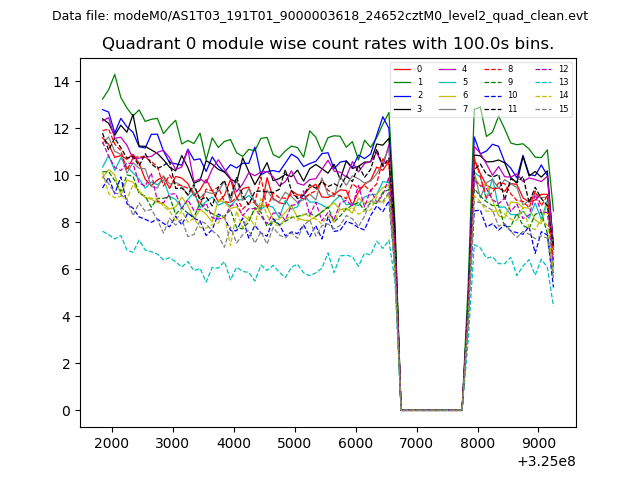
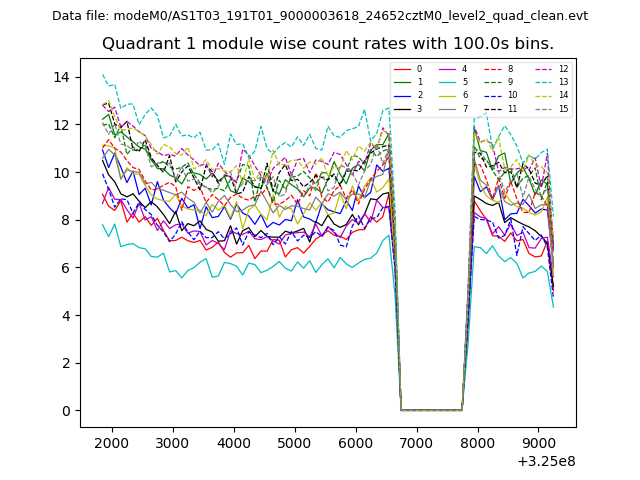
| Module-wise count rates for Quadrant A Data is divided into 100 sec bins |
 |
 |
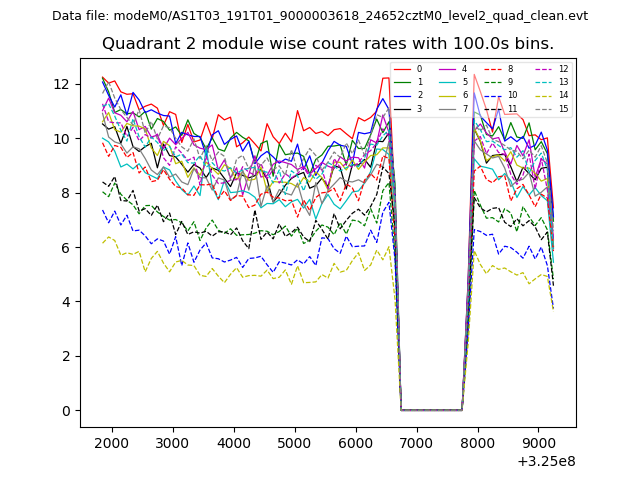
| Module-wise count rates for Quadrant B Data is divided into 100 sec bins |
 |
 |
| Module-wise count rates for Quadrant C Data is divided into 100 sec bins |
 |
 |
| Module-wise count rates for Quadrant D Data is divided into 100 sec bins |
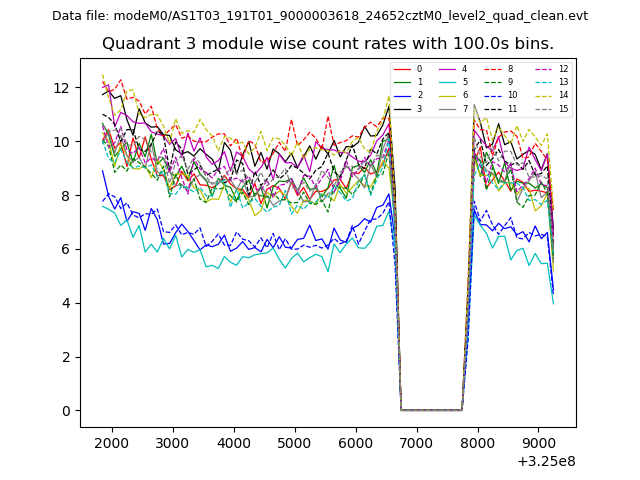 |
 |
| Parameter | Plot |
|---|---|
| CZT HV Monitor | 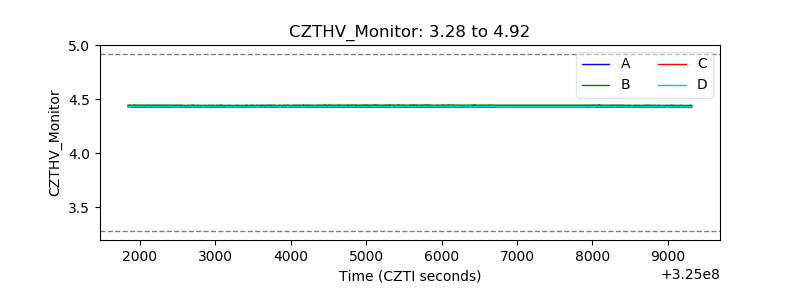 |
| D_VDD | 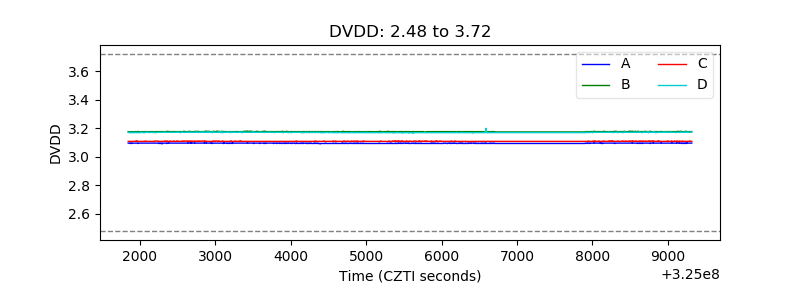 |
| Temperature 1 | 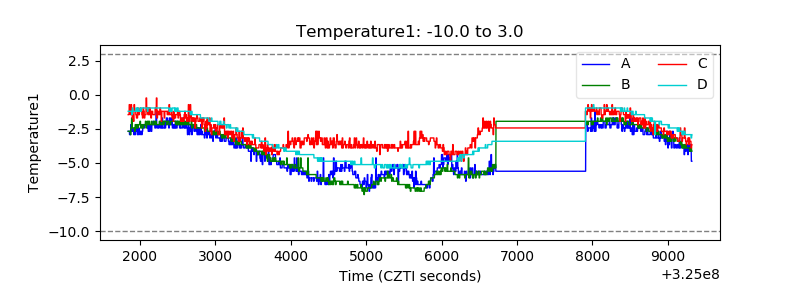 |
| Veto HV Monitor | 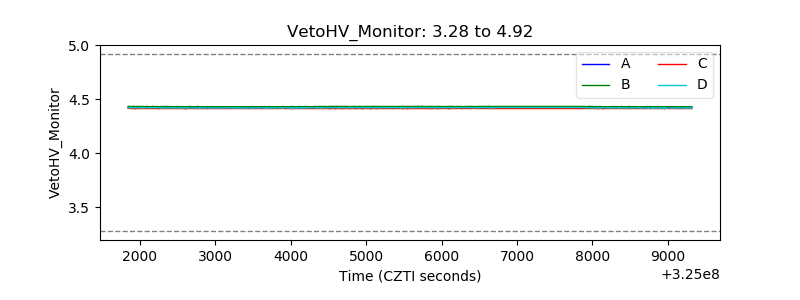 |
| Veto LLD | 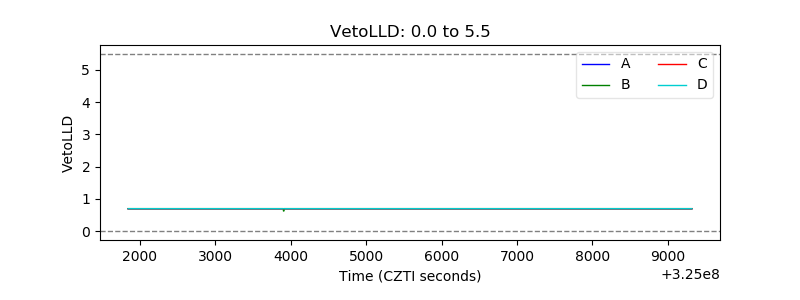 |
| Alpha Counter | 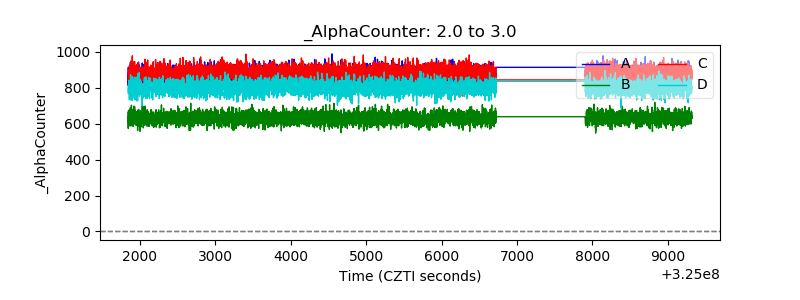 |
| _CPM_Rate | 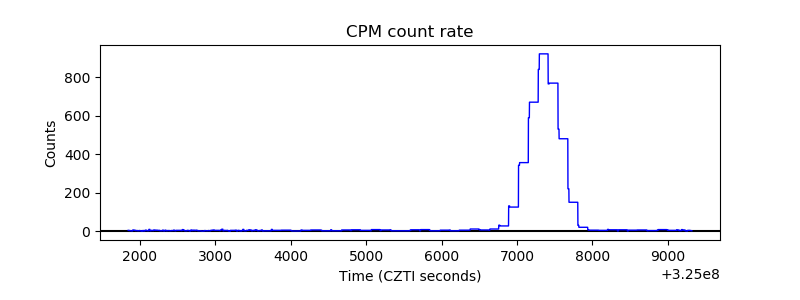 |
| CZT Counter | 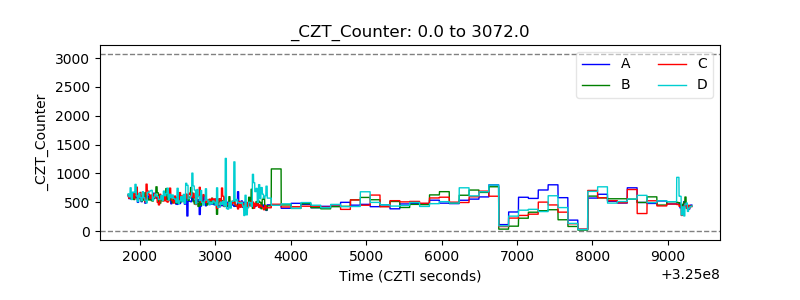 |
| +2.5 Volts monitor | 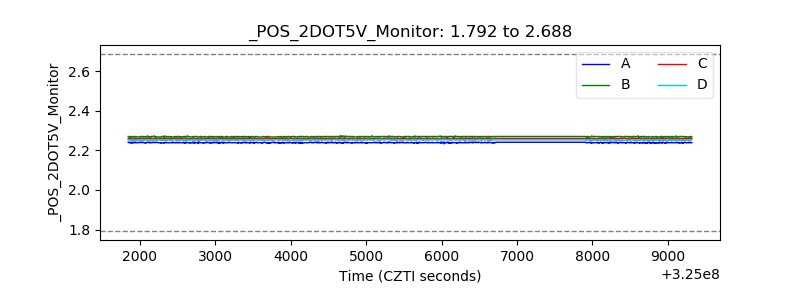 |
| +5 Volts monitor |  |
| _ROLL_ROT | 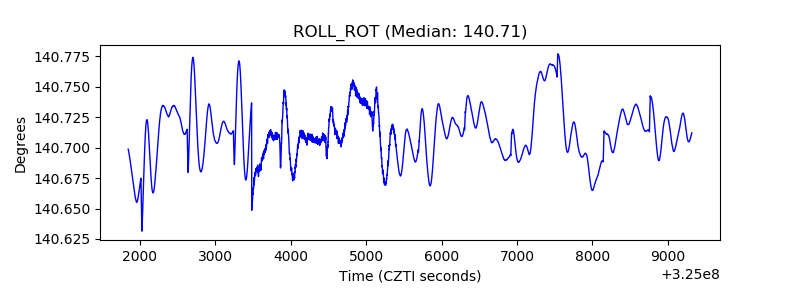 |
| _Roll_DEC | 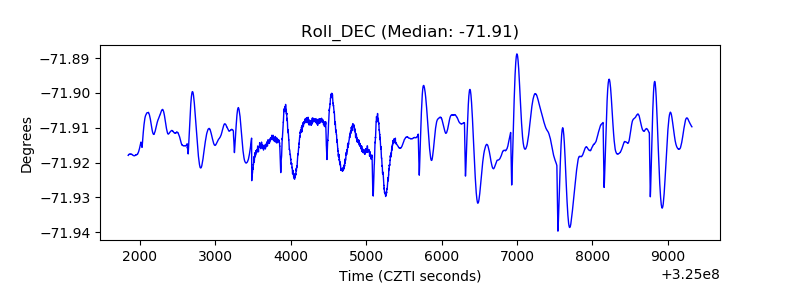 |
| _Roll_RA | 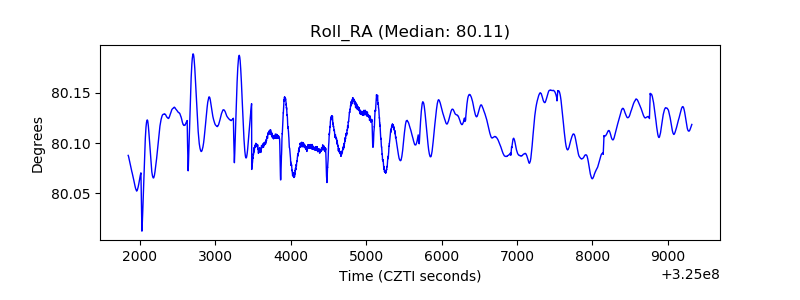 |
| Veto Counter | 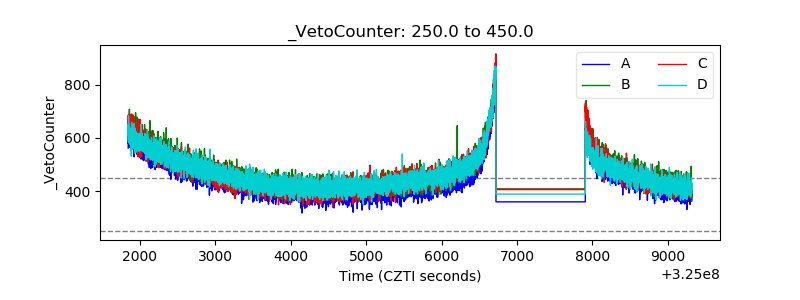 |