| Param | Original file | Final file |
|---|---|---|
| Filename | modeM0/AS1T03_191T01_9000003618_24655cztM0_level2.evt | modeM0/AS1T03_191T01_9000003618_24655cztM0_level2_quad_clean.evt |
| Size (bytes) | 575,835,840 | 144,777,600 |
| Size | 549.2 MB | 138.1 MB |
| Events in quadrant A | 3,592,798 | 993,004 |
| Events in quadrant B | 3,722,719 | 997,934 |
| Events in quadrant C | 4,109,735 | 940,299 |
| Events in quadrant D | 5,496,266 | 922,678 |
| Mode M9 | |||
|---|---|---|---|
| Quadrant | BADHDUFLAG | Total packets | Discarded packets |
| A | 0 | 7 | 0 |
| B | 0 | 7 | 0 |
| C | 0 | 7 | 0 |
| D | 0 | 7 | 0 |
| Mode M0 | |||
|---|---|---|---|
| Quadrant | BADHDUFLAG | Total packets | Discarded packets |
| A | 0 | 15857 | 2 |
| B | 0 | 16097 | 2 |
| C | 0 | 17268 | 2 |
| D | 0 | 21657 | 2 |
| Mode SS | |||
|---|---|---|---|
| Quadrant | BADHDUFLAG | Total packets | Discarded packets |
| A | 0 | 156 | 0 |
| B | 0 | 156 | 0 |
| C | 0 | 156 | 0 |
| D | 0 | 156 | 0 |
| Quadrant | Total seconds | Saturated seconds | Saturation percentage |
|---|---|---|---|
| A | 7638 | 59 | 0.772454% |
| B | 7639 | 77 | 1.007985% |
| C | 7639 | 114 | 1.492342% |
| D | 7639 | 230 | 3.010865% |
Noise dominated data is calculated using 1-second bins in cleaned event files. If a bin has >2000 counts, and if more than 50% of those come from <1% of pixels, then it is considered to be noise-dominated and hence unusable.
| Quadrant | # 1 sec bins | Bins with >0 counts | Bins with >2000 counts | High rate bins dominated by noise | Noise dominated (total time) | Noise dominated (detector-on time) | Marked lightcurve |
|---|---|---|---|---|---|---|---|
| A | 8378 | 7640 | 2 | 2 | 0.02% | 0.03% | 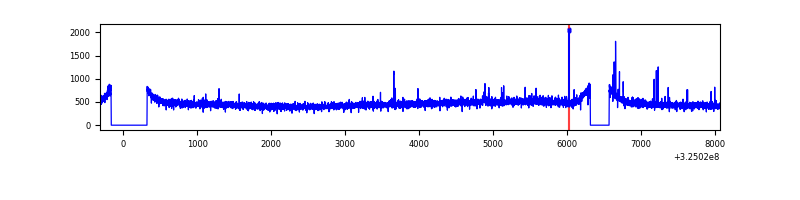 |
| B | 8379 | 7641 | 0 | 0 | 0.00% | 0.00% |  |
| C | 8379 | 7641 | 8 | 8 | 0.10% | 0.10% | 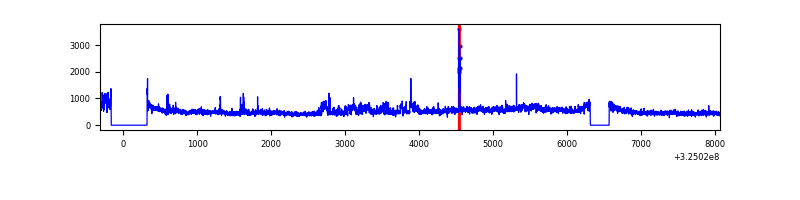 |
| D | 8379 | 7641 | 154 | 154 | 1.84% | 2.02% | 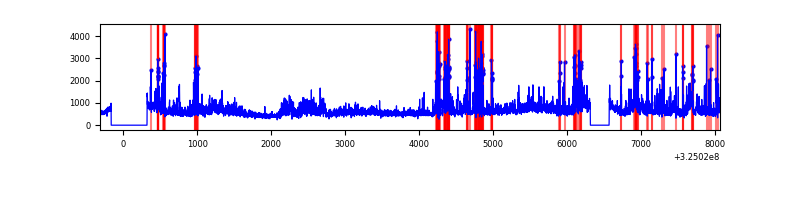 |
Top three noisy pixels from each quadrant. If the there are fewer than three noisy pixels in the level2.evt file, extra rows are filled as -1
| Pixel properties | Quadrant properties | ||||||
|---|---|---|---|---|---|---|---|
| Quadrant | DetID | PixID | Counts | Sigma | Mean | Median | Sigma |
| A | 6 | 16 | 39984 | 211.22 | 921 | 899 | 185.0 |
| A | 13 | 254 | 13284 | 66.93 | 921 | 899 | 185.0 |
| A | 3 | 137 | 8419 | 40.64 | 921 | 899 | 185.0 |
| B | 0 | 189 | 42722 | 239.79 | 912 | 886 | 174.5 |
| B | 15 | 32 | 31619 | 176.15 | 912 | 886 | 174.5 |
| B | 0 | 190 | 25378 | 140.38 | 912 | 886 | 174.5 |
| C | 7 | 247 | 317649 | 1575.13 | 869 | 875 | 201.1 |
| C | 3 | 233 | 208987 | 1034.82 | 869 | 875 | 201.1 |
| C | 14 | 238 | 139628 | 689.94 | 869 | 875 | 201.1 |
| D | 8 | 195 | 1039952 | 4874.37 | 878 | 852 | 213.2 |
| D | 1 | 52 | 895008 | 4194.45 | 878 | 852 | 213.2 |
| D | 7 | 238 | 126870 | 591.14 | 878 | 852 | 213.2 |
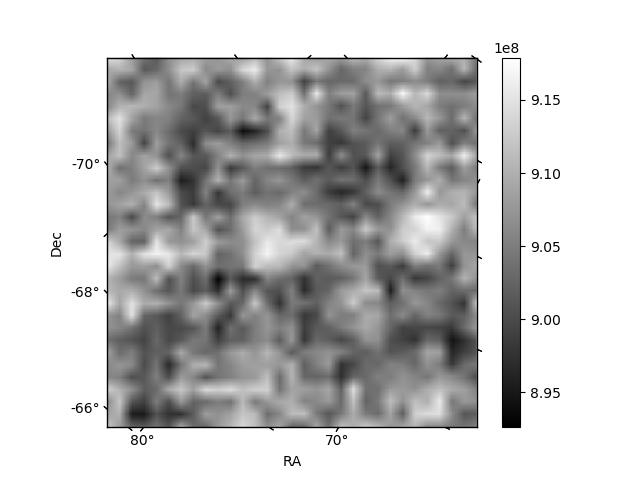
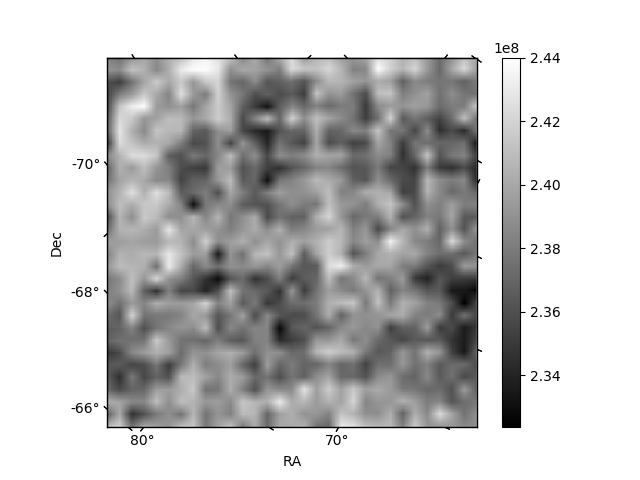
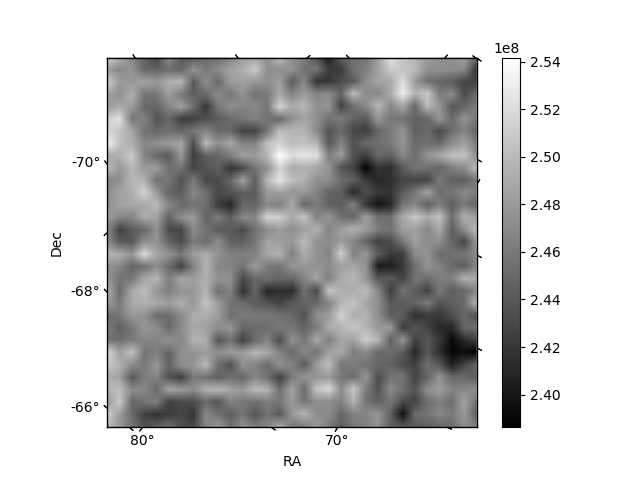
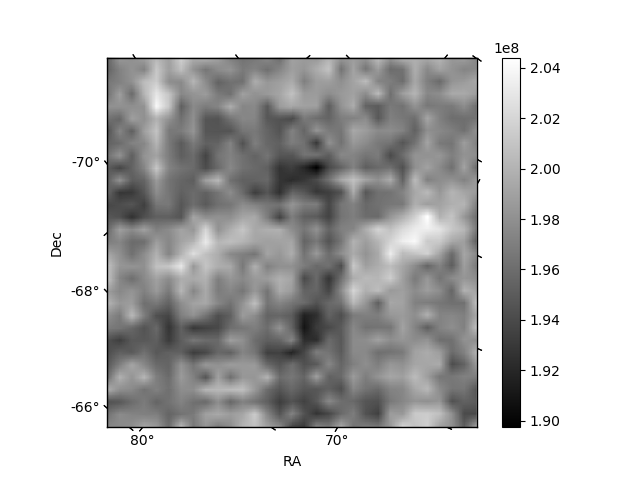
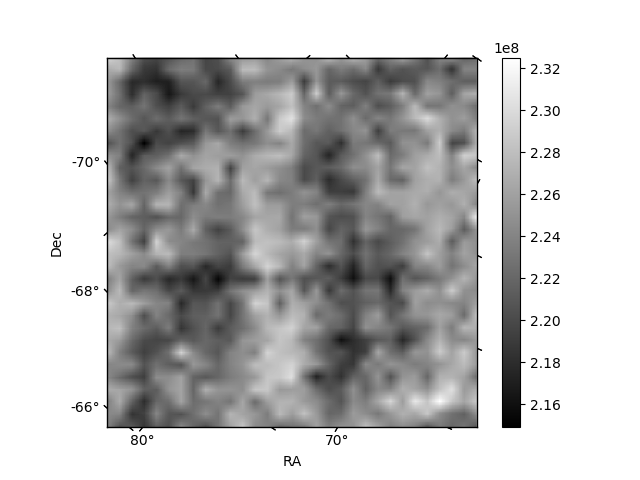
Histogram calculated using DETX and DETY for each event in the final _common_clean file
| Quadrant A | 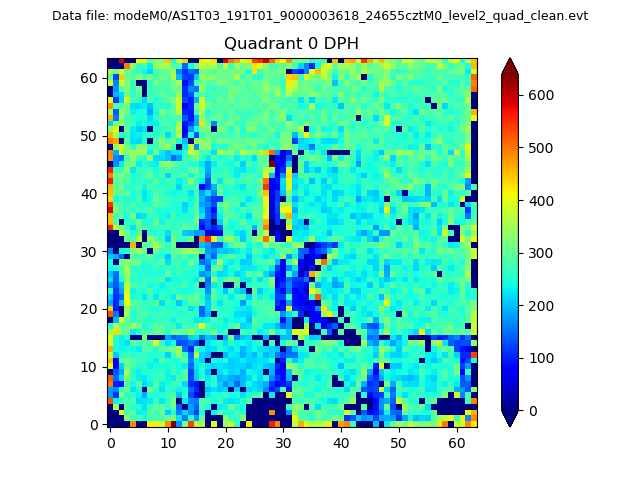 |
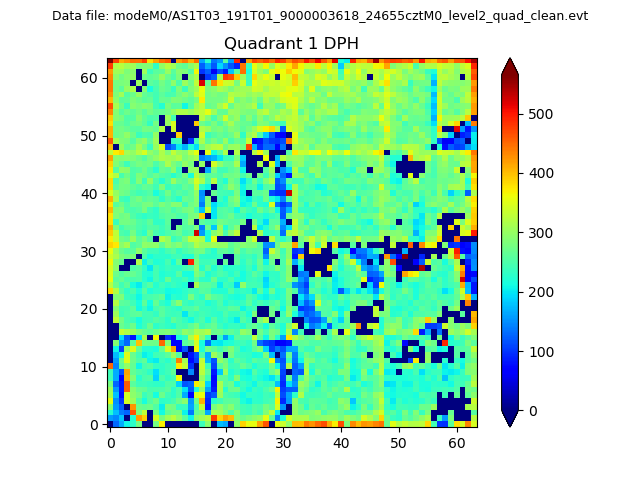 |
Quadrant B |
|---|---|---|---|
| Quadrant D | 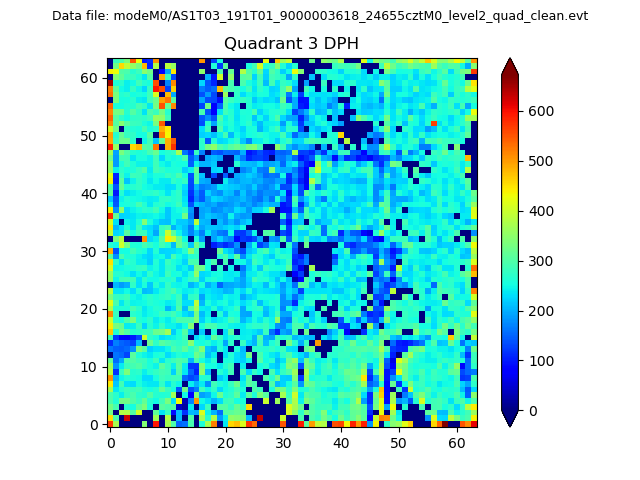 |
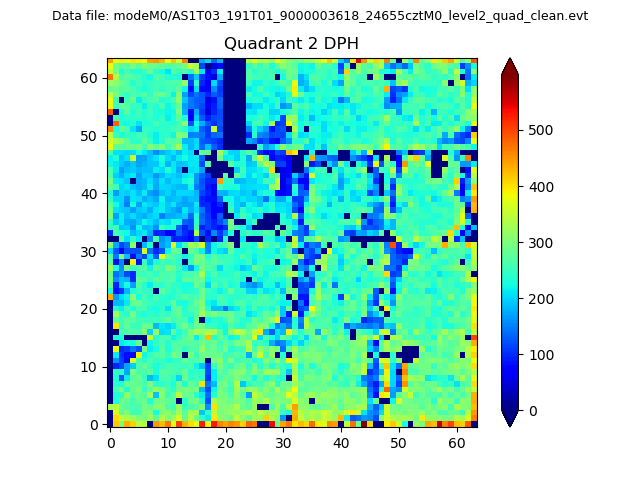 |
Quadrant C |
| Plot type | Count rate plots | Images |
|---|---|---|
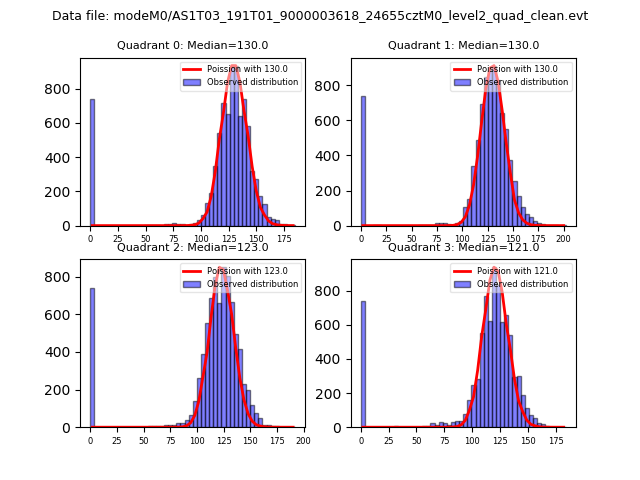
| Comparison with Poisson distribution Blue bars denote a histogram of data divided into 1 sec bins. Red curve is a Poisson curve with rate = median count rate of data. |
 |
 |
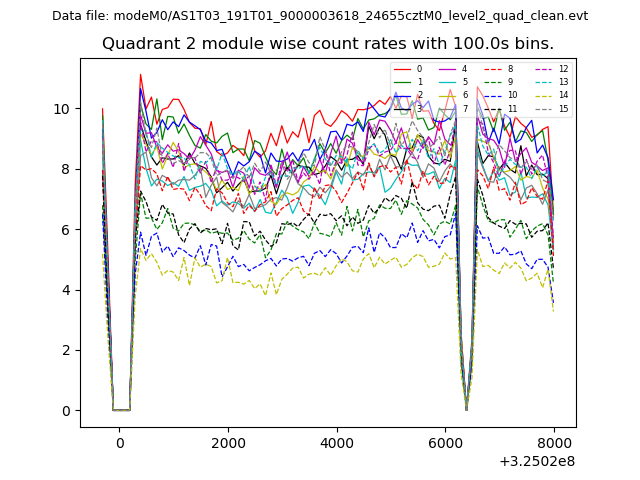
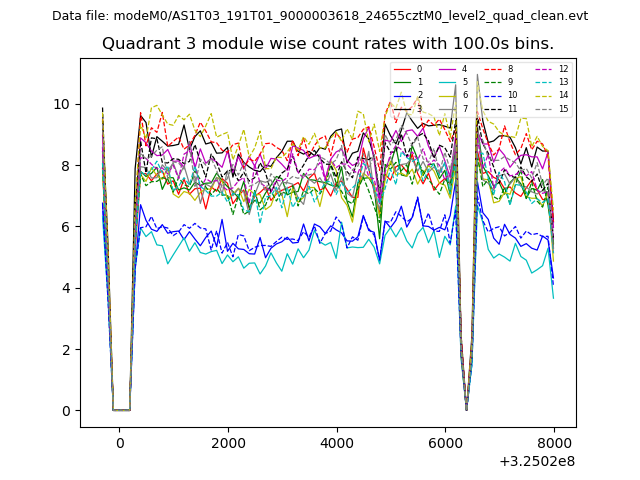
| Quadrant-wise count rates Data is divided into 100 sec bins |
 |
|
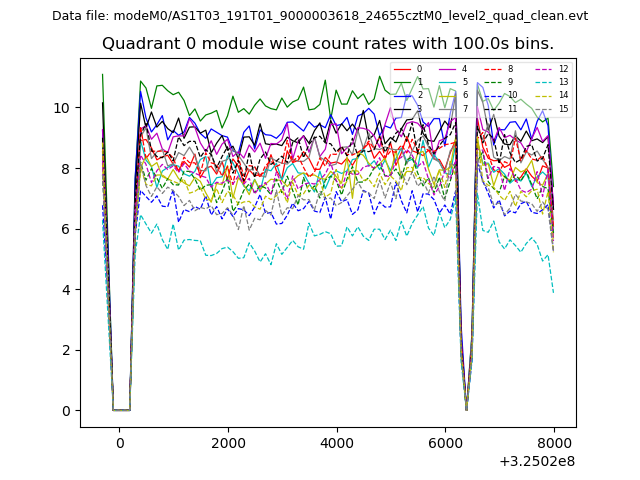
| Module-wise count rates for Quadrant A Data is divided into 100 sec bins |
 |
 |
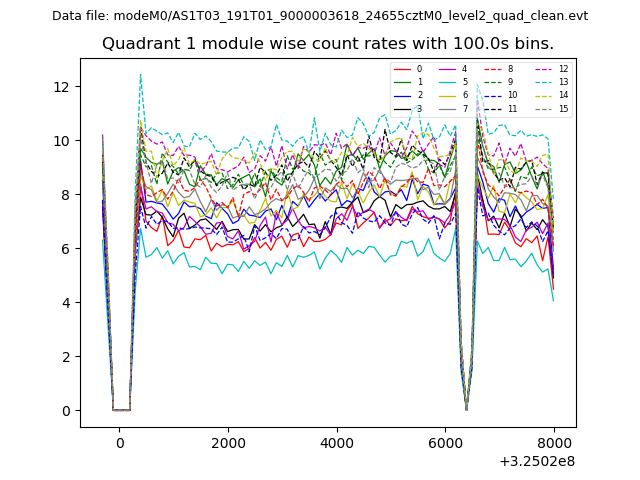
| Module-wise count rates for Quadrant B Data is divided into 100 sec bins |
 |
 |
| Module-wise count rates for Quadrant C Data is divided into 100 sec bins |
 |
 |
| Module-wise count rates for Quadrant D Data is divided into 100 sec bins |
 |
 |
| Parameter | Plot |
|---|---|
| CZT HV Monitor | 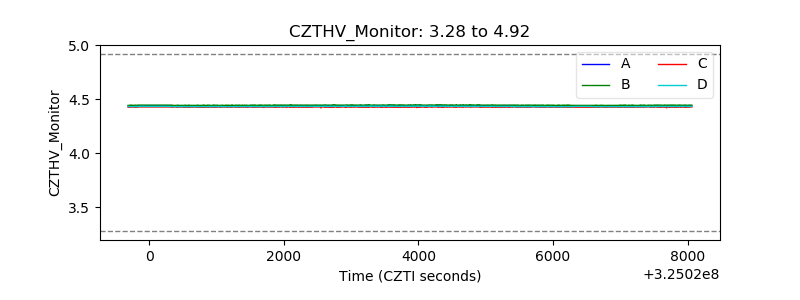 |
| D_VDD | 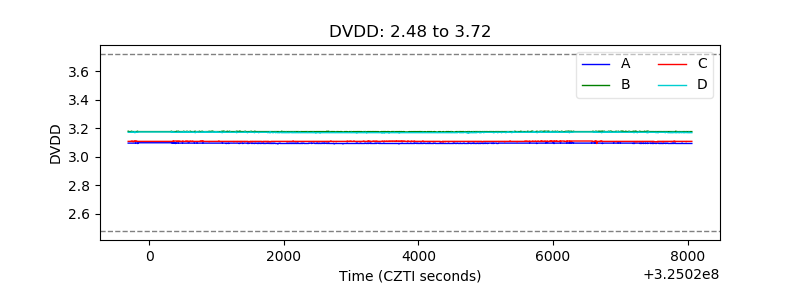 |
| Temperature 1 | 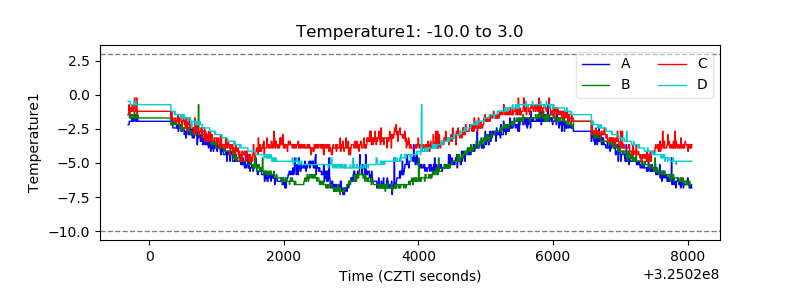 |
| Veto HV Monitor | 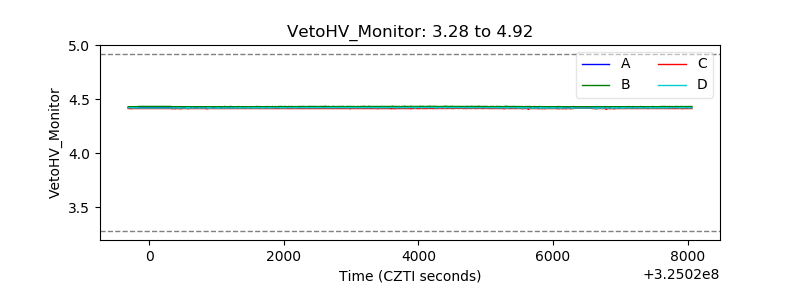 |
| Veto LLD | 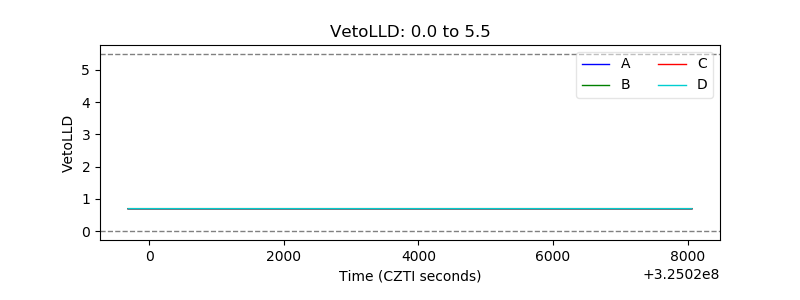 |
| Alpha Counter | 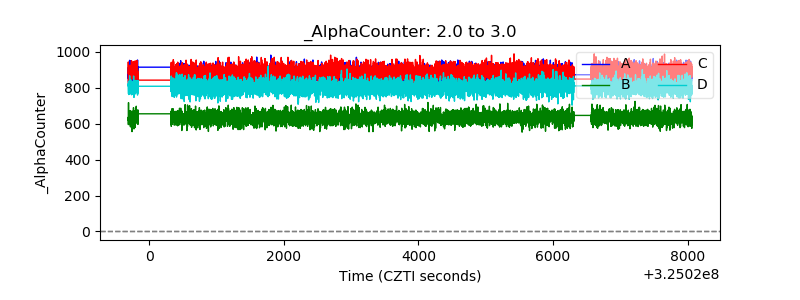 |
| _CPM_Rate | 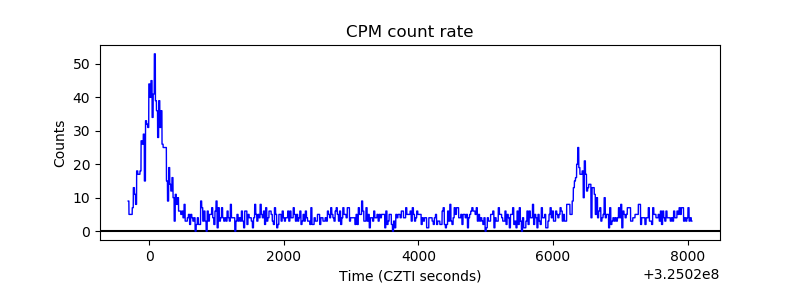 |
| CZT Counter | 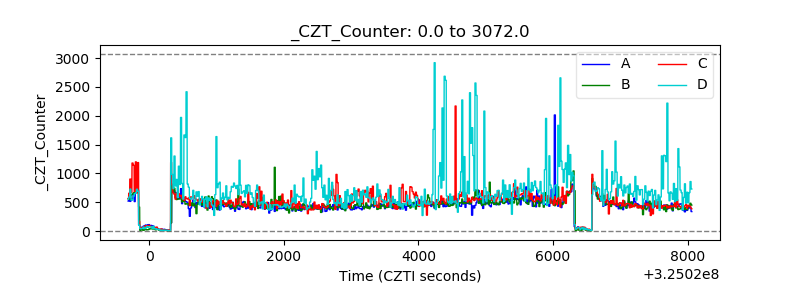 |
| +2.5 Volts monitor |  |
| +5 Volts monitor |  |
| _ROLL_ROT | 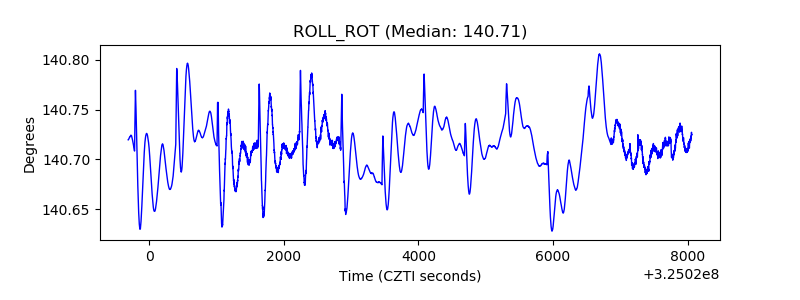 |
| _Roll_DEC | 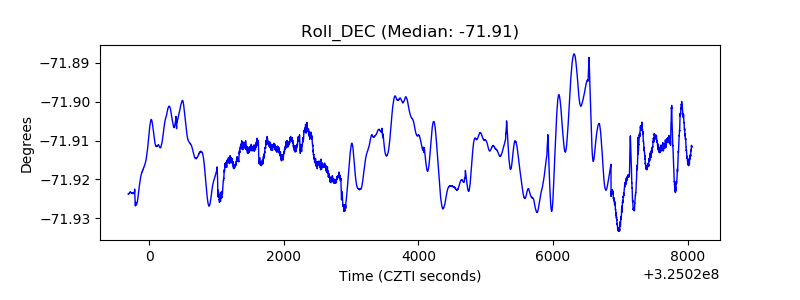 |
| _Roll_RA | 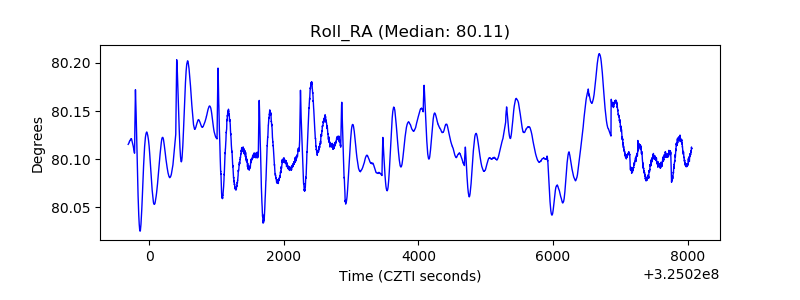 |
| Veto Counter | 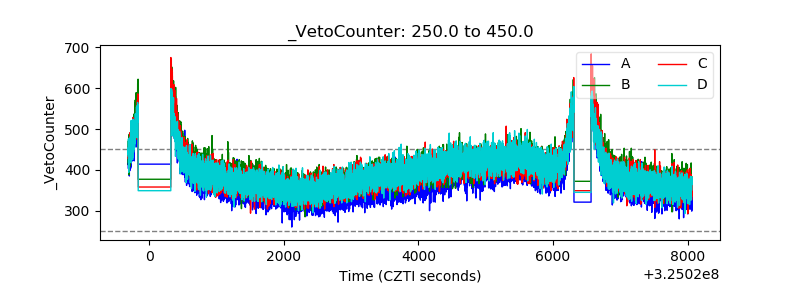 |