| Param | Original file | Final file |
|---|---|---|
| Filename | modeM0/AS1T03_191T01_9000003618_24656cztM0_level2.evt | modeM0/AS1T03_191T01_9000003618_24656cztM0_level2_quad_clean.evt |
| Size (bytes) | 573,220,800 | 144,682,560 |
| Size | 546.7 MB | 138.0 MB |
| Events in quadrant A | 3,648,687 | 988,563 |
| Events in quadrant B | 3,743,007 | 996,248 |
| Events in quadrant C | 3,800,484 | 938,267 |
| Events in quadrant D | 5,645,844 | 923,664 |
| Mode M9 | |||
|---|---|---|---|
| Quadrant | BADHDUFLAG | Total packets | Discarded packets |
| A | 0 | 5 | 0 |
| B | 0 | 5 | 0 |
| C | 0 | 5 | 0 |
| D | 0 | 5 | 0 |
| Mode M0 | |||
|---|---|---|---|
| Quadrant | BADHDUFLAG | Total packets | Discarded packets |
| A | 0 | 16074 | 2 |
| B | 0 | 16198 | 2 |
| C | 0 | 16091 | 3 |
| D | 0 | 22164 | 2 |
| Mode SS | |||
|---|---|---|---|
| Quadrant | BADHDUFLAG | Total packets | Discarded packets |
| A | 0 | 158 | 0 |
| B | 0 | 158 | 0 |
| C | 0 | 158 | 0 |
| D | 0 | 158 | 0 |
| Quadrant | Total seconds | Saturated seconds | Saturation percentage |
|---|---|---|---|
| A | 7699 | 91 | 1.181972% |
| B | 7700 | 120 | 1.558442% |
| C | 7699 | 130 | 1.688531% |
| D | 7699 | 206 | 2.675672% |
Noise dominated data is calculated using 1-second bins in cleaned event files. If a bin has >2000 counts, and if more than 50% of those come from <1% of pixels, then it is considered to be noise-dominated and hence unusable.
| Quadrant | # 1 sec bins | Bins with >0 counts | Bins with >2000 counts | High rate bins dominated by noise | Noise dominated (total time) | Noise dominated (detector-on time) | Marked lightcurve |
|---|---|---|---|---|---|---|---|
| A | 8254 | 7701 | 4 | 4 | 0.05% | 0.05% | 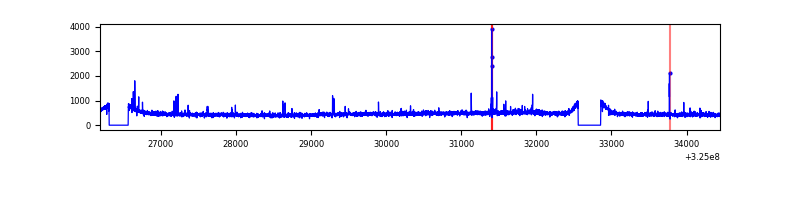 |
| B | 8255 | 7702 | 0 | 0 | 0.00% | 0.00% | 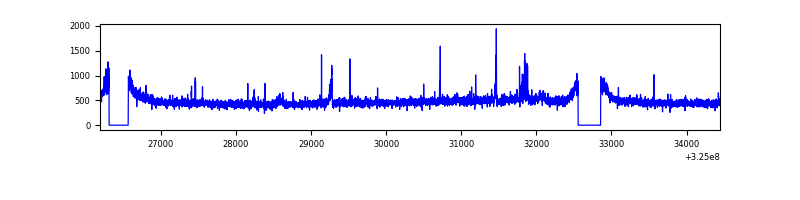 |
| C | 8254 | 7701 | 7 | 7 | 0.08% | 0.09% | 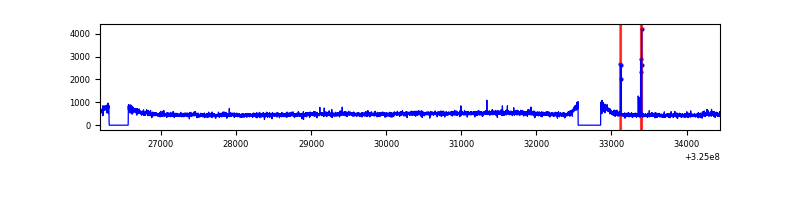 |
| D | 8254 | 7701 | 101 | 101 | 1.22% | 1.31% | 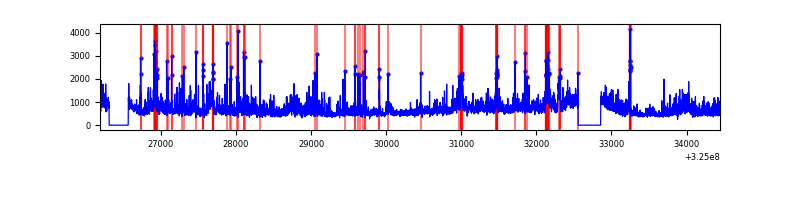 |
Top three noisy pixels from each quadrant. If the there are fewer than three noisy pixels in the level2.evt file, extra rows are filled as -1
| Pixel properties | Quadrant properties | ||||||
|---|---|---|---|---|---|---|---|
| Quadrant | DetID | PixID | Counts | Sigma | Mean | Median | Sigma |
| A | 6 | 16 | 49367 | 259.02 | 926 | 904 | 187.1 |
| A | 12 | 96 | 24288 | 124.98 | 926 | 904 | 187.1 |
| A | 13 | 254 | 13740 | 68.61 | 926 | 904 | 187.1 |
| B | 0 | 190 | 46661 | 259.72 | 919 | 896 | 176.2 |
| B | 0 | 189 | 42038 | 233.49 | 919 | 896 | 176.2 |
| B | 12 | 111 | 21657 | 117.82 | 919 | 896 | 176.2 |
| C | 7 | 247 | 171534 | 827.04 | 877 | 878 | 206.3 |
| C | 14 | 238 | 139329 | 670.97 | 877 | 878 | 206.3 |
| C | 10 | 91 | 22729 | 105.9 | 877 | 878 | 206.3 |
| D | 8 | 195 | 1216668 | 5637.33 | 890 | 862 | 215.7 |
| D | 1 | 52 | 709715 | 3286.74 | 890 | 862 | 215.7 |
| D | 7 | 238 | 190025 | 877.09 | 890 | 862 | 215.7 |
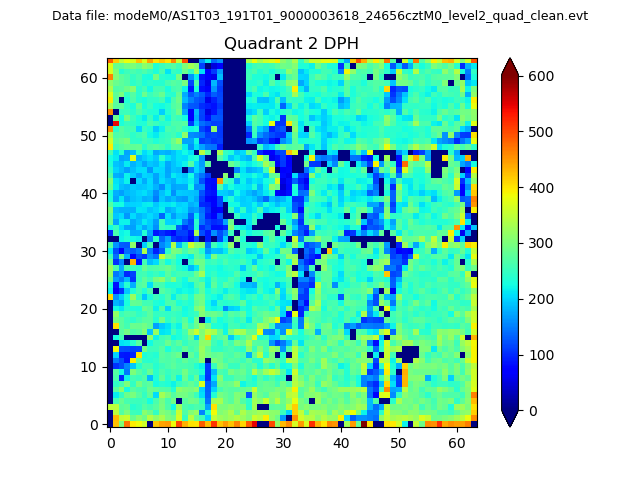
Histogram calculated using DETX and DETY for each event in the final _common_clean file
| Quadrant A | 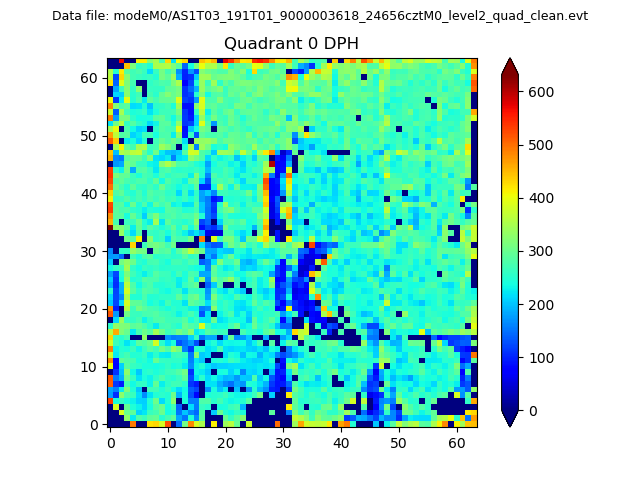 |
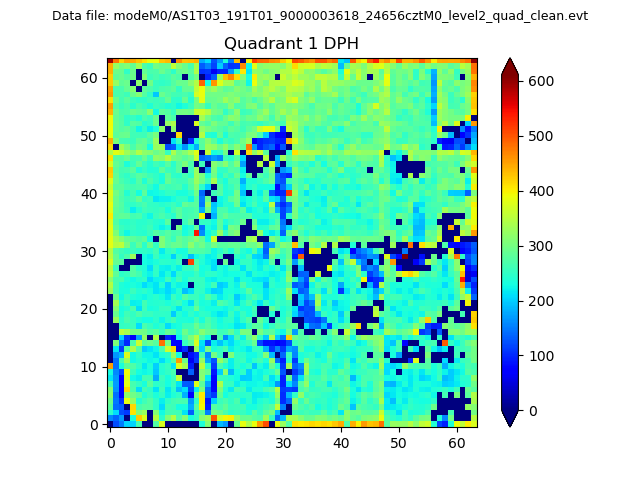 |
Quadrant B |
|---|---|---|---|
| Quadrant D | 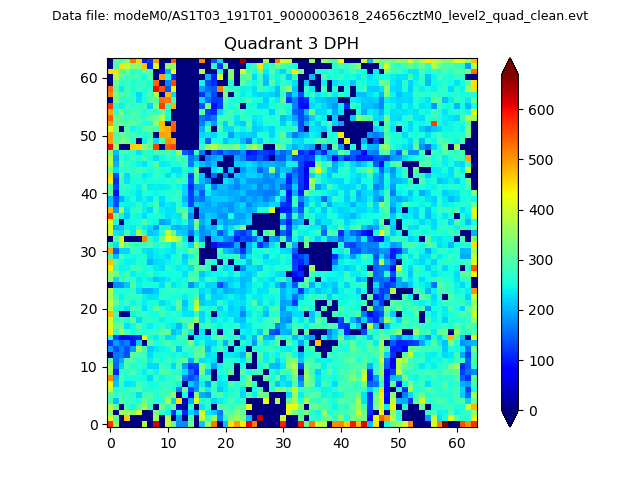 |
 |
Quadrant C |
| Plot type | Count rate plots | Images |
|---|---|---|
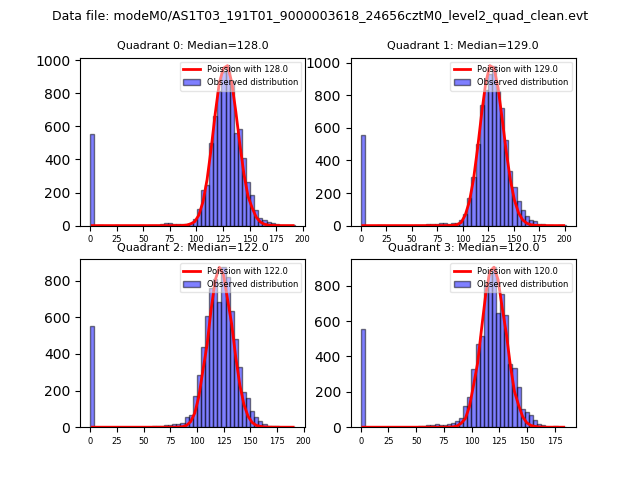
| Comparison with Poisson distribution Blue bars denote a histogram of data divided into 1 sec bins. Red curve is a Poisson curve with rate = median count rate of data. |
 |
 |
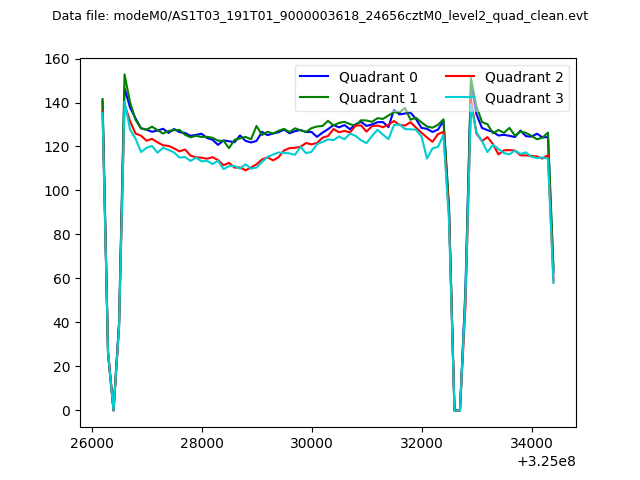
| Quadrant-wise count rates Data is divided into 100 sec bins |
 |
|
| Module-wise count rates for Quadrant A Data is divided into 100 sec bins |
 |
 |
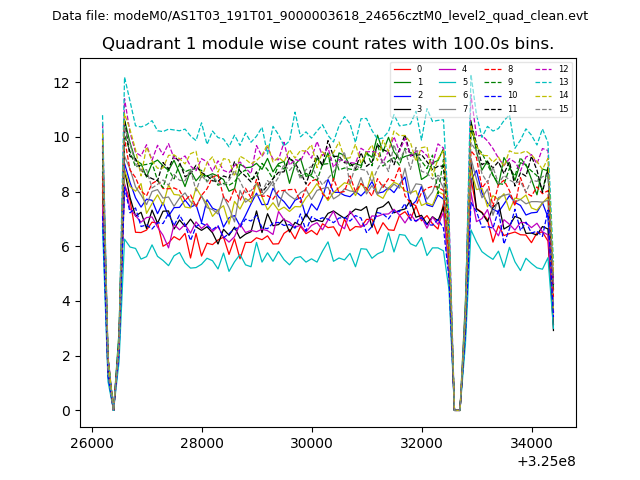
| Module-wise count rates for Quadrant B Data is divided into 100 sec bins |
 |
 |
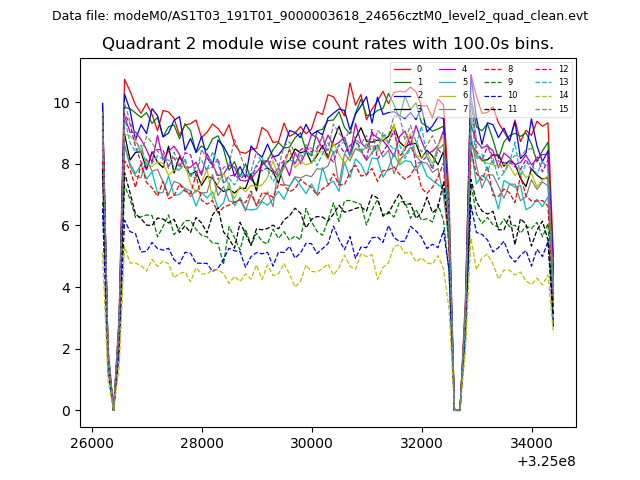
| Module-wise count rates for Quadrant C Data is divided into 100 sec bins |
 |
 |
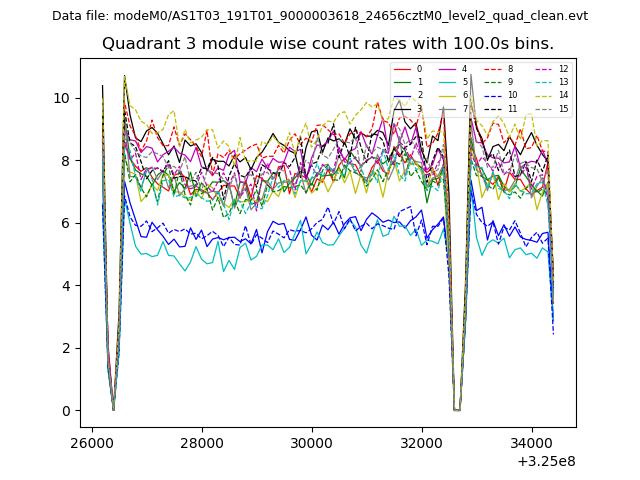
| Module-wise count rates for Quadrant D Data is divided into 100 sec bins |
 |
 |
| Parameter | Plot |
|---|---|
| CZT HV Monitor | 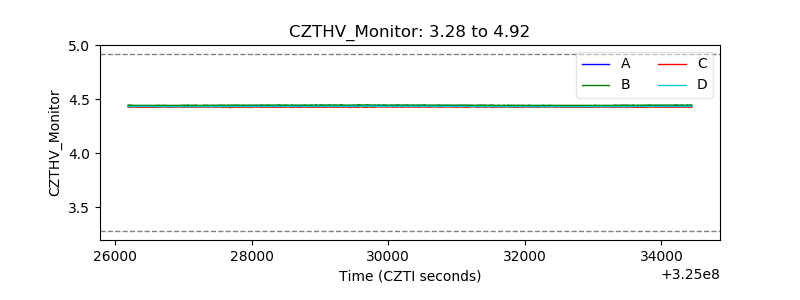 |
| D_VDD | 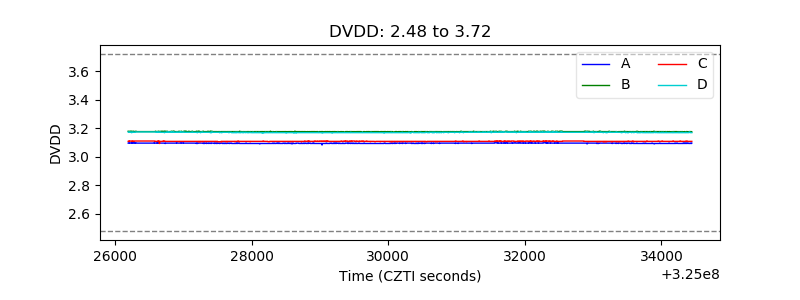 |
| Temperature 1 | 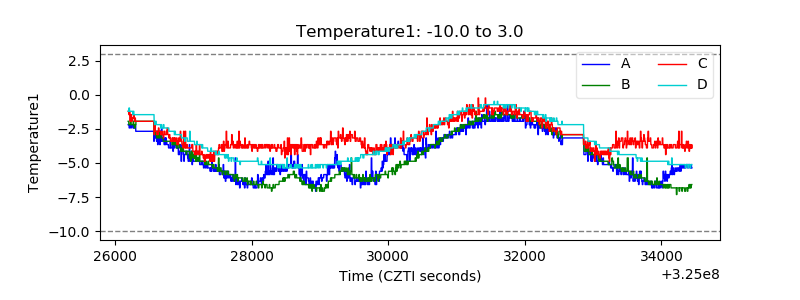 |
| Veto HV Monitor | 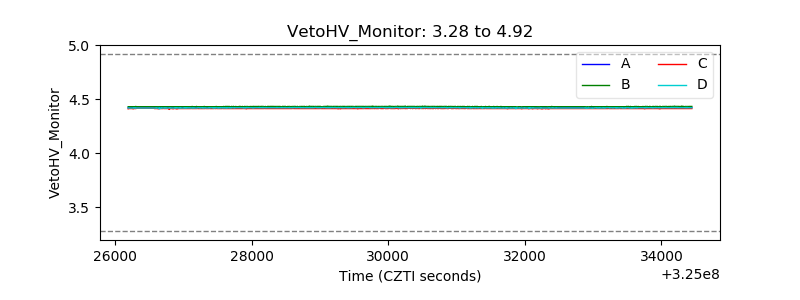 |
| Veto LLD | 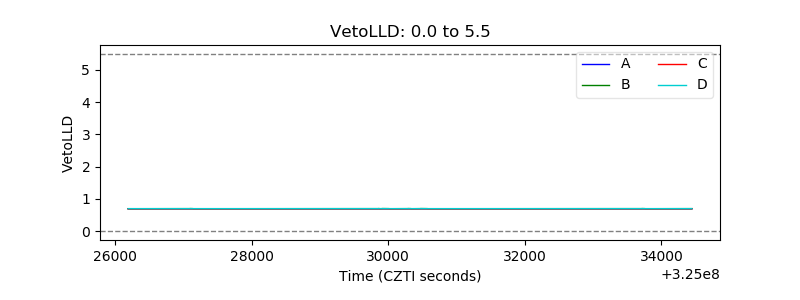 |
| Alpha Counter | 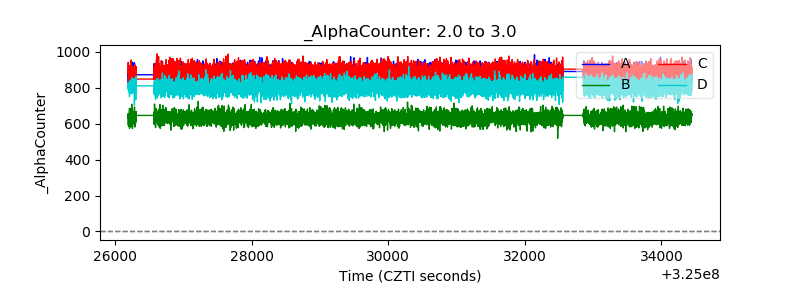 |
| _CPM_Rate | 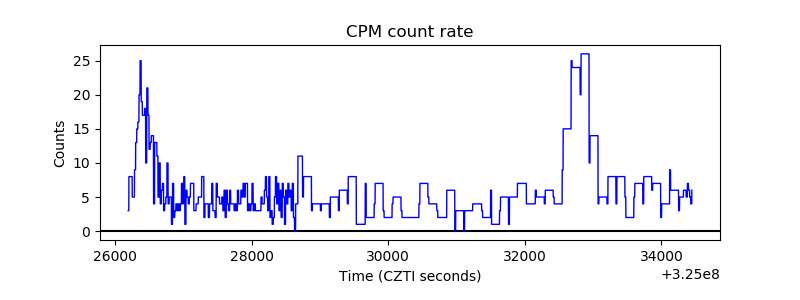 |
| CZT Counter | 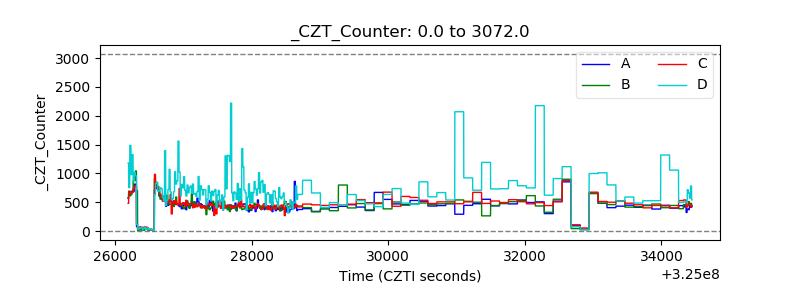 |
| +2.5 Volts monitor | 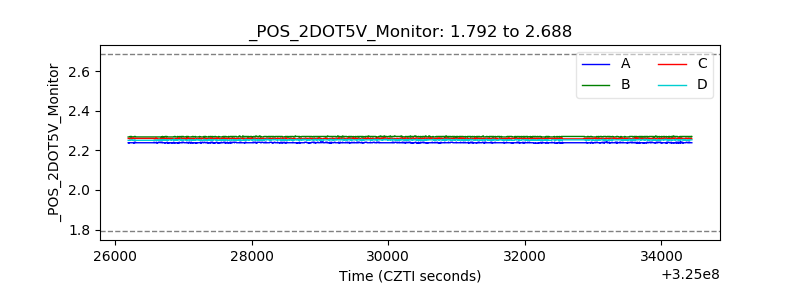 |
| +5 Volts monitor |  |
| _ROLL_ROT | 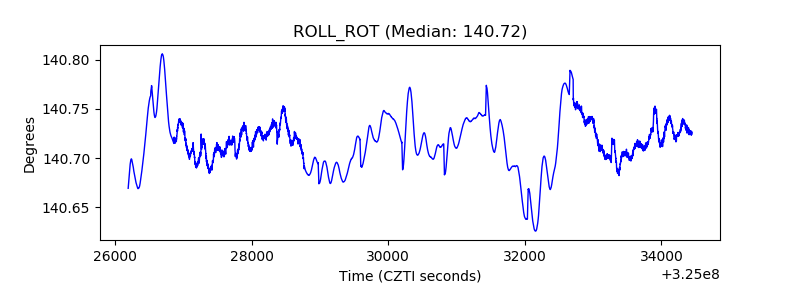 |
| _Roll_DEC | 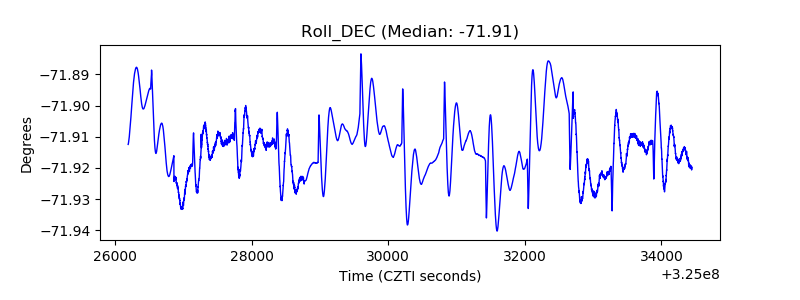 |
| _Roll_RA | 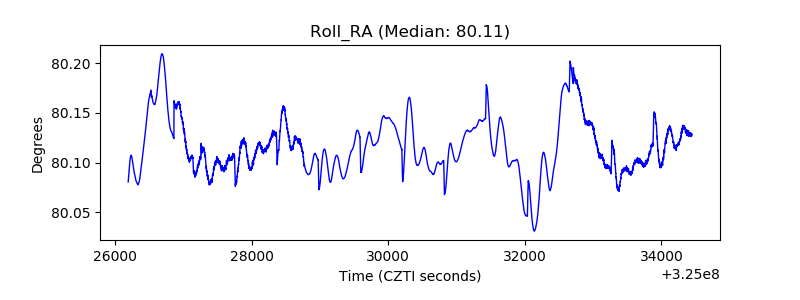 |
| Veto Counter | 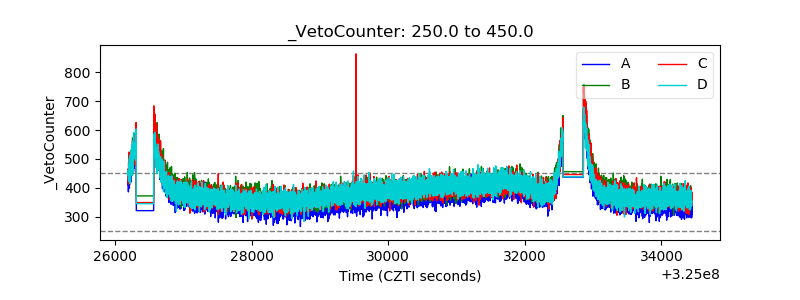 |