| Param | Original file | Final file |
|---|---|---|
| Filename | modeM0/AS1T03_191T01_9000003618_24658cztM0_level2.evt | modeM0/AS1T03_191T01_9000003618_24658cztM0_level2_quad_clean.evt |
| Size (bytes) | 428,518,080 | 111,104,640 |
| Size | 408.7 MB | 106.0 MB |
| Events in quadrant A | 2,765,405 | 755,034 |
| Events in quadrant B | 2,936,637 | 762,023 |
| Events in quadrant C | 2,842,923 | 721,421 |
| Events in quadrant D | 4,029,520 | 711,980 |
| Mode M9 | |||
|---|---|---|---|
| Quadrant | BADHDUFLAG | Total packets | Discarded packets |
| A | 0 | 3 | 0 |
| B | 0 | 3 | 0 |
| C | 0 | 3 | 0 |
| D | 0 | 3 | 0 |
| Mode M0 | |||
|---|---|---|---|
| Quadrant | BADHDUFLAG | Total packets | Discarded packets |
| A | 0 | 12165 | 1 |
| B | 0 | 12607 | 1 |
| C | 0 | 12269 | 1 |
| D | 0 | 16043 | 1 |
| Mode SS | |||
|---|---|---|---|
| Quadrant | BADHDUFLAG | Total packets | Discarded packets |
| A | 0 | 120 | 0 |
| B | 0 | 120 | 0 |
| C | 0 | 120 | 0 |
| D | 0 | 120 | 0 |
| Quadrant | Total seconds | Saturated seconds | Saturation percentage |
|---|---|---|---|
| A | 5935 | 56 | 0.943555% |
| B | 5936 | 81 | 1.364555% |
| C | 5936 | 104 | 1.752022% |
| D | 5936 | 96 | 1.617251% |
Noise dominated data is calculated using 1-second bins in cleaned event files. If a bin has >2000 counts, and if more than 50% of those come from <1% of pixels, then it is considered to be noise-dominated and hence unusable.
| Quadrant | # 1 sec bins | Bins with >0 counts | Bins with >2000 counts | High rate bins dominated by noise | Noise dominated (total time) | Noise dominated (detector-on time) | Marked lightcurve |
|---|---|---|---|---|---|---|---|
| A | 6235 | 5936 | 2 | 2 | 0.03% | 0.03% | 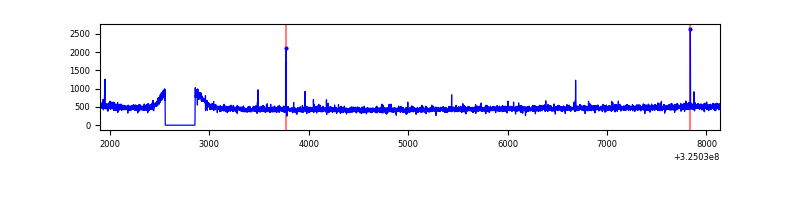 |
| B | 6236 | 5937 | 7 | 7 | 0.11% | 0.12% | 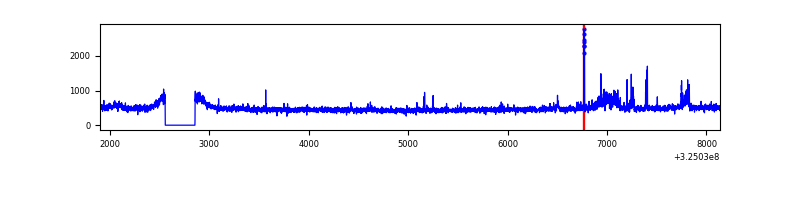 |
| C | 6236 | 5937 | 9 | 9 | 0.14% | 0.15% | 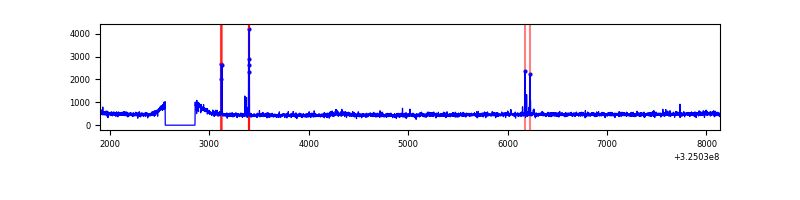 |
| D | 6236 | 5937 | 30 | 30 | 0.48% | 0.51% | 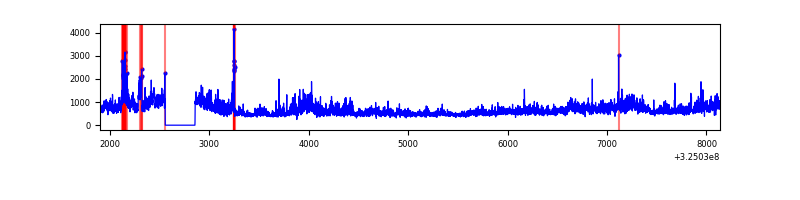 |
Top three noisy pixels from each quadrant. If the there are fewer than three noisy pixels in the level2.evt file, extra rows are filled as -1
| Pixel properties | Quadrant properties | ||||||
|---|---|---|---|---|---|---|---|
| Quadrant | DetID | PixID | Counts | Sigma | Mean | Median | Sigma |
| A | 13 | 254 | 11006 | 71.24 | 711 | 696 | 144.7 |
| A | 12 | 96 | 10868 | 70.29 | 711 | 696 | 144.7 |
| A | 3 | 137 | 6730 | 41.69 | 711 | 696 | 144.7 |
| B | 0 | 230 | 66523 | 483.62 | 702 | 682 | 136.1 |
| B | 0 | 190 | 59945 | 435.3 | 702 | 682 | 136.1 |
| B | 5 | 172 | 25459 | 181.99 | 702 | 682 | 136.1 |
| C | 14 | 238 | 107880 | 672.09 | 676 | 679 | 159.5 |
| C | 7 | 247 | 40905 | 252.2 | 676 | 679 | 159.5 |
| C | 5 | 112 | 18372 | 110.93 | 676 | 679 | 159.5 |
| D | 8 | 195 | 1143492 | 6768.87 | 687 | 664 | 168.8 |
| D | 1 | 52 | 104666 | 616.0 | 687 | 664 | 168.8 |
| D | 9 | 1 | 90159 | 530.07 | 687 | 664 | 168.8 |
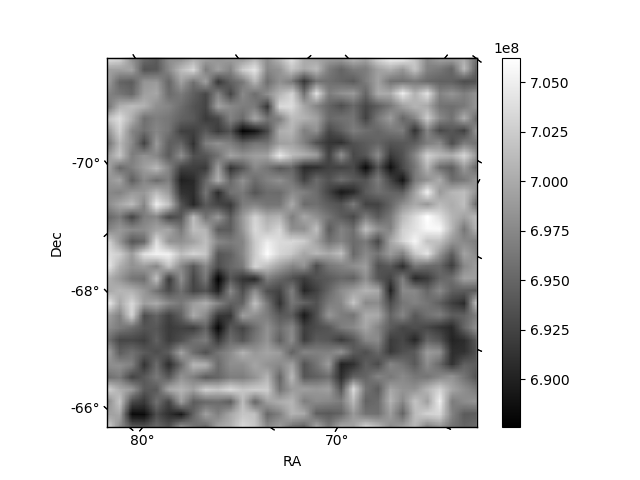
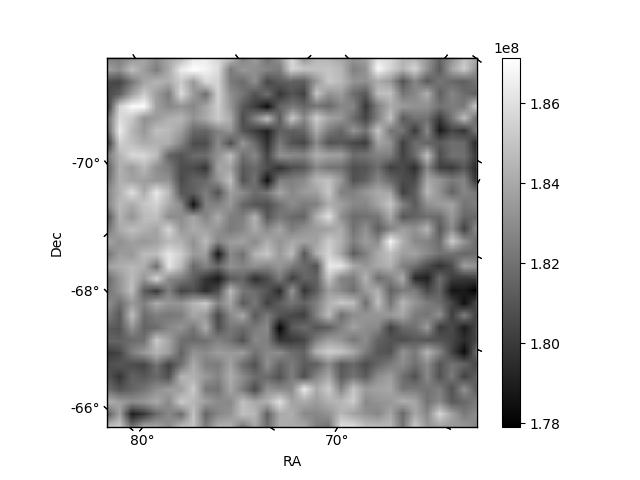
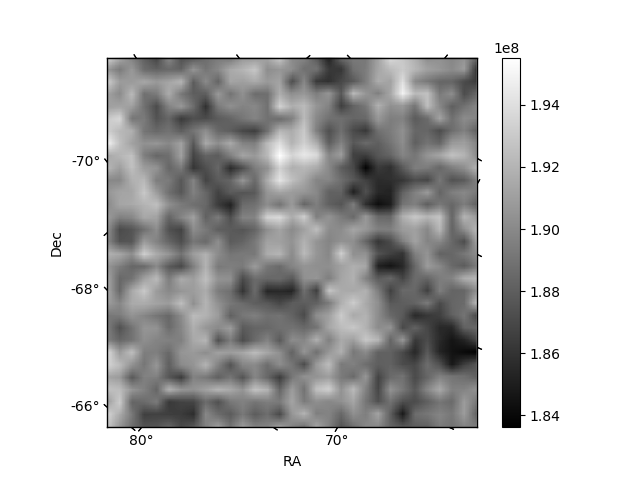
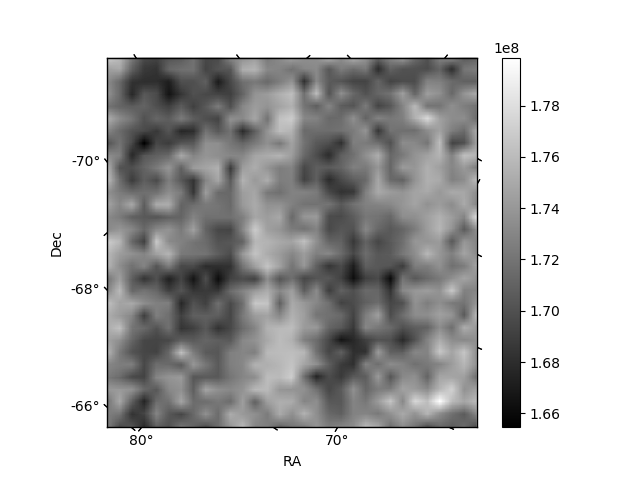
Histogram calculated using DETX and DETY for each event in the final _common_clean file
| Quadrant A | 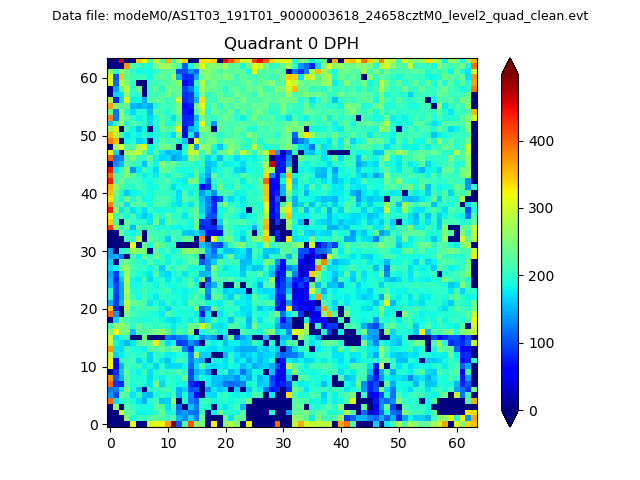 |
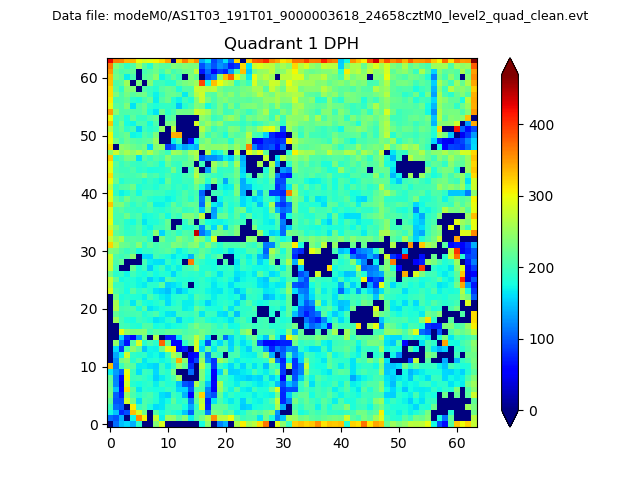 |
Quadrant B |
|---|---|---|---|
| Quadrant D | 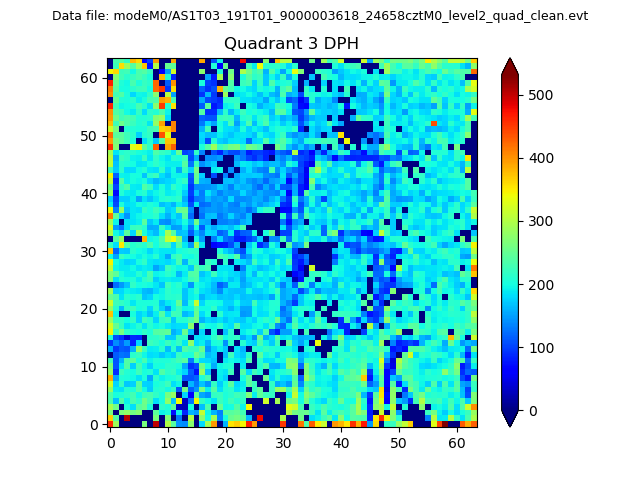 |
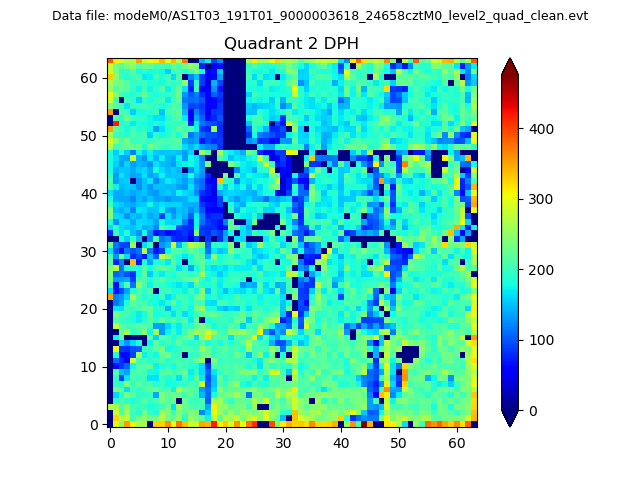 |
Quadrant C |
| Plot type | Count rate plots | Images |
|---|---|---|
| Comparison with Poisson distribution Blue bars denote a histogram of data divided into 1 sec bins. Red curve is a Poisson curve with rate = median count rate of data. |
 |
 |
| Quadrant-wise count rates Data is divided into 100 sec bins |
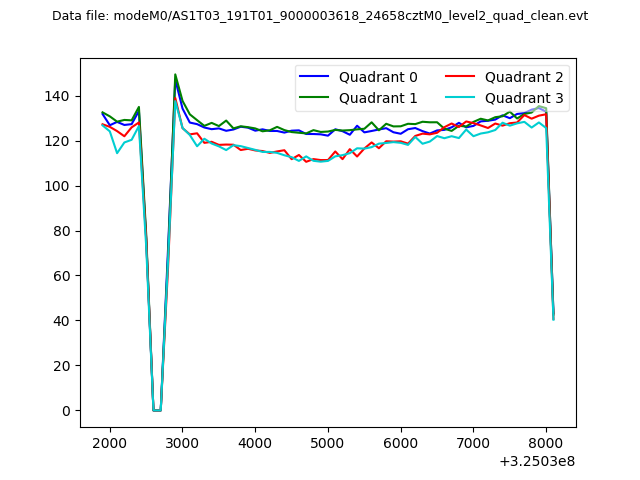 |
|
| Module-wise count rates for Quadrant A Data is divided into 100 sec bins |
 |
 |
| Module-wise count rates for Quadrant B Data is divided into 100 sec bins |
 |
 |
| Module-wise count rates for Quadrant C Data is divided into 100 sec bins |
 |
 |
| Module-wise count rates for Quadrant D Data is divided into 100 sec bins |
 |
 |
| Parameter | Plot |
|---|---|
| CZT HV Monitor | 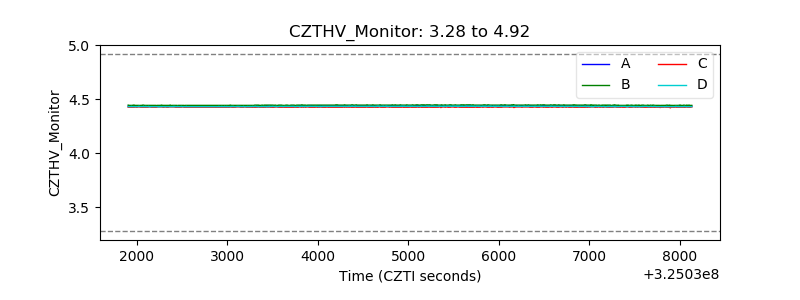 |
| D_VDD | 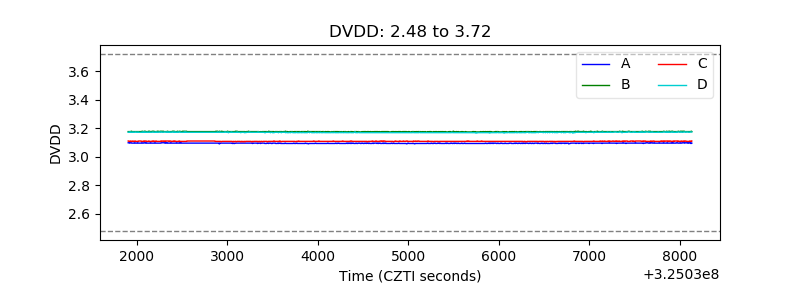 |
| Temperature 1 |  |
| Veto HV Monitor | 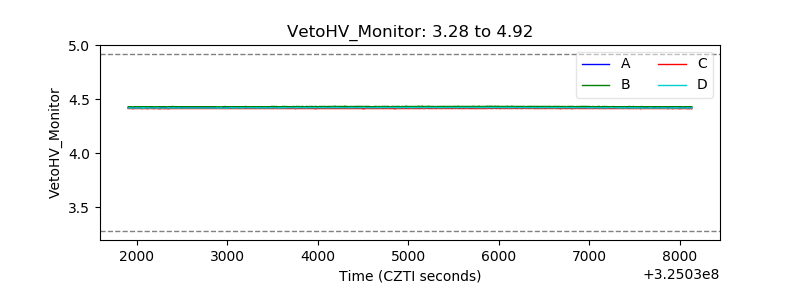 |
| Veto LLD | 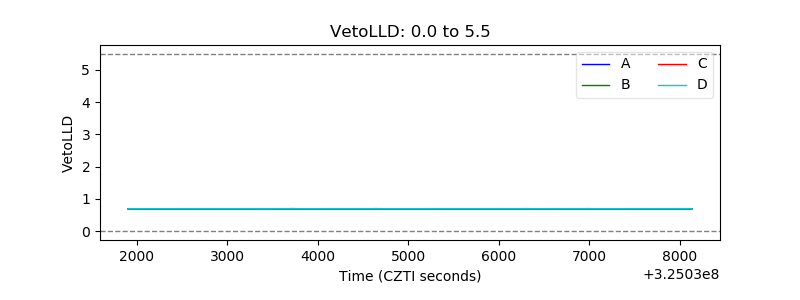 |
| Alpha Counter | 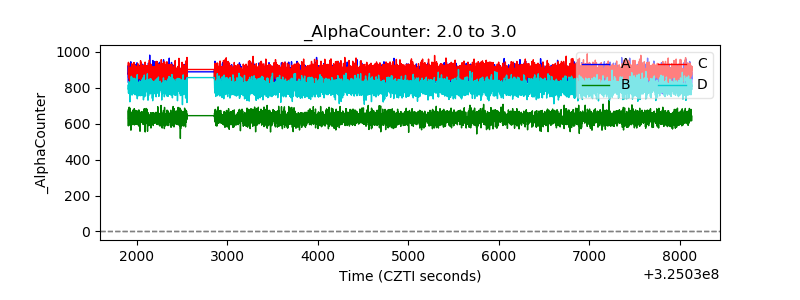 |
| _CPM_Rate | 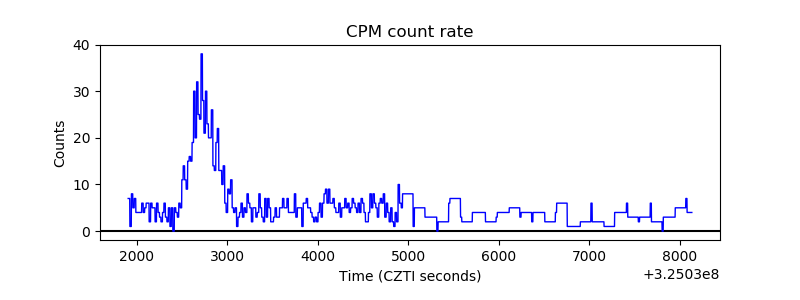 |
| CZT Counter | 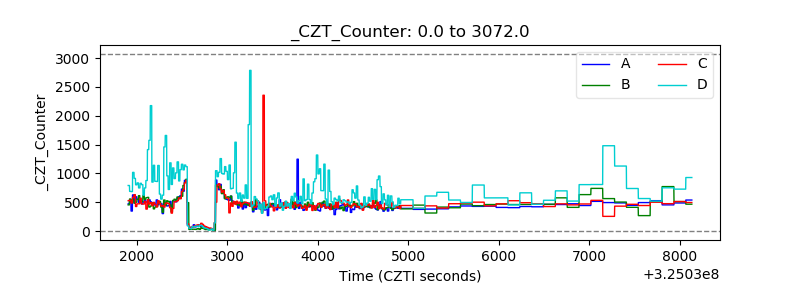 |
| +2.5 Volts monitor |  |
| +5 Volts monitor |  |
| _ROLL_ROT |  |
| _Roll_DEC |  |
| _Roll_RA | 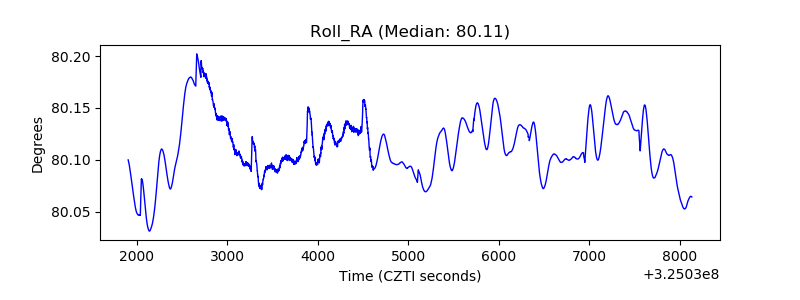 |
| Veto Counter | 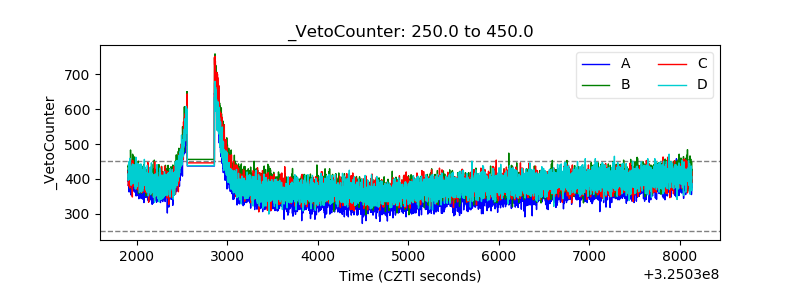 |