| Param | Original file | Final file |
|---|---|---|
| Filename | modeM0/AS1T03_191T01_9000003618_24660cztM0_level2.evt | modeM0/AS1T03_191T01_9000003618_24660cztM0_level2_quad_clean.evt |
| Size (bytes) | 2,333,370,240 | 536,984,640 |
| Size | 2.2 GB | 512.1 MB |
| Events in quadrant A | 13,397,628 | 3,712,937 |
| Events in quadrant B | 13,955,646 | 3,746,759 |
| Events in quadrant C | 14,007,122 | 3,555,029 |
| Events in quadrant D | 27,367,508 | 3,273,805 |
| Mode M9 | |||
|---|---|---|---|
| Quadrant | BADHDUFLAG | Total packets | Discarded packets |
| A | 0 | 33 | 0 |
| B | 0 | 33 | 0 |
| C | 0 | 33 | 0 |
| D | 0 | 33 | 0 |
| Mode M0 | |||
|---|---|---|---|
| Quadrant | BADHDUFLAG | Total packets | Discarded packets |
| A | 0 | 58733 | 5 |
| B | 0 | 59936 | 5 |
| C | 0 | 59410 | 5 |
| D | 0 | 100823 | 5 |
| Mode SS | |||
|---|---|---|---|
| Quadrant | BADHDUFLAG | Total packets | Discarded packets |
| A | 0 | 584 | 0 |
| B | 0 | 584 | 0 |
| C | 0 | 584 | 0 |
| D | 0 | 584 | 0 |
| Quadrant | Total seconds | Saturated seconds | Saturation percentage |
|---|---|---|---|
| A | 28755 | 217 | 0.754651% |
| B | 28756 | 292 | 1.015440% |
| C | 28756 | 405 | 1.408402% |
| D | 28756 | 3465 | 12.049659% |
Noise dominated data is calculated using 1-second bins in cleaned event files. If a bin has >2000 counts, and if more than 50% of those come from <1% of pixels, then it is considered to be noise-dominated and hence unusable.
| Quadrant | # 1 sec bins | Bins with >0 counts | Bins with >2000 counts | High rate bins dominated by noise | Noise dominated (total time) | Noise dominated (detector-on time) | Marked lightcurve |
|---|---|---|---|---|---|---|---|
| A | 32060 | 28758 | 6 | 6 | 0.02% | 0.02% | 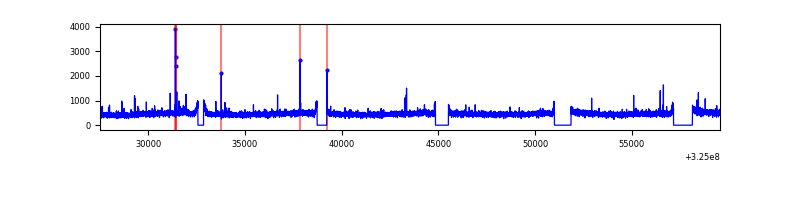 |
| B | 32061 | 28758 | 9 | 9 | 0.03% | 0.03% | 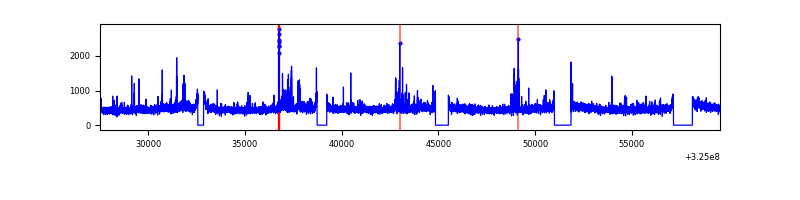 |
| C | 32061 | 28759 | 9 | 9 | 0.03% | 0.03% | 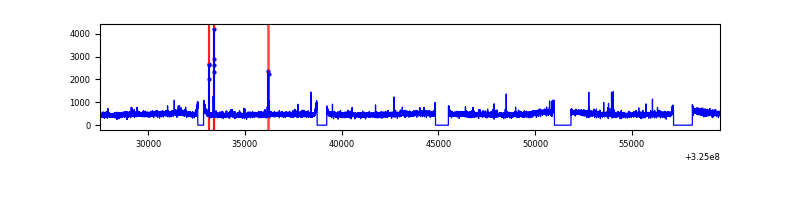 |
| D | 32061 | 28758 | 3150 | 3150 | 9.83% | 10.95% | 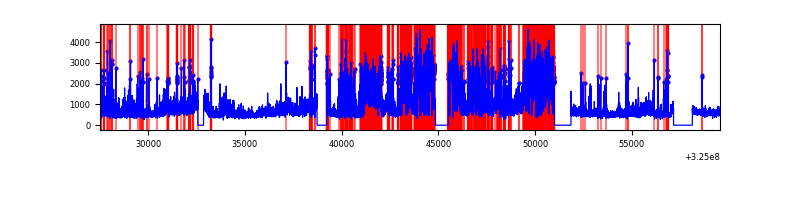 |
Top three noisy pixels from each quadrant. If the there are fewer than three noisy pixels in the level2.evt file, extra rows are filled as -1
| Pixel properties | Quadrant properties | ||||||
|---|---|---|---|---|---|---|---|
| Quadrant | DetID | PixID | Counts | Sigma | Mean | Median | Sigma |
| A | 6 | 16 | 51279 | 69.71 | 3449 | 3374 | 687.2 |
| A | 13 | 254 | 49475 | 67.09 | 3449 | 3374 | 687.2 |
| A | 3 | 137 | 31243 | 40.56 | 3449 | 3374 | 687.2 |
| B | 0 | 190 | 235077 | 360.98 | 3418 | 3329 | 642.0 |
| B | 0 | 230 | 108652 | 164.05 | 3418 | 3329 | 642.0 |
| B | 0 | 189 | 107720 | 162.6 | 3418 | 3329 | 642.0 |
| C | 14 | 238 | 529751 | 687.33 | 3296 | 3305 | 765.9 |
| C | 10 | 91 | 333856 | 431.57 | 3296 | 3305 | 765.9 |
| C | 7 | 247 | 174775 | 223.87 | 3296 | 3305 | 765.9 |
| D | 1 | 52 | 10621491 | 13846.89 | 3178 | 3083 | 766.8 |
| D | 8 | 195 | 4075923 | 5311.17 | 3178 | 3083 | 766.8 |
| D | 7 | 238 | 215831 | 277.43 | 3178 | 3083 | 766.8 |
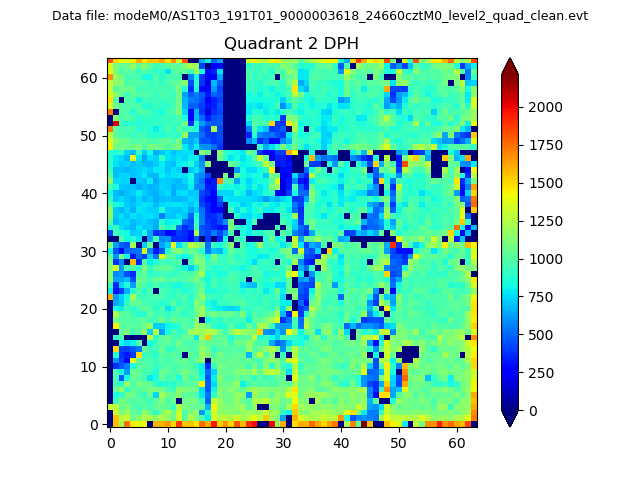
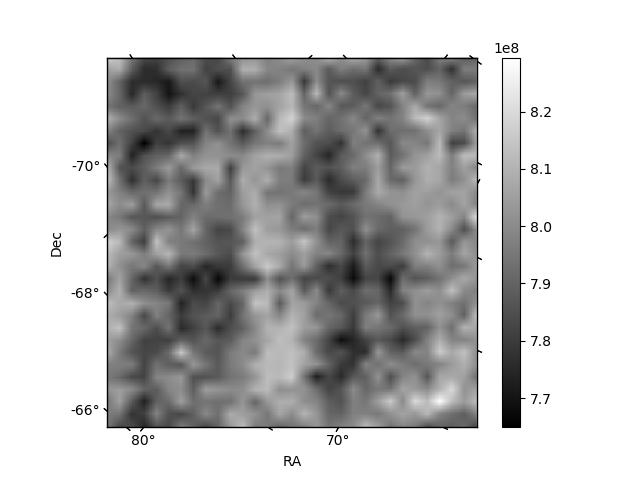
Histogram calculated using DETX and DETY for each event in the final _common_clean file
| Quadrant A | 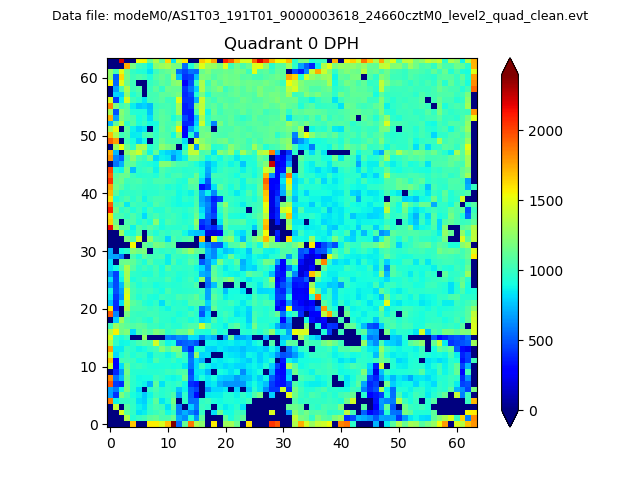 |
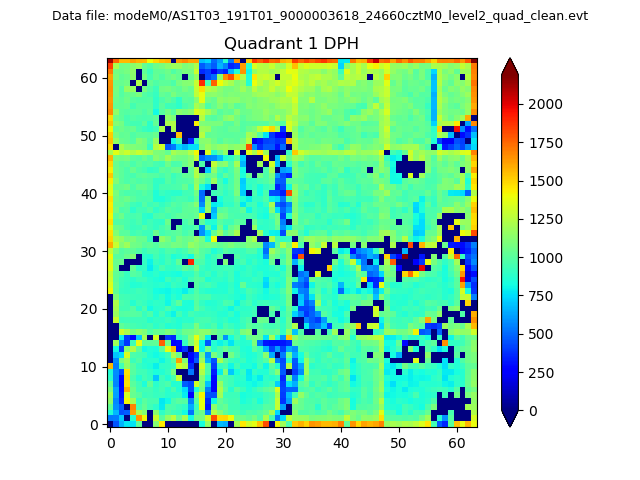 |
Quadrant B |
|---|---|---|---|
| Quadrant D | 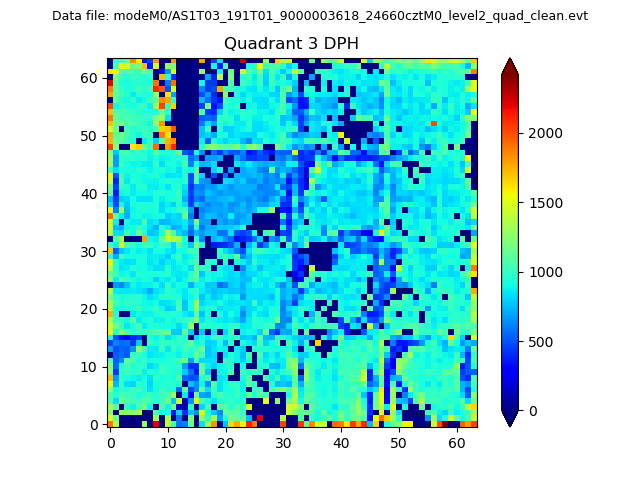 |
 |
Quadrant C |
| Plot type | Count rate plots | Images |
|---|---|---|
| Comparison with Poisson distribution Blue bars denote a histogram of data divided into 1 sec bins. Red curve is a Poisson curve with rate = median count rate of data. |
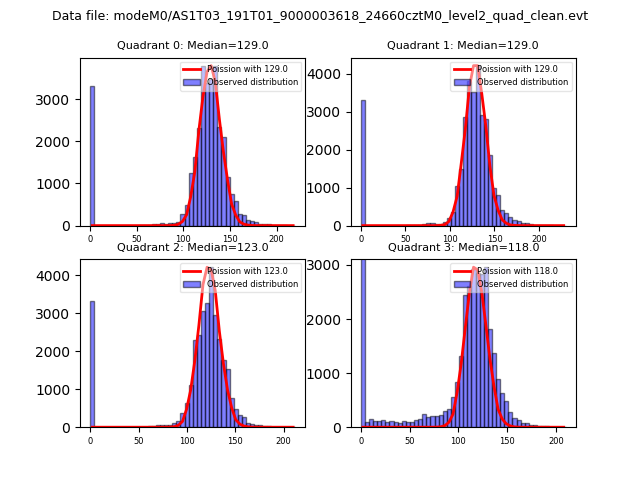 |
 |
| Quadrant-wise count rates Data is divided into 100 sec bins |
 |
|
| Module-wise count rates for Quadrant A Data is divided into 100 sec bins |
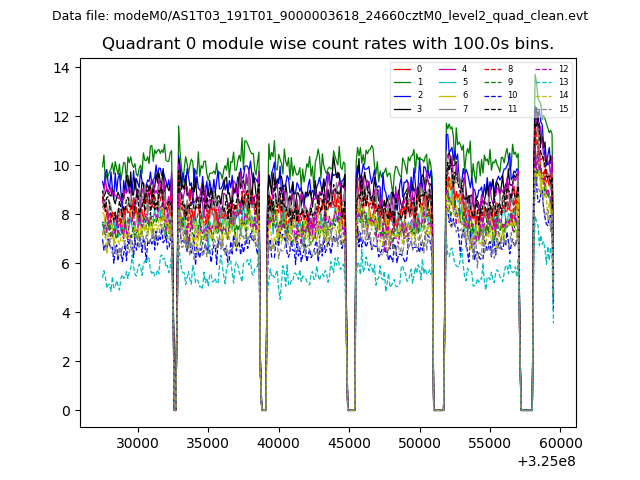 |
 |
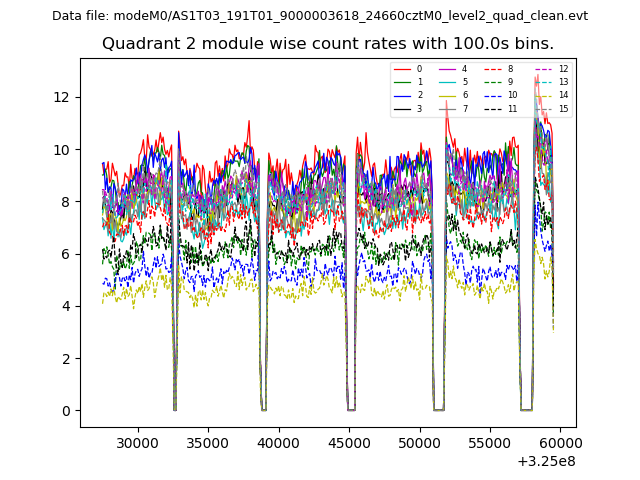
| Module-wise count rates for Quadrant B Data is divided into 100 sec bins |
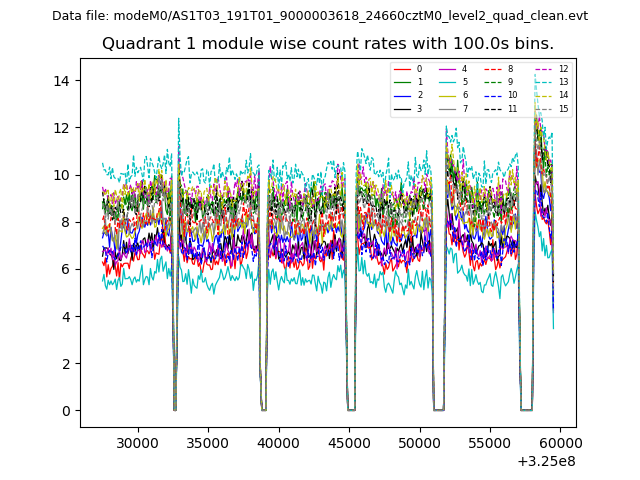 |
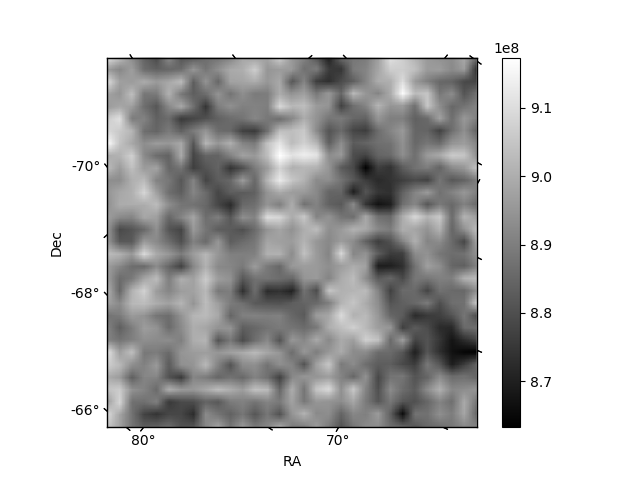 |
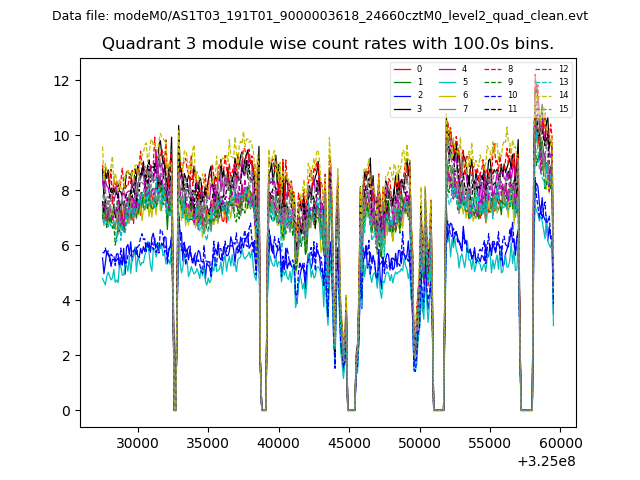
| Module-wise count rates for Quadrant C Data is divided into 100 sec bins |
 |
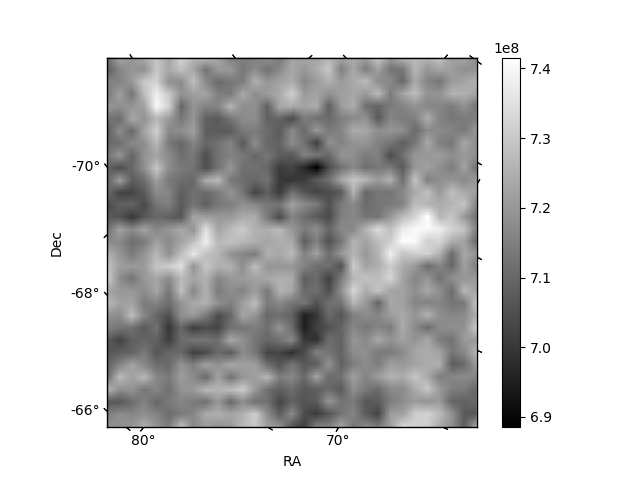 |
| Module-wise count rates for Quadrant D Data is divided into 100 sec bins |
 |
 |
| Parameter | Plot |
|---|---|
| CZT HV Monitor | 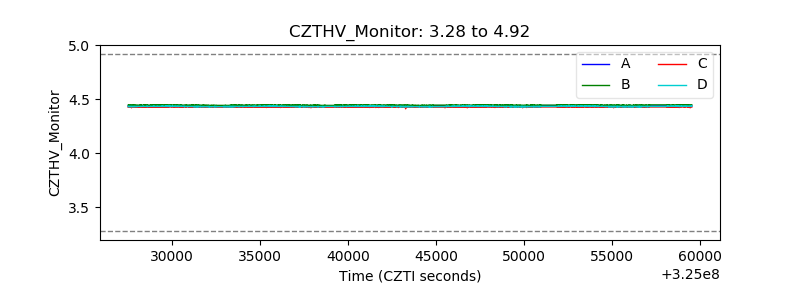 |
| D_VDD | 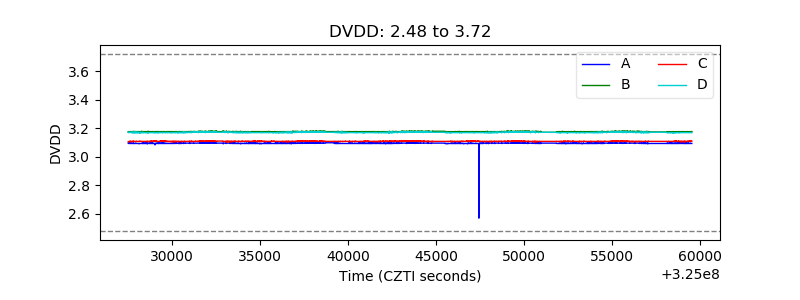 |
| Temperature 1 | 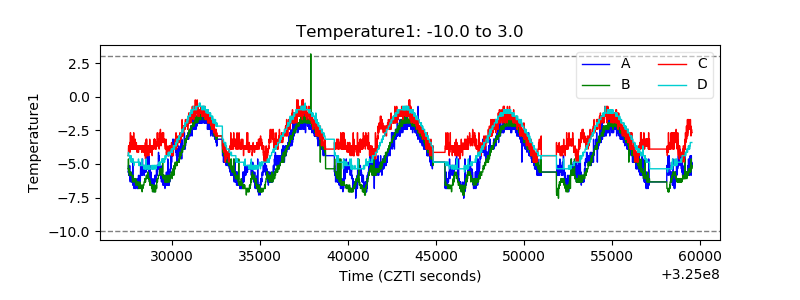 |
| Veto HV Monitor | 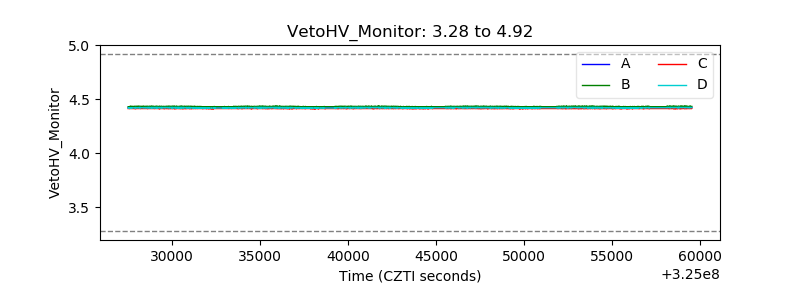 |
| Veto LLD | 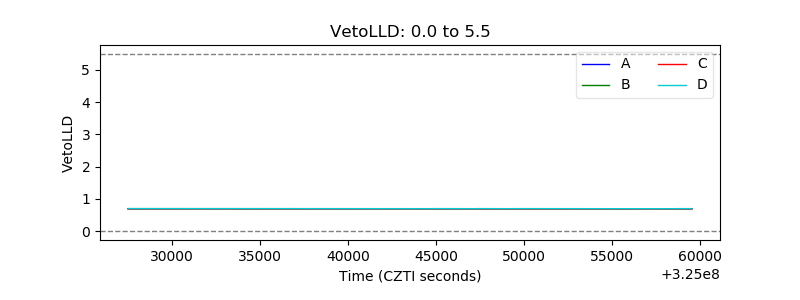 |
| Alpha Counter | 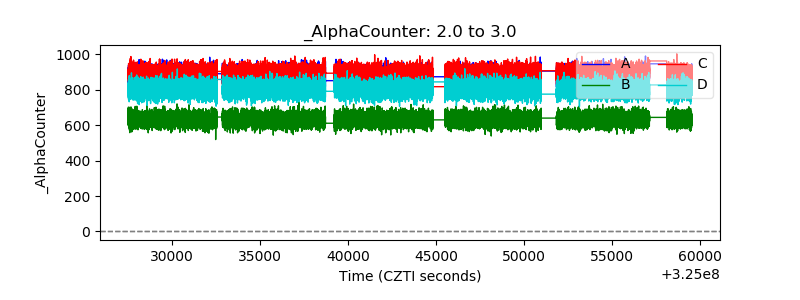 |
| _CPM_Rate | 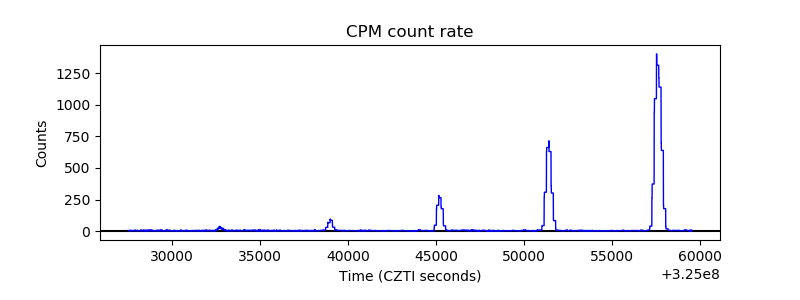 |
| CZT Counter | 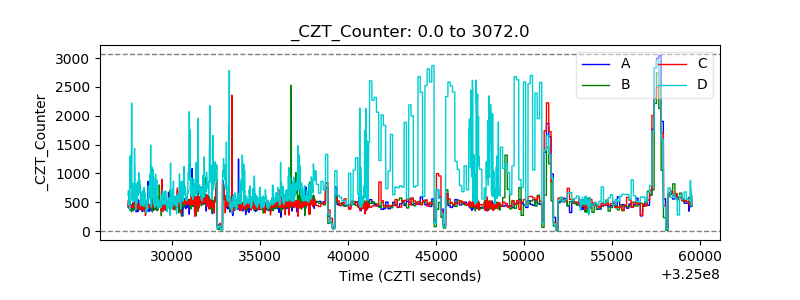 |
| +2.5 Volts monitor |  |
| +5 Volts monitor |  |
| _ROLL_ROT | 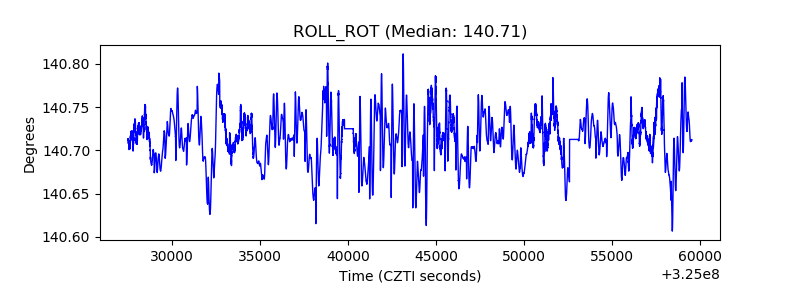 |
| _Roll_DEC | 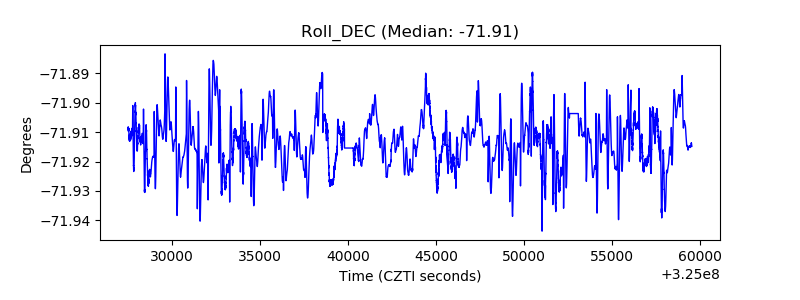 |
| _Roll_RA |  |
| Veto Counter | 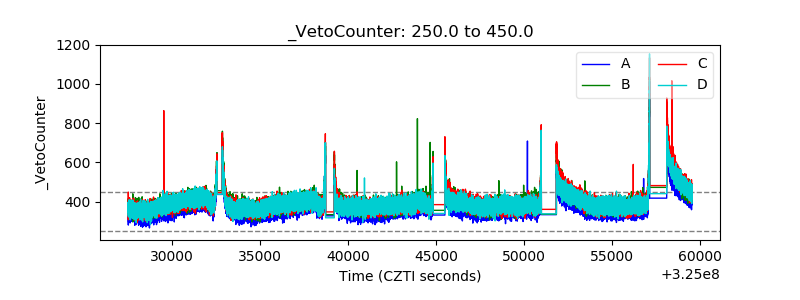 |