| Param | Original file | Final file |
|---|---|---|
| Filename | modeM0/AS1T03_191T01_9000003618_24662cztM0_level2.evt | modeM0/AS1T03_191T01_9000003618_24662cztM0_level2_quad_clean.evt |
| Size (bytes) | 437,569,920 | 126,800,640 |
| Size | 417.3 MB | 120.9 MB |
| Events in quadrant A | 2,995,857 | 870,493 |
| Events in quadrant B | 3,009,375 | 880,375 |
| Events in quadrant C | 3,050,669 | 842,607 |
| Events in quadrant D | 3,787,211 | 827,137 |
| Mode M9 | |||
|---|---|---|---|
| Quadrant | BADHDUFLAG | Total packets | Discarded packets |
| A | 0 | 12 | 0 |
| B | 0 | 12 | 0 |
| C | 0 | 12 | 0 |
| D | 0 | 12 | 0 |
| Mode M0 | |||
|---|---|---|---|
| Quadrant | BADHDUFLAG | Total packets | Discarded packets |
| A | 0 | 12752 | 1 |
| B | 0 | 12776 | 1 |
| C | 0 | 12902 | 1 |
| D | 0 | 15243 | 1 |
| Mode SS | |||
|---|---|---|---|
| Quadrant | BADHDUFLAG | Total packets | Discarded packets |
| A | 0 | 122 | 0 |
| B | 0 | 122 | 0 |
| C | 0 | 122 | 0 |
| D | 0 | 122 | 0 |
| Quadrant | Total seconds | Saturated seconds | Saturation percentage |
|---|---|---|---|
| A | 6016 | 29 | 0.482048% |
| B | 6017 | 37 | 0.614924% |
| C | 6017 | 76 | 1.263088% |
| D | 6017 | 60 | 0.997175% |
Noise dominated data is calculated using 1-second bins in cleaned event files. If a bin has >2000 counts, and if more than 50% of those come from <1% of pixels, then it is considered to be noise-dominated and hence unusable.
| Quadrant | # 1 sec bins | Bins with >0 counts | Bins with >2000 counts | High rate bins dominated by noise | Noise dominated (total time) | Noise dominated (detector-on time) | Marked lightcurve |
|---|---|---|---|---|---|---|---|
| A | 7166 | 6017 | 2 | 2 | 0.03% | 0.03% | 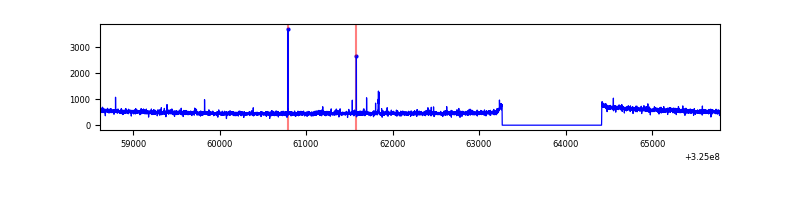 |
| B | 7167 | 6017 | 1 | 1 | 0.01% | 0.02% | 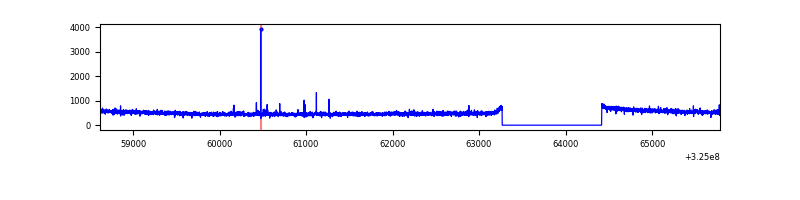 |
| C | 7167 | 6017 | 0 | 0 | 0.00% | 0.00% | 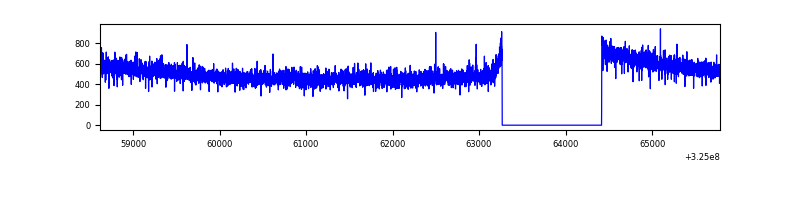 |
| D | 7167 | 6018 | 32 | 32 | 0.45% | 0.53% | 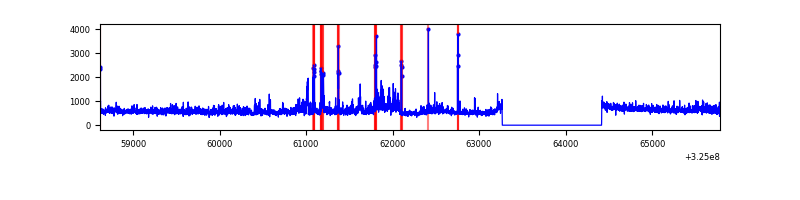 |
Top three noisy pixels from each quadrant. If the there are fewer than three noisy pixels in the level2.evt file, extra rows are filled as -1
| Pixel properties | Quadrant properties | ||||||
|---|---|---|---|---|---|---|---|
| Quadrant | DetID | PixID | Counts | Sigma | Mean | Median | Sigma |
| A | 4 | 2 | 12038 | 73.61 | 771 | 755 | 153.3 |
| A | 13 | 254 | 9298 | 55.74 | 771 | 755 | 153.3 |
| A | 6 | 16 | 8695 | 51.8 | 771 | 755 | 153.3 |
| B | 12 | 111 | 16976 | 113.04 | 760 | 742 | 143.6 |
| B | 11 | 111 | 15175 | 100.5 | 760 | 742 | 143.6 |
| B | 14 | 111 | 13921 | 91.77 | 760 | 742 | 143.6 |
| C | 14 | 238 | 120553 | 696.93 | 740 | 745 | 171.9 |
| C | 10 | 91 | 41729 | 238.41 | 740 | 745 | 171.9 |
| C | 13 | 61 | 5148 | 25.61 | 740 | 745 | 171.9 |
| D | 8 | 195 | 657802 | 3641.95 | 753 | 731 | 180.4 |
| D | 1 | 52 | 235453 | 1300.99 | 753 | 731 | 180.4 |
| D | 7 | 238 | 28000 | 151.14 | 753 | 731 | 180.4 |
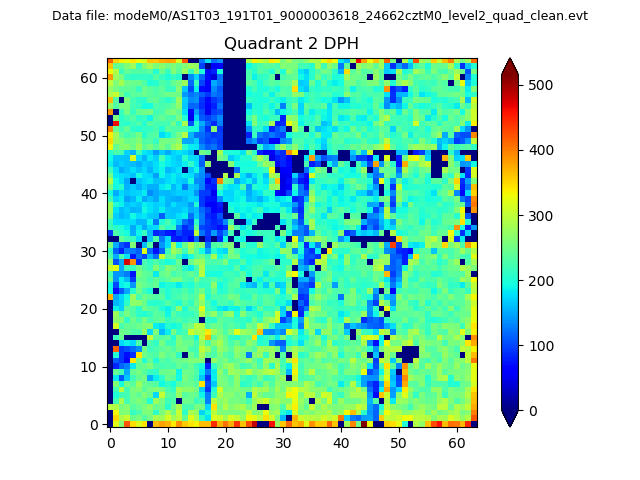
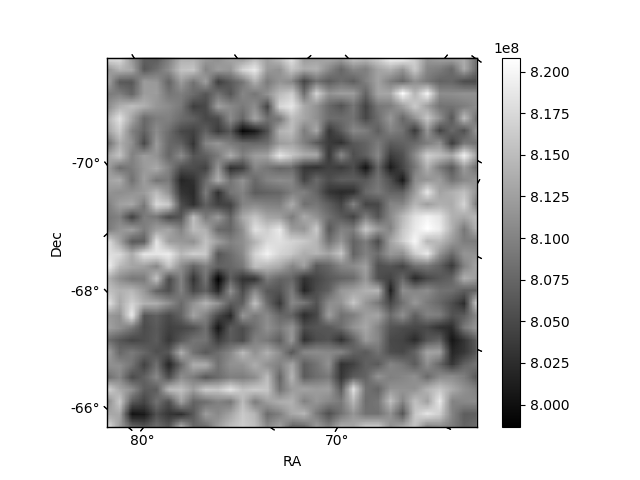
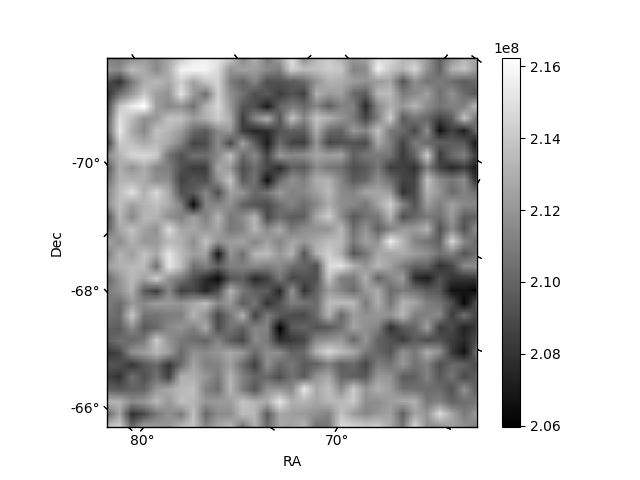
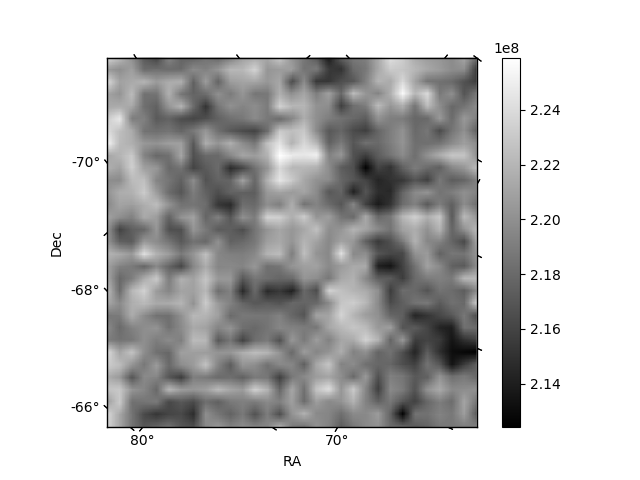
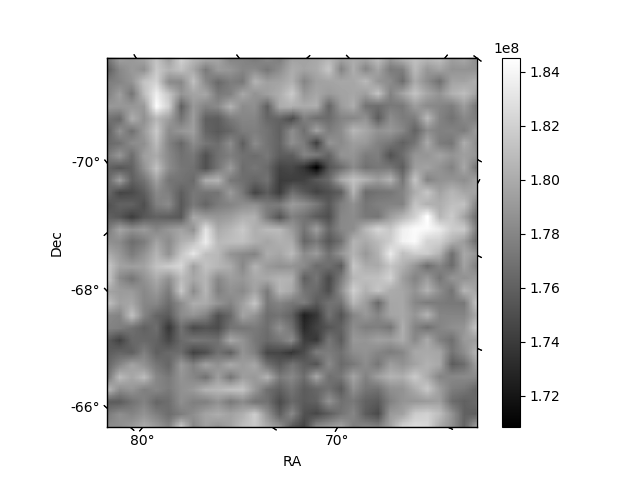
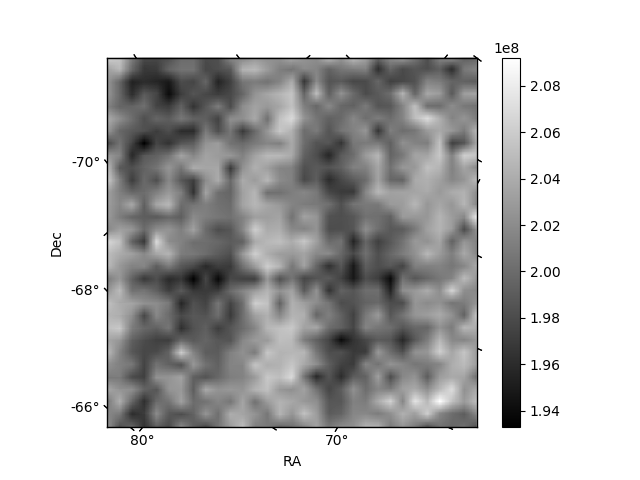
Histogram calculated using DETX and DETY for each event in the final _common_clean file
| Quadrant A | 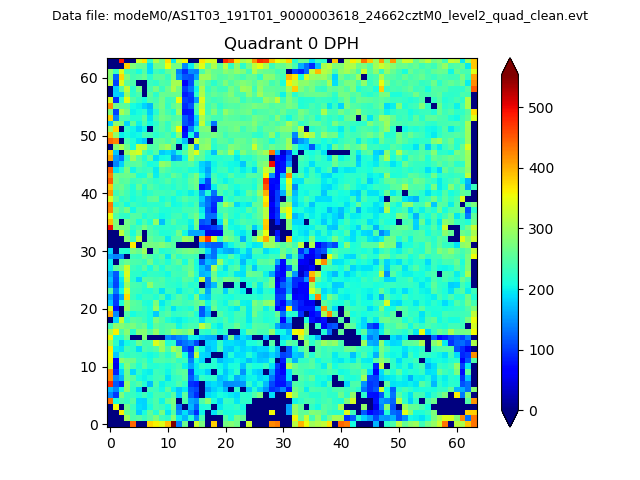 |
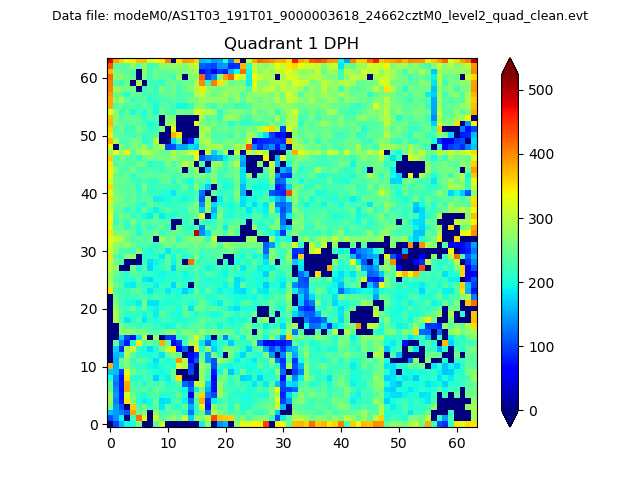 |
Quadrant B |
|---|---|---|---|
| Quadrant D | 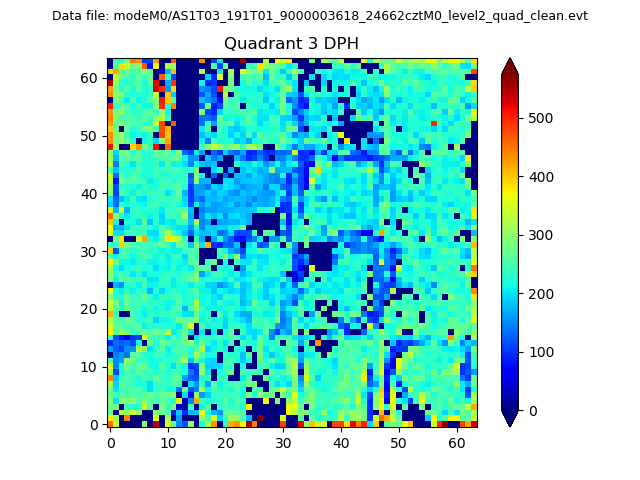 |
 |
Quadrant C |
| Plot type | Count rate plots | Images |
|---|---|---|
| Comparison with Poisson distribution Blue bars denote a histogram of data divided into 1 sec bins. Red curve is a Poisson curve with rate = median count rate of data. |
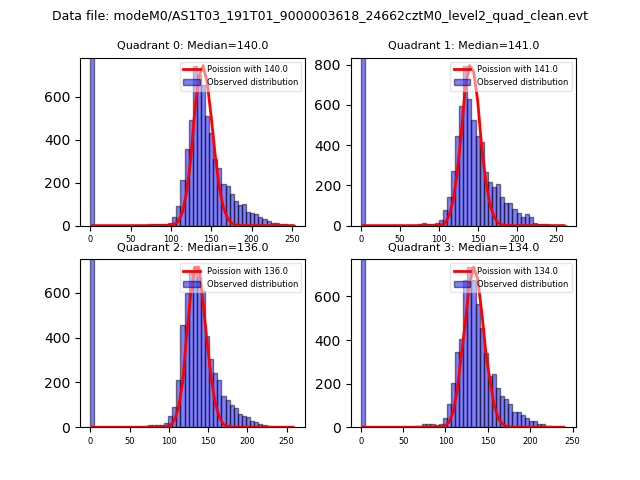 |
 |
| Quadrant-wise count rates Data is divided into 100 sec bins |
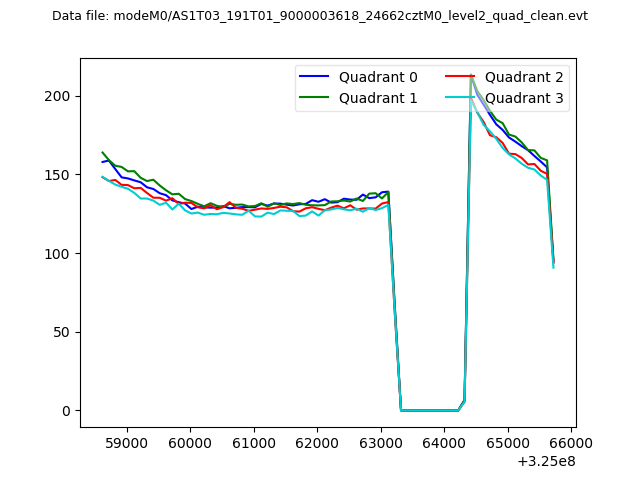 |
|
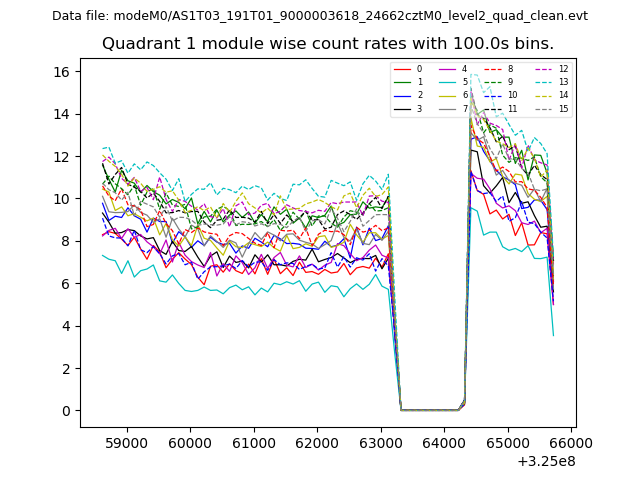
| Module-wise count rates for Quadrant A Data is divided into 100 sec bins |
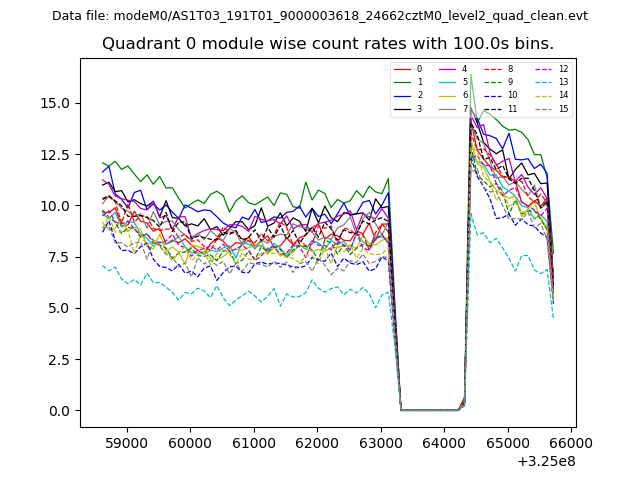 |
 |
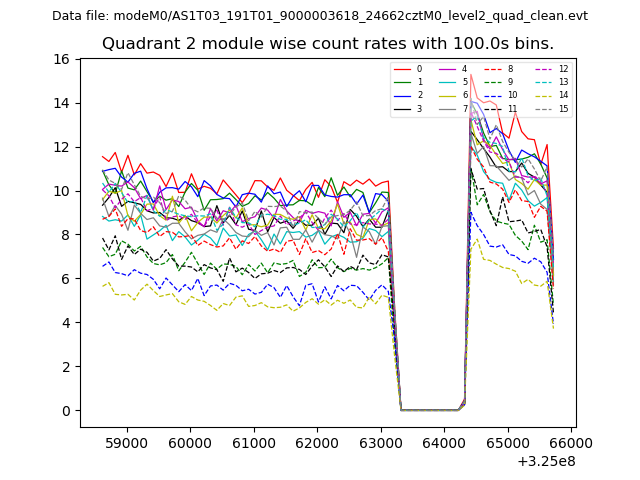
| Module-wise count rates for Quadrant B Data is divided into 100 sec bins |
 |
 |
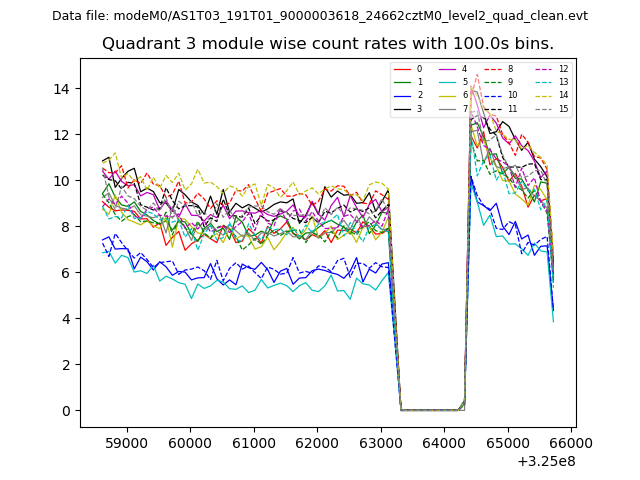
| Module-wise count rates for Quadrant C Data is divided into 100 sec bins |
 |
 |
| Module-wise count rates for Quadrant D Data is divided into 100 sec bins |
 |
 |
| Parameter | Plot |
|---|---|
| CZT HV Monitor | 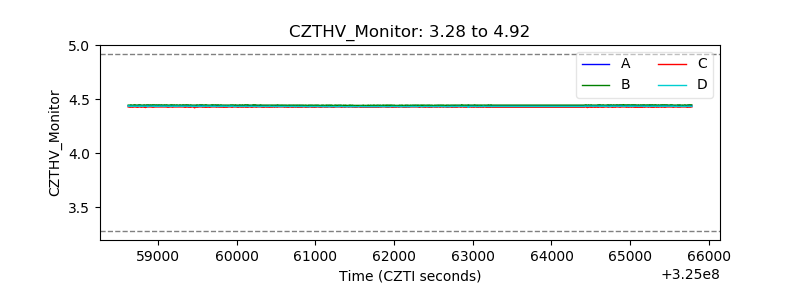 |
| D_VDD | 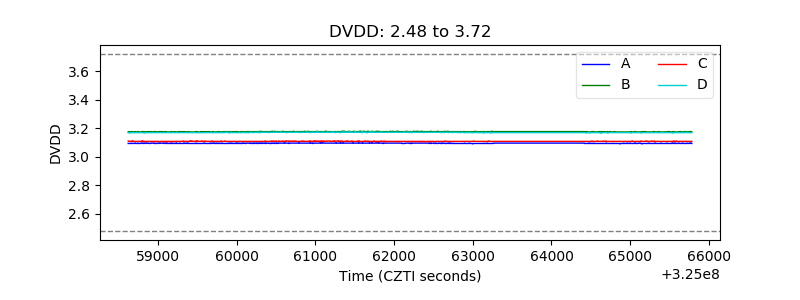 |
| Temperature 1 | 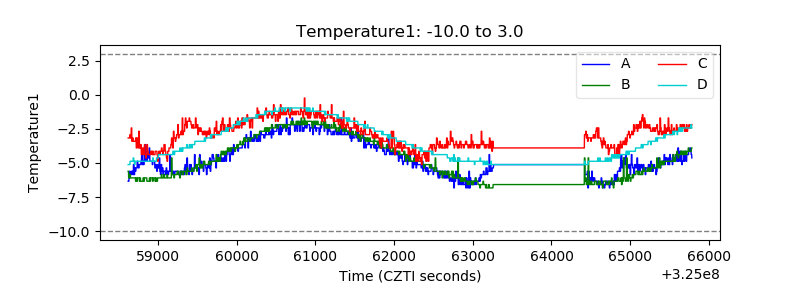 |
| Veto HV Monitor | 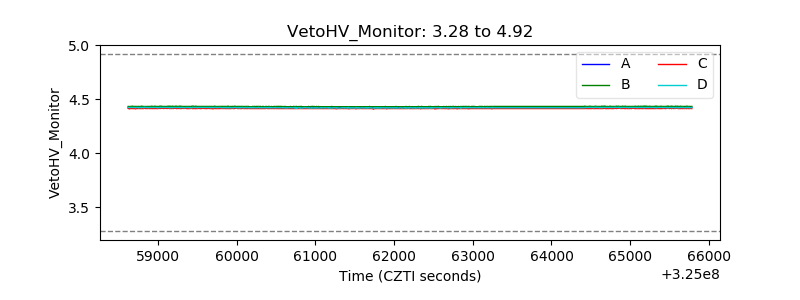 |
| Veto LLD | 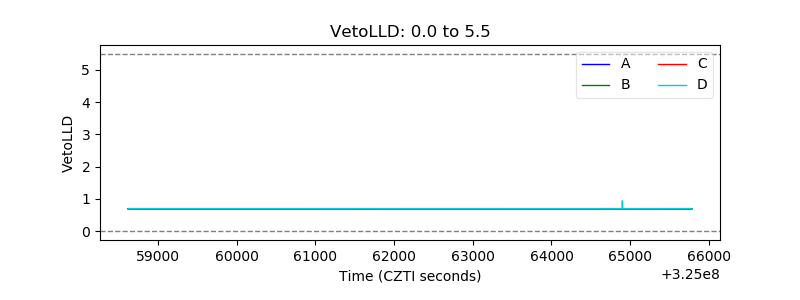 |
| Alpha Counter | 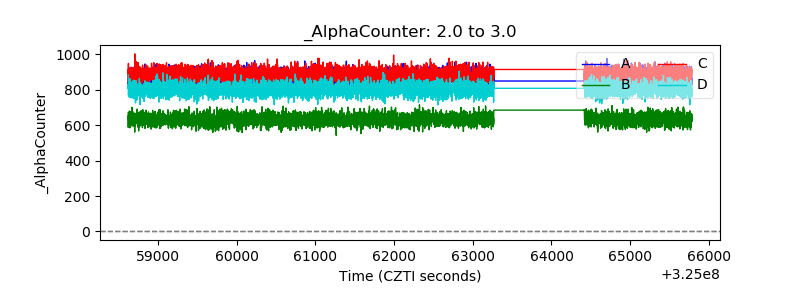 |
| _CPM_Rate | 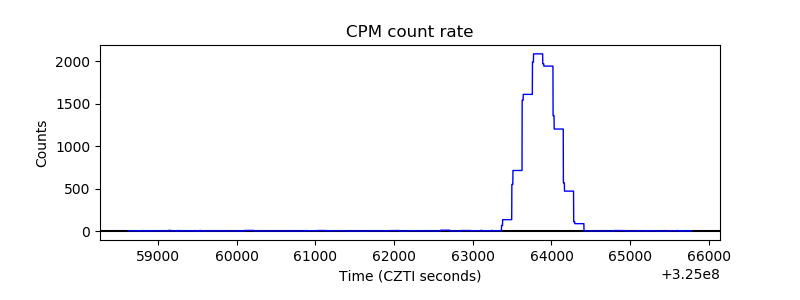 |
| CZT Counter | 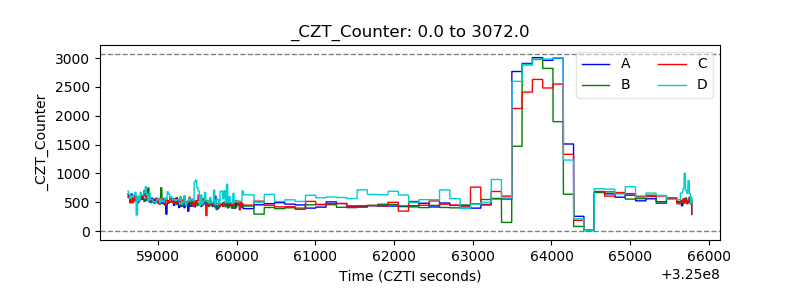 |
| +2.5 Volts monitor |  |
| +5 Volts monitor | 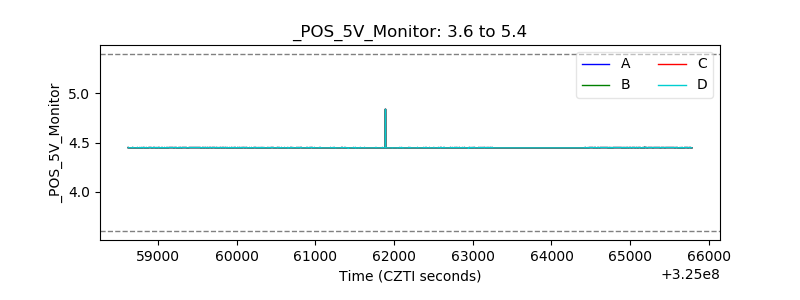 |
| _ROLL_ROT | 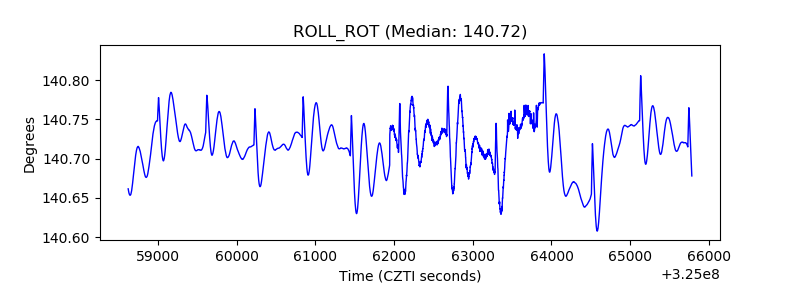 |
| _Roll_DEC | 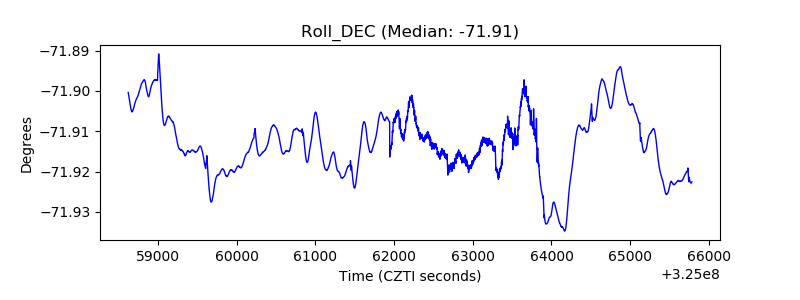 |
| _Roll_RA | 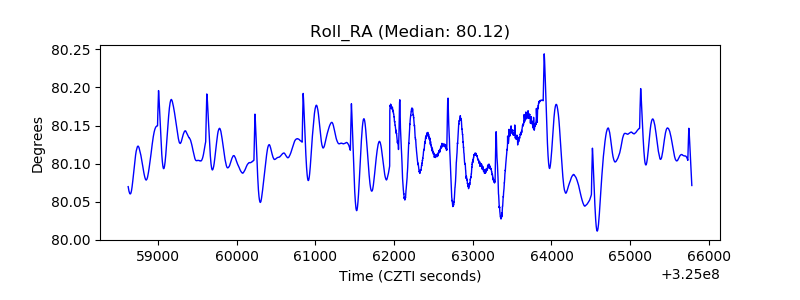 |
| Veto Counter | 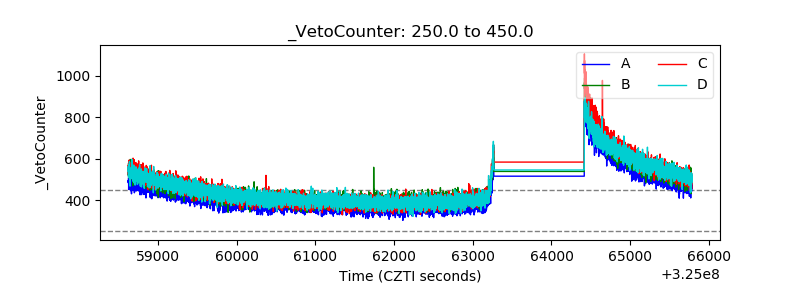 |