| Param | Original file | Final file |
|---|---|---|
| Filename | modeM0/AS1T03_191T01_9000003618_24663cztM0_level2.evt | modeM0/AS1T03_191T01_9000003618_24663cztM0_level2_quad_clean.evt |
| Size (bytes) | 444,769,920 | 133,444,800 |
| Size | 424.2 MB | 127.3 MB |
| Events in quadrant A | 3,081,187 | 924,592 |
| Events in quadrant B | 3,125,765 | 929,219 |
| Events in quadrant C | 3,137,048 | 886,569 |
| Events in quadrant D | 3,717,413 | 881,705 |
| Mode M9 | |||
|---|---|---|---|
| Quadrant | BADHDUFLAG | Total packets | Discarded packets |
| A | 0 | 12 | 0 |
| B | 0 | 12 | 0 |
| C | 0 | 12 | 0 |
| D | 0 | 12 | 0 |
| Mode M0 | |||
|---|---|---|---|
| Quadrant | BADHDUFLAG | Total packets | Discarded packets |
| A | 0 | 12913 | 1 |
| B | 0 | 13010 | 1 |
| C | 0 | 13015 | 1 |
| D | 0 | 15107 | 1 |
| Mode SS | |||
|---|---|---|---|
| Quadrant | BADHDUFLAG | Total packets | Discarded packets |
| A | 0 | 122 | 0 |
| B | 0 | 122 | 0 |
| C | 0 | 122 | 0 |
| D | 0 | 122 | 0 |
| Quadrant | Total seconds | Saturated seconds | Saturation percentage |
|---|---|---|---|
| A | 6014 | 32 | 0.532092% |
| B | 6014 | 41 | 0.681743% |
| C | 6015 | 93 | 1.546135% |
| D | 6015 | 58 | 0.964256% |
Noise dominated data is calculated using 1-second bins in cleaned event files. If a bin has >2000 counts, and if more than 50% of those come from <1% of pixels, then it is considered to be noise-dominated and hence unusable.
| Quadrant | # 1 sec bins | Bins with >0 counts | Bins with >2000 counts | High rate bins dominated by noise | Noise dominated (total time) | Noise dominated (detector-on time) | Marked lightcurve |
|---|---|---|---|---|---|---|---|
| A | 7249 | 6014 | 0 | 0 | 0.00% | 0.00% | 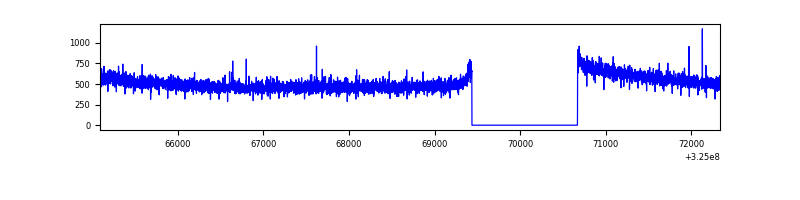 |
| B | 7249 | 6015 | 1 | 1 | 0.01% | 0.02% | 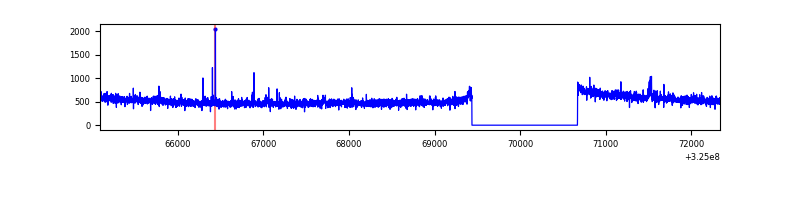 |
| C | 7250 | 6015 | 0 | 0 | 0.00% | 0.00% | 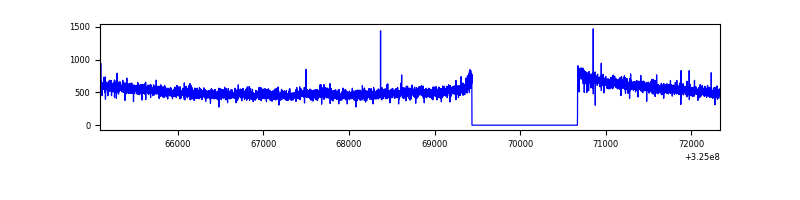 |
| D | 7250 | 6015 | 31 | 31 | 0.43% | 0.52% | 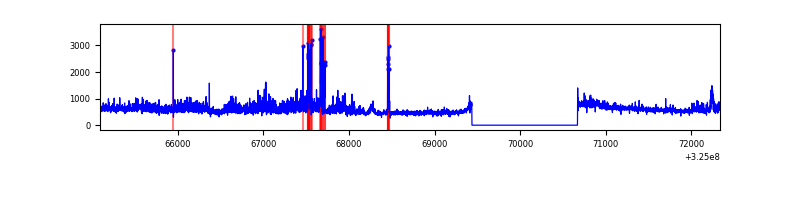 |
Top three noisy pixels from each quadrant. If the there are fewer than three noisy pixels in the level2.evt file, extra rows are filled as -1
| Pixel properties | Quadrant properties | ||||||
|---|---|---|---|---|---|---|---|
| Quadrant | DetID | PixID | Counts | Sigma | Mean | Median | Sigma |
| A | 13 | 254 | 9355 | 54.83 | 798 | 785 | 156.3 |
| A | 0 | 226 | 6873 | 38.95 | 798 | 785 | 156.3 |
| A | 3 | 137 | 6615 | 37.3 | 798 | 785 | 156.3 |
| B | 0 | 230 | 22333 | 148.92 | 781 | 764 | 144.8 |
| B | 0 | 189 | 17601 | 116.25 | 781 | 764 | 144.8 |
| B | 12 | 111 | 16914 | 111.5 | 781 | 764 | 144.8 |
| C | 14 | 238 | 124043 | 715.67 | 756 | 764 | 172.3 |
| C | 10 | 91 | 56197 | 321.81 | 756 | 764 | 172.3 |
| C | 13 | 61 | 5193 | 25.71 | 756 | 764 | 172.3 |
| D | 8 | 195 | 504075 | 2722.3 | 776 | 756 | 184.9 |
| D | 1 | 52 | 150652 | 810.74 | 776 | 756 | 184.9 |
| D | 12 | 235 | 69273 | 370.59 | 776 | 756 | 184.9 |
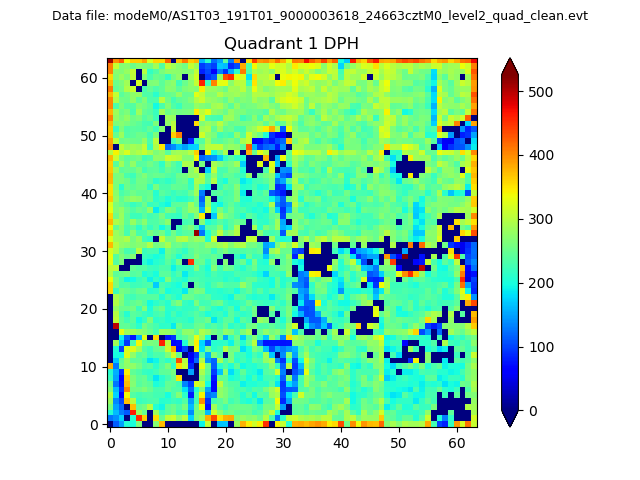
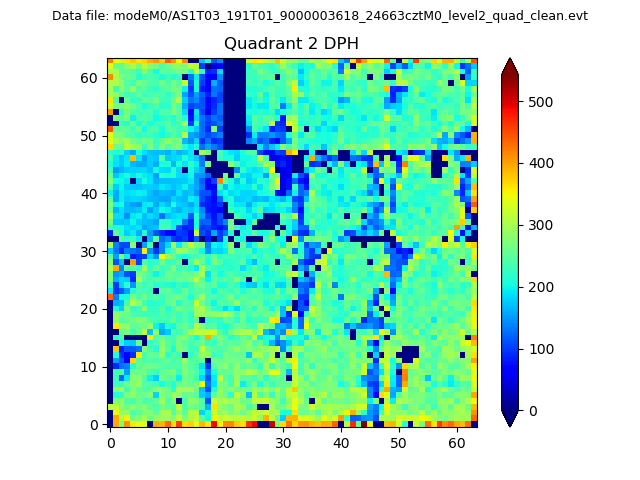
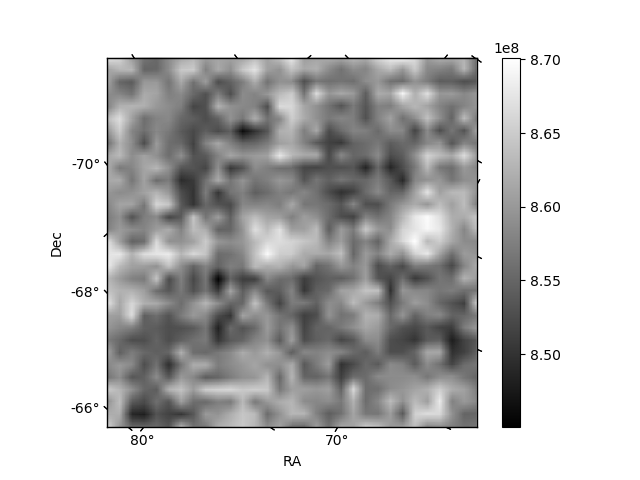
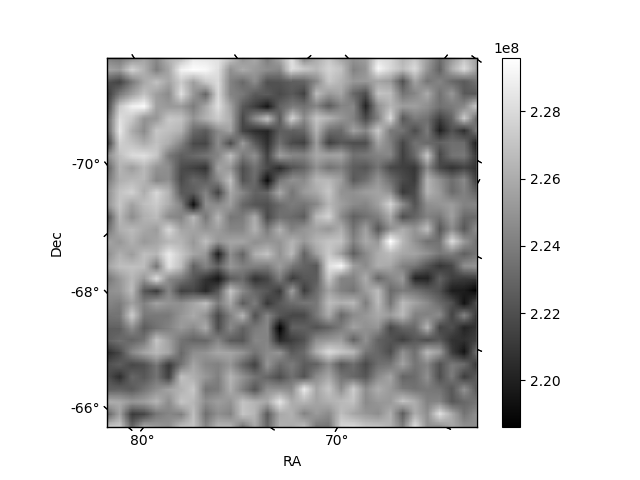
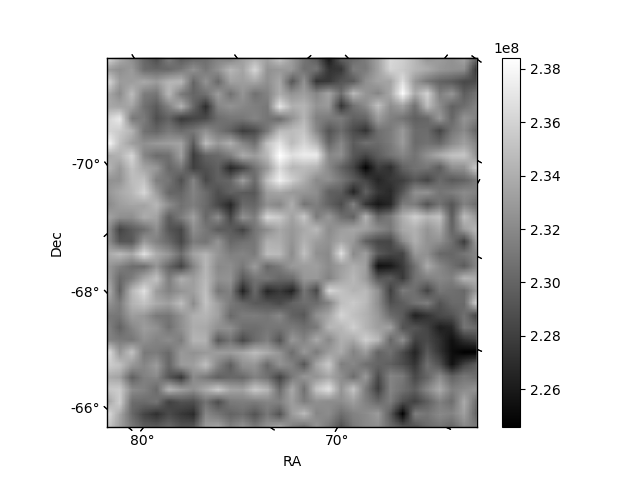
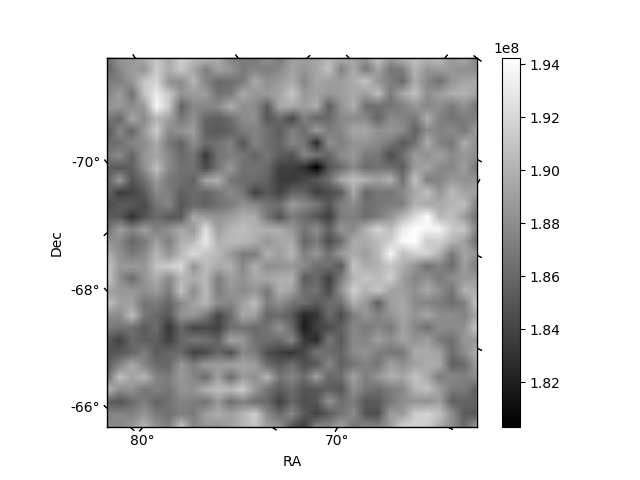
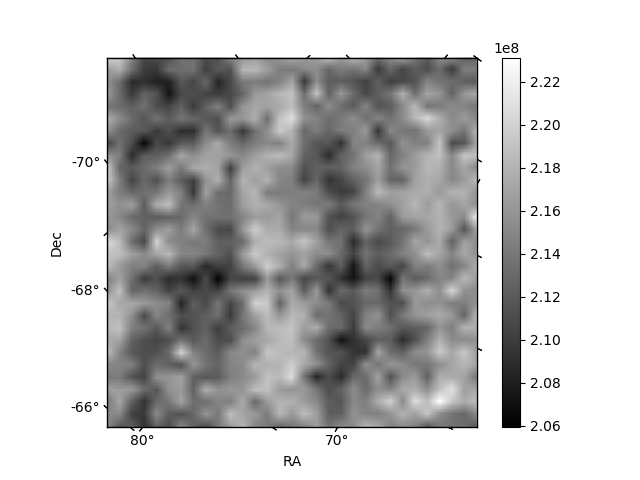
Histogram calculated using DETX and DETY for each event in the final _common_clean file
| Quadrant A |  |
 |
Quadrant B |
|---|---|---|---|
| Quadrant D | 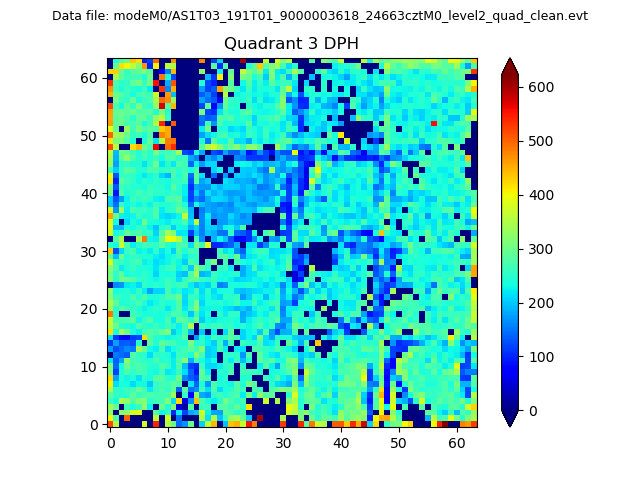 |
 |
Quadrant C |
| Plot type | Count rate plots | Images |
|---|---|---|
| Comparison with Poisson distribution Blue bars denote a histogram of data divided into 1 sec bins. Red curve is a Poisson curve with rate = median count rate of data. |
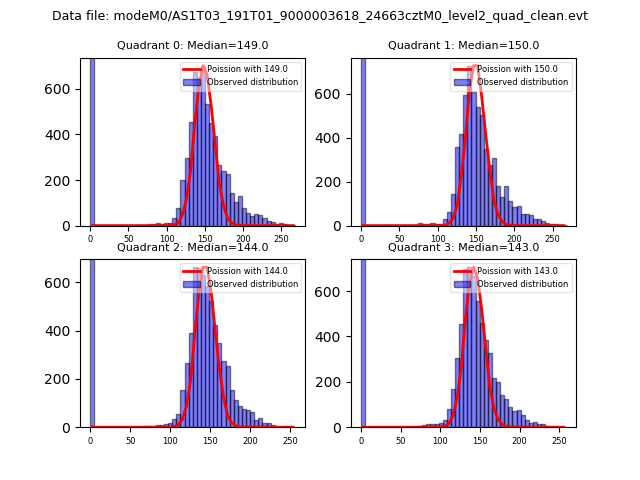 |
 |
| Quadrant-wise count rates Data is divided into 100 sec bins |
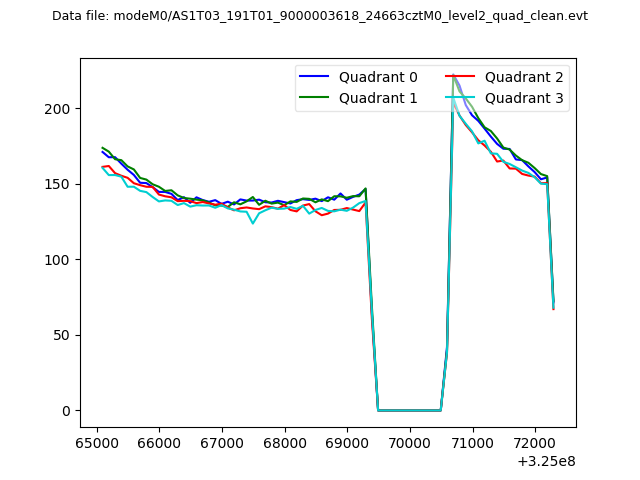 |
|
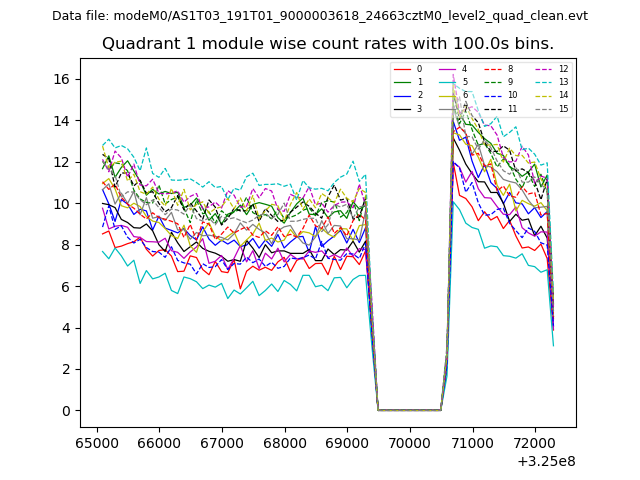
| Module-wise count rates for Quadrant A Data is divided into 100 sec bins |
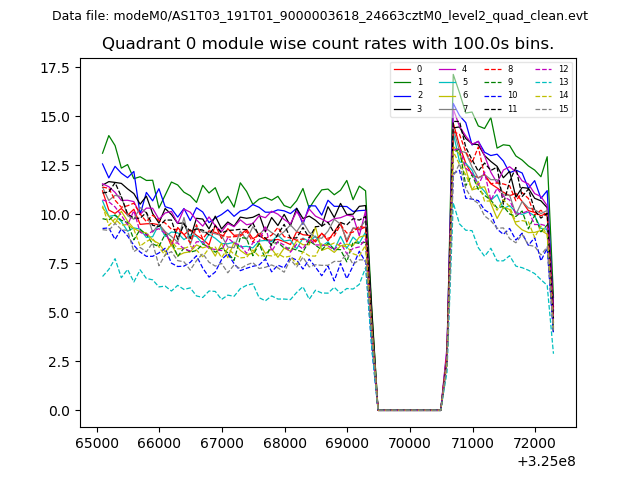 |
 |
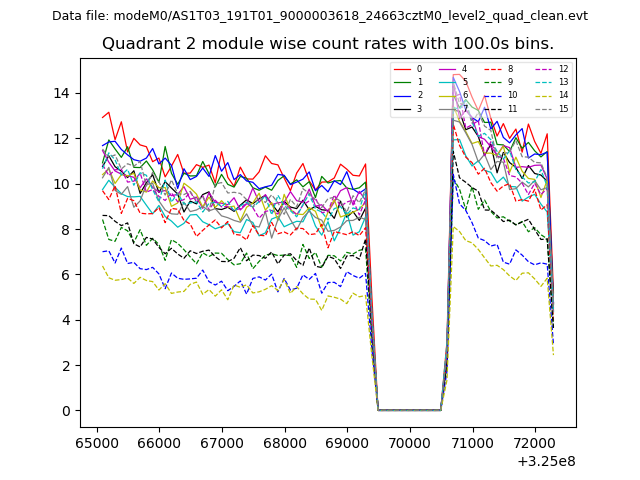
| Module-wise count rates for Quadrant B Data is divided into 100 sec bins |
 |
 |
| Module-wise count rates for Quadrant C Data is divided into 100 sec bins |
 |
 |
| Module-wise count rates for Quadrant D Data is divided into 100 sec bins |
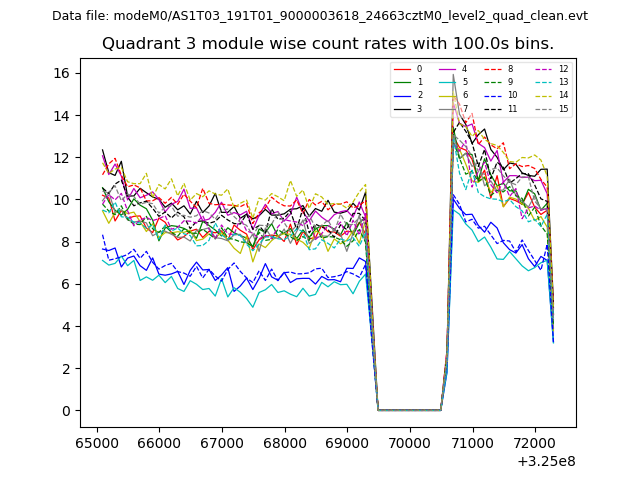 |
 |
| Parameter | Plot |
|---|---|
| CZT HV Monitor | 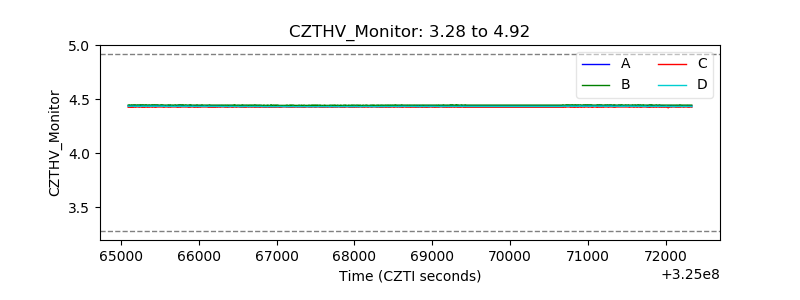 |
| D_VDD | 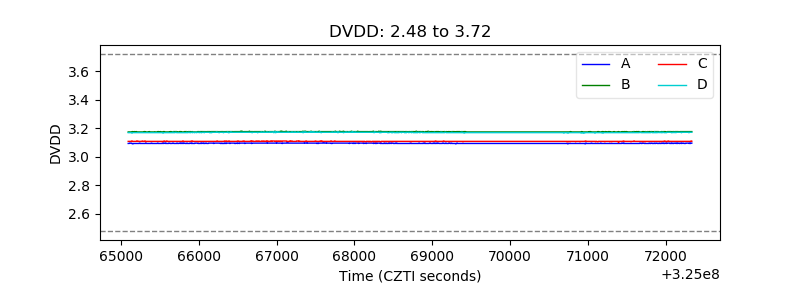 |
| Temperature 1 | 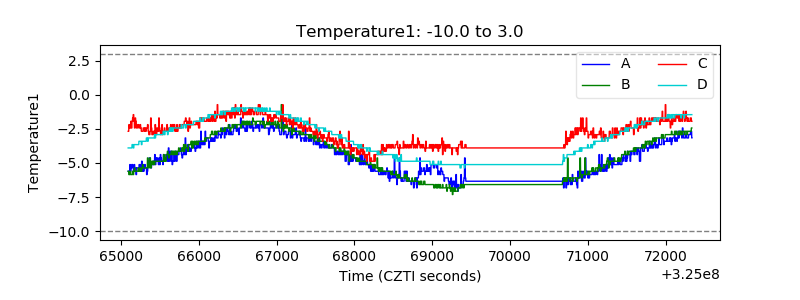 |
| Veto HV Monitor | 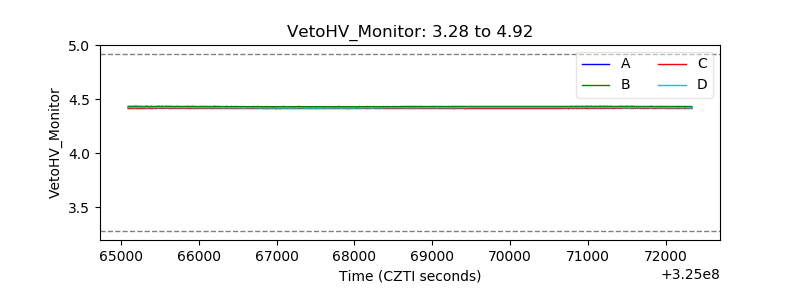 |
| Veto LLD | 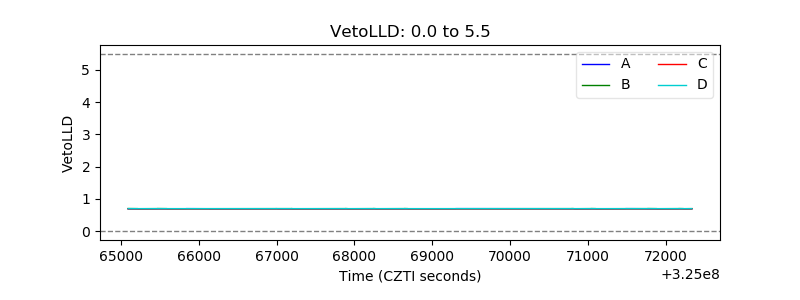 |
| Alpha Counter | 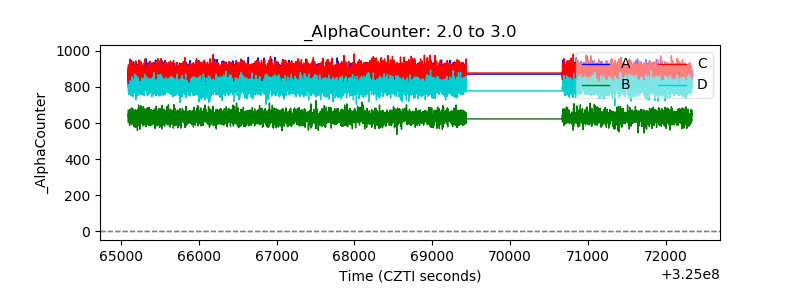 |
| _CPM_Rate | 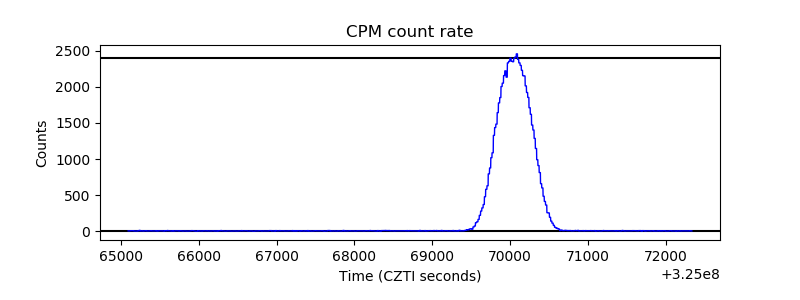 |
| CZT Counter | 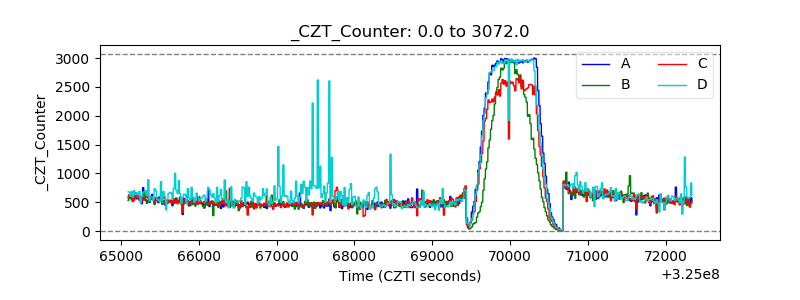 |
| +2.5 Volts monitor | 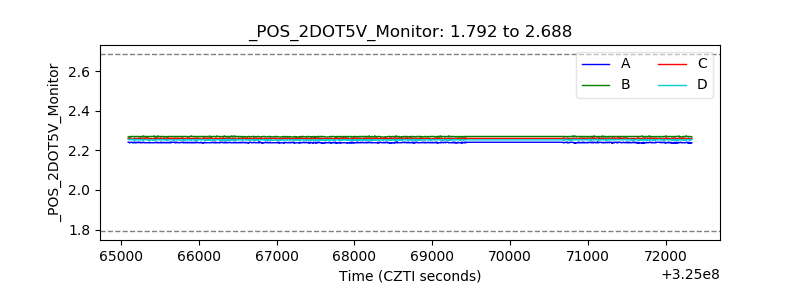 |
| +5 Volts monitor | 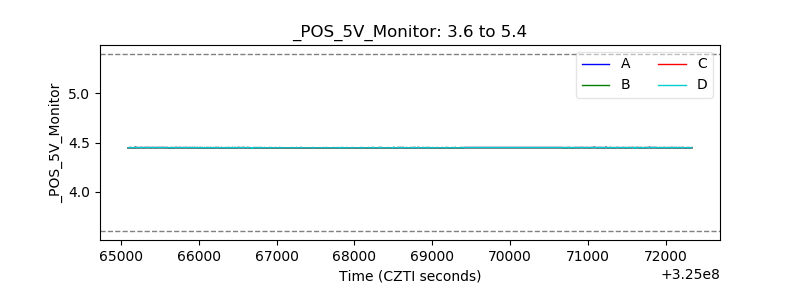 |
| _ROLL_ROT | 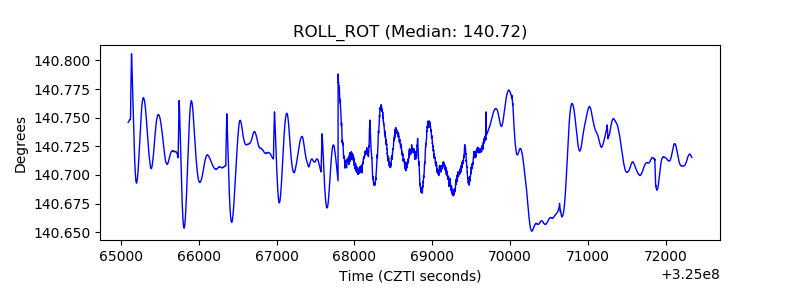 |
| _Roll_DEC | 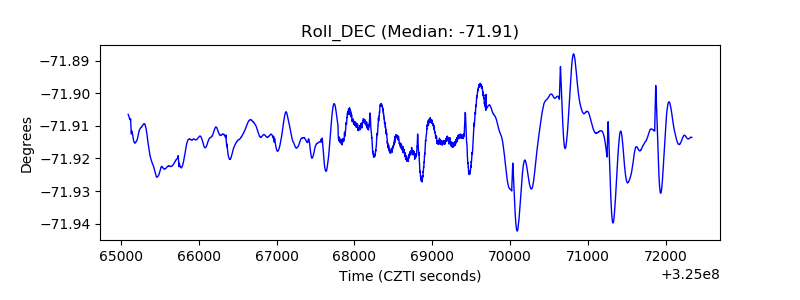 |
| _Roll_RA | 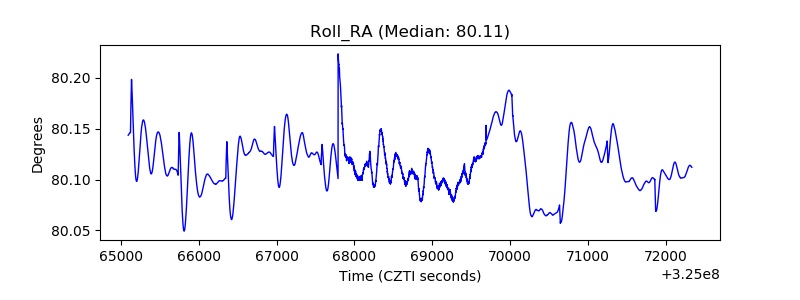 |
| Veto Counter | 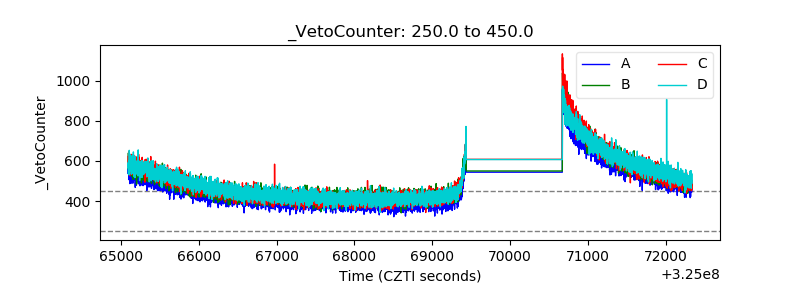 |