| Param | Original file | Final file |
|---|---|---|
| Filename | modeM0/AS1T03_191T01_9000003618_24664cztM0_level2.evt | modeM0/AS1T03_191T01_9000003618_24664cztM0_level2_quad_clean.evt |
| Size (bytes) | 424,368,000 | 127,082,880 |
| Size | 404.7 MB | 121.2 MB |
| Events in quadrant A | 2,932,144 | 889,721 |
| Events in quadrant B | 2,974,495 | 886,232 |
| Events in quadrant C | 2,919,999 | 839,605 |
| Events in quadrant D | 3,640,787 | 837,952 |
| Mode M9 | |||
|---|---|---|---|
| Quadrant | BADHDUFLAG | Total packets | Discarded packets |
| A | 0 | 13 | 0 |
| B | 0 | 13 | 0 |
| C | 0 | 13 | 0 |
| D | 0 | 13 | 0 |
| Mode M0 | |||
|---|---|---|---|
| Quadrant | BADHDUFLAG | Total packets | Discarded packets |
| A | 0 | 12198 | 1 |
| B | 0 | 12230 | 2 |
| C | 0 | 12212 | 1 |
| D | 0 | 14686 | 1 |
| Mode SS | |||
|---|---|---|---|
| Quadrant | BADHDUFLAG | Total packets | Discarded packets |
| A | 0 | 114 | 0 |
| B | 0 | 114 | 0 |
| C | 0 | 114 | 0 |
| D | 0 | 114 | 0 |
| Quadrant | Total seconds | Saturated seconds | Saturation percentage |
|---|---|---|---|
| A | 5664 | 78 | 1.377119% |
| B | 5664 | 64 | 1.129944% |
| C | 5664 | 105 | 1.853814% |
| D | 5664 | 75 | 1.324153% |
Noise dominated data is calculated using 1-second bins in cleaned event files. If a bin has >2000 counts, and if more than 50% of those come from <1% of pixels, then it is considered to be noise-dominated and hence unusable.
| Quadrant | # 1 sec bins | Bins with >0 counts | Bins with >2000 counts | High rate bins dominated by noise | Noise dominated (total time) | Noise dominated (detector-on time) | Marked lightcurve |
|---|---|---|---|---|---|---|---|
| A | 6914 | 5664 | 0 | 0 | 0.00% | 0.00% | 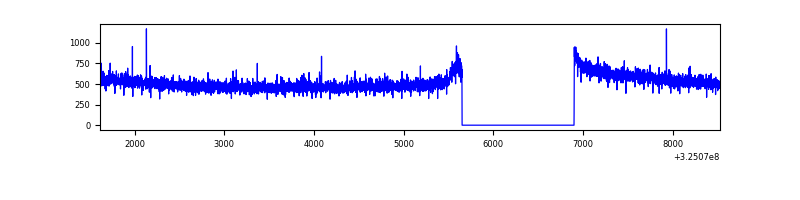 |
| B | 6914 | 5664 | 0 | 0 | 0.00% | 0.00% | 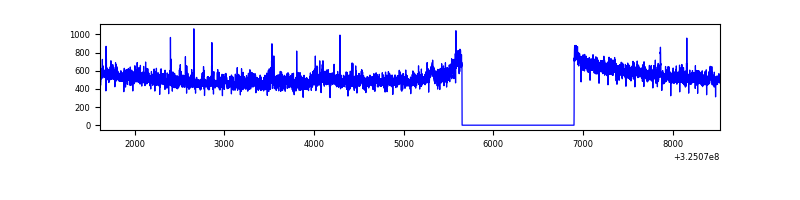 |
| C | 6914 | 5664 | 0 | 0 | 0.00% | 0.00% | 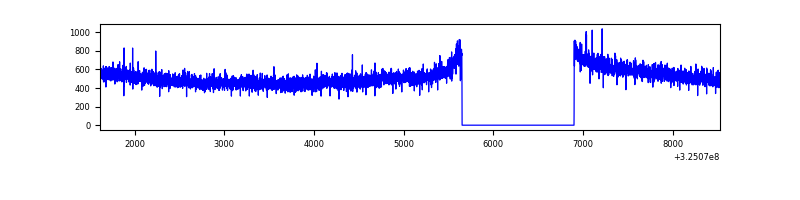 |
| D | 6914 | 5664 | 6 | 6 | 0.09% | 0.11% | 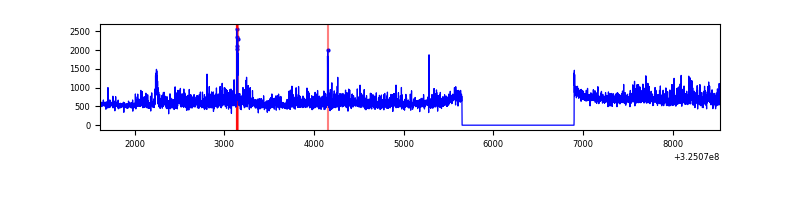 |
Top three noisy pixels from each quadrant. If the there are fewer than three noisy pixels in the level2.evt file, extra rows are filled as -1
| Pixel properties | Quadrant properties | ||||||
|---|---|---|---|---|---|---|---|
| Quadrant | DetID | PixID | Counts | Sigma | Mean | Median | Sigma |
| A | 13 | 254 | 9065 | 55.25 | 760 | 747 | 150.6 |
| A | 0 | 226 | 6634 | 39.1 | 760 | 747 | 150.6 |
| A | 3 | 137 | 6199 | 36.21 | 760 | 747 | 150.6 |
| B | 0 | 189 | 40627 | 291.06 | 740 | 726 | 137.1 |
| B | 7 | 202 | 25773 | 182.71 | 740 | 726 | 137.1 |
| B | 12 | 111 | 15836 | 110.22 | 740 | 726 | 137.1 |
| C | 14 | 238 | 117529 | 724.06 | 709 | 714 | 161.3 |
| C | 10 | 91 | 23662 | 142.24 | 709 | 714 | 161.3 |
| C | 5 | 112 | 7477 | 41.92 | 709 | 714 | 161.3 |
| D | 8 | 195 | 736930 | 4199.4 | 736 | 717 | 175.3 |
| D | 7 | 238 | 59215 | 333.68 | 736 | 717 | 175.3 |
| D | 1 | 52 | 54573 | 307.2 | 736 | 717 | 175.3 |
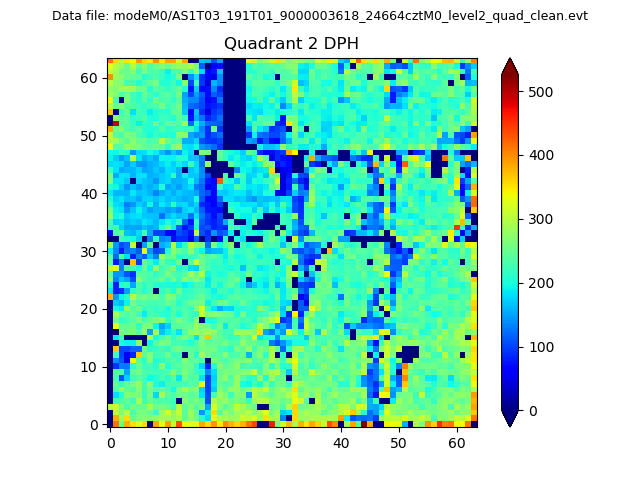
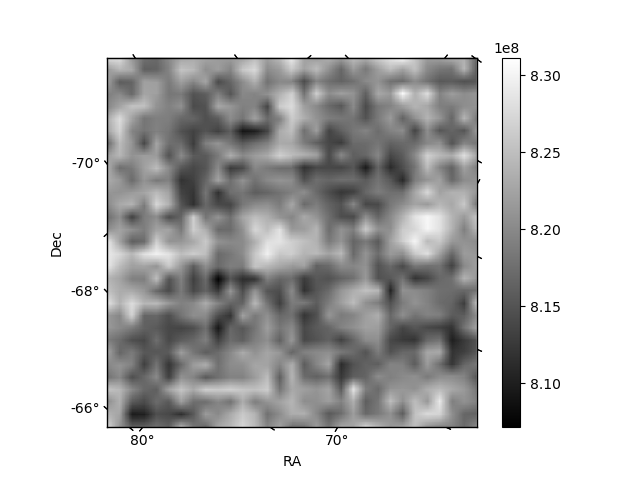
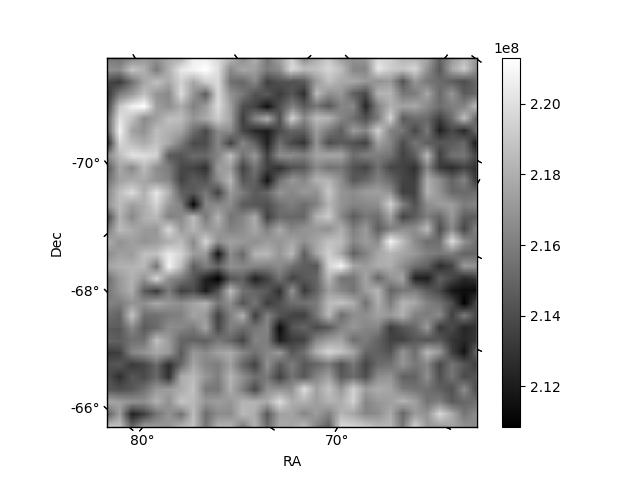
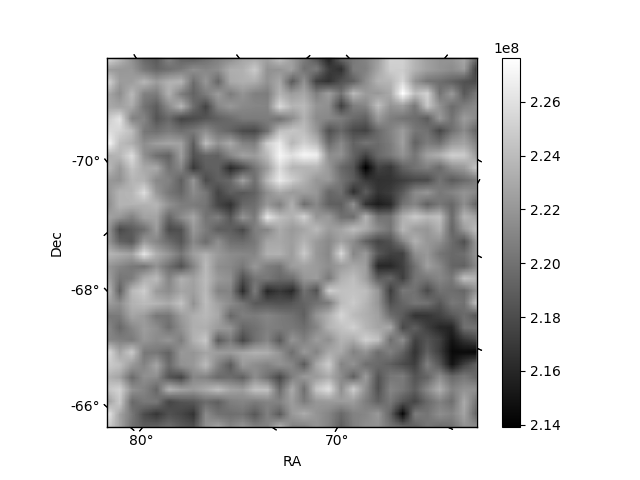
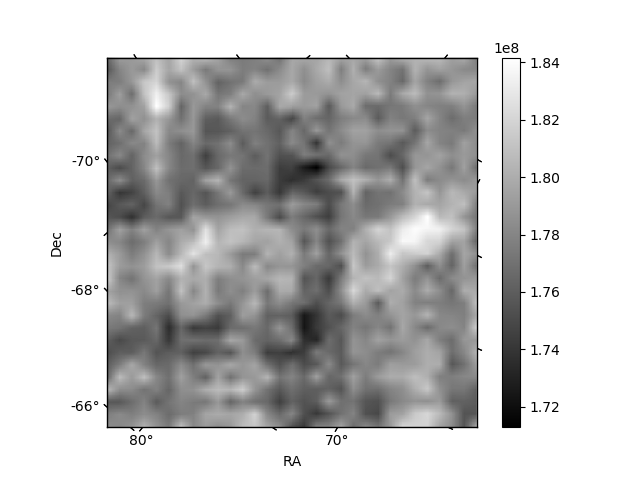
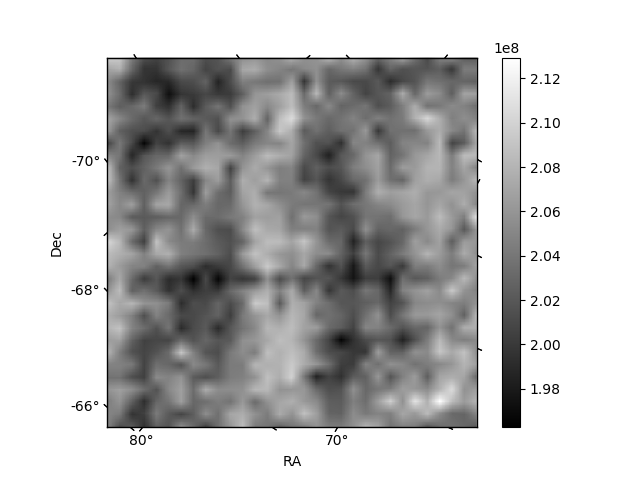
Histogram calculated using DETX and DETY for each event in the final _common_clean file
| Quadrant A | 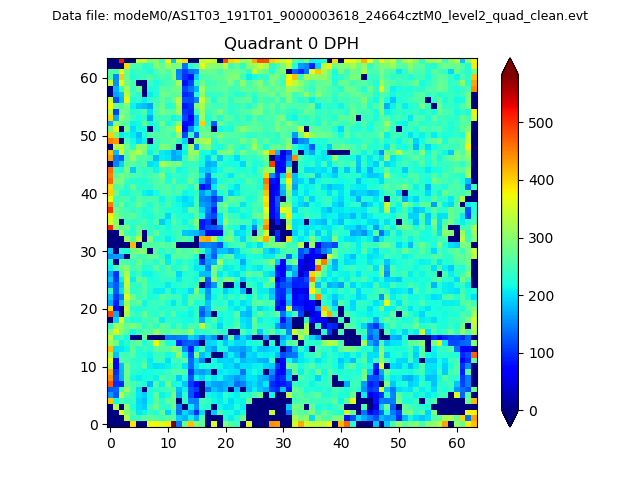 |
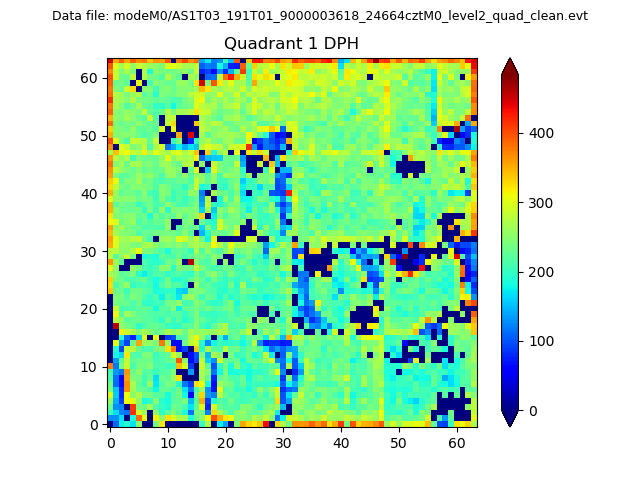 |
Quadrant B |
|---|---|---|---|
| Quadrant D | 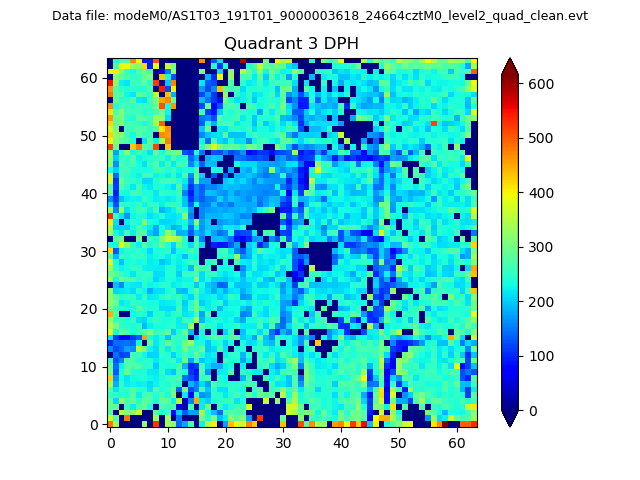 |
 |
Quadrant C |
| Plot type | Count rate plots | Images |
|---|---|---|
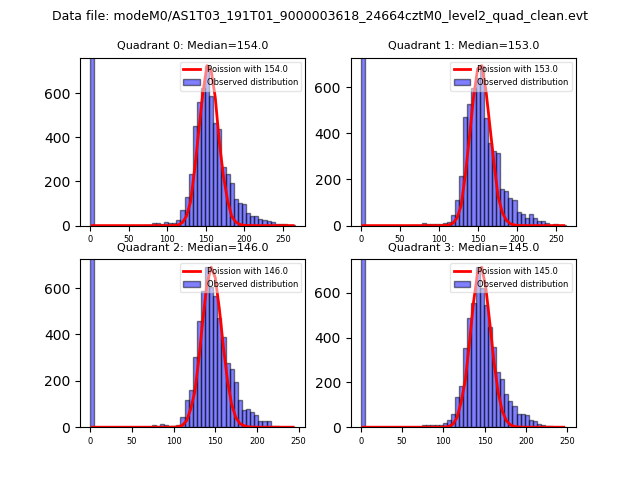
| Comparison with Poisson distribution Blue bars denote a histogram of data divided into 1 sec bins. Red curve is a Poisson curve with rate = median count rate of data. |
 |
 |
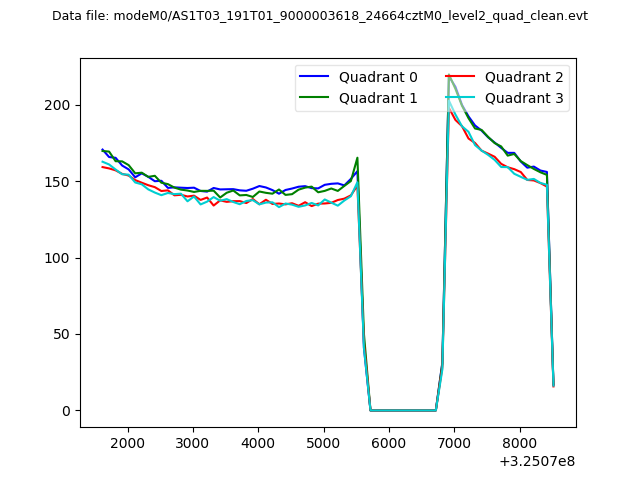
| Quadrant-wise count rates Data is divided into 100 sec bins |
 |
|
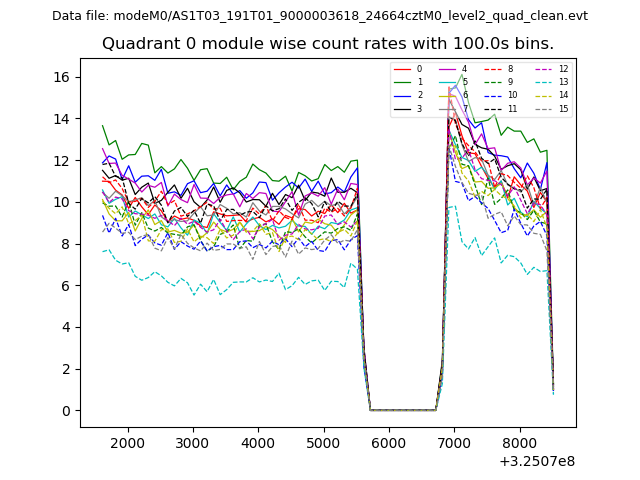
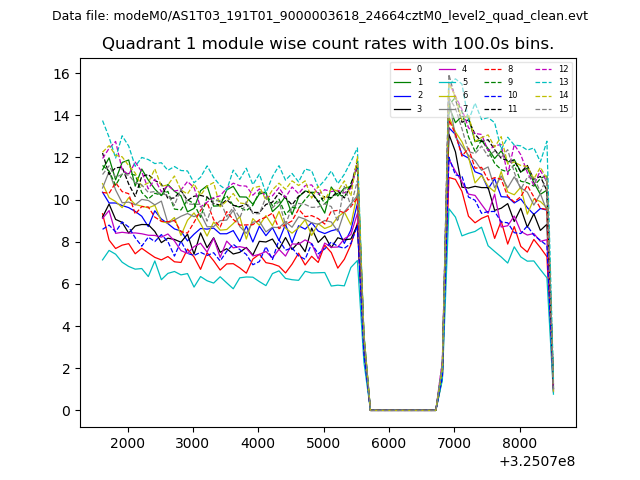
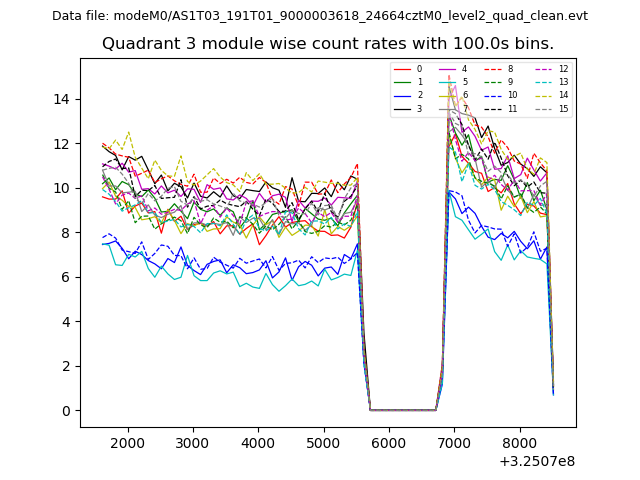
| Module-wise count rates for Quadrant A Data is divided into 100 sec bins |
 |
 |
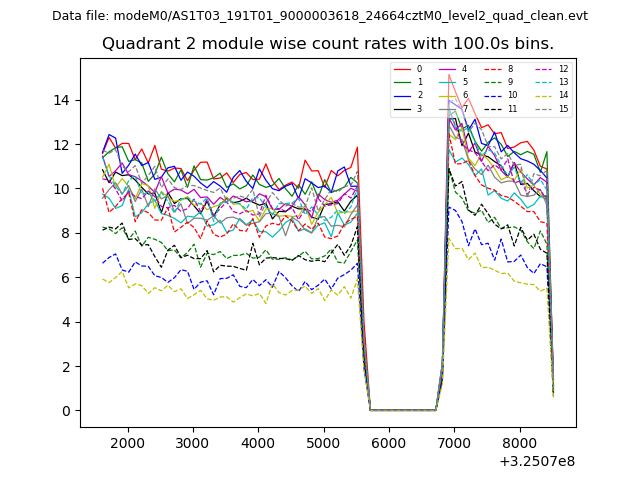
| Module-wise count rates for Quadrant B Data is divided into 100 sec bins |
 |
 |
| Module-wise count rates for Quadrant C Data is divided into 100 sec bins |
 |
 |
| Module-wise count rates for Quadrant D Data is divided into 100 sec bins |
 |
 |
| Parameter | Plot |
|---|---|
| CZT HV Monitor | 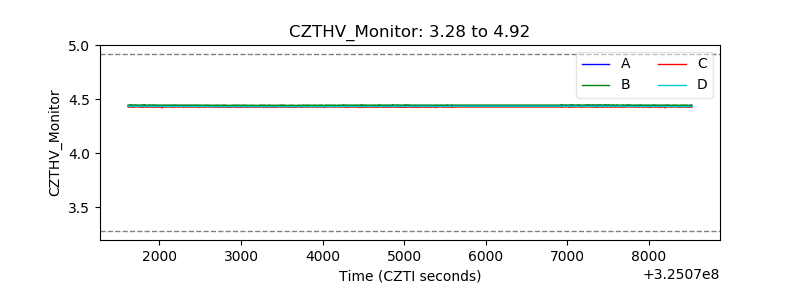 |
| D_VDD | 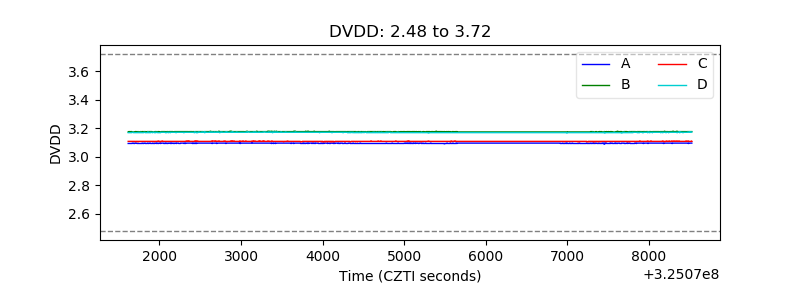 |
| Temperature 1 | 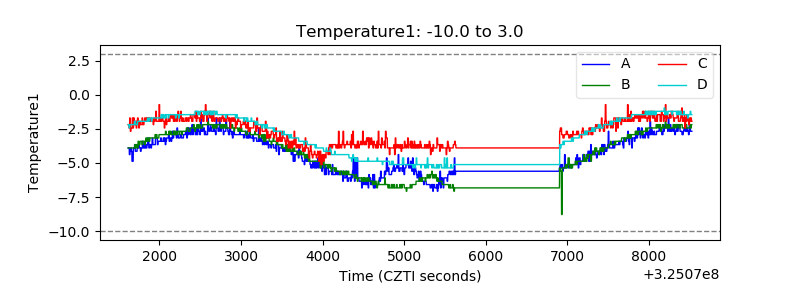 |
| Veto HV Monitor | 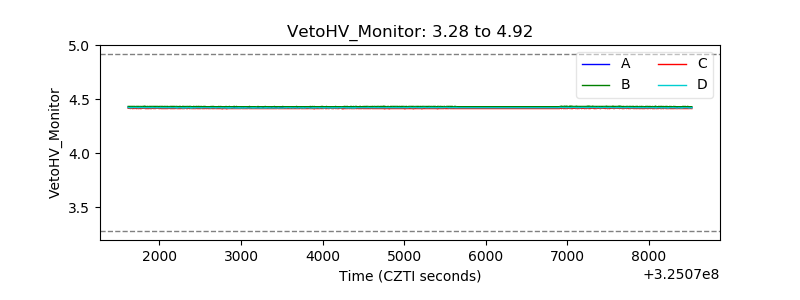 |
| Veto LLD | 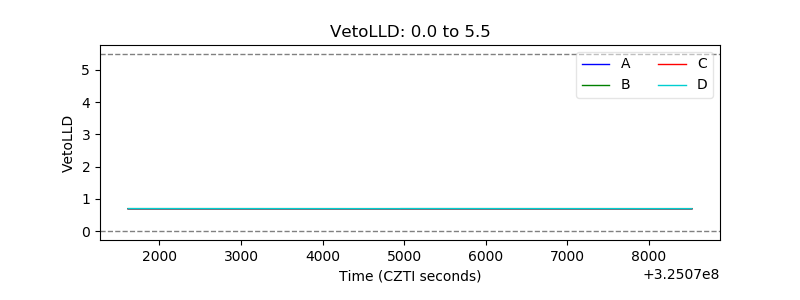 |
| Alpha Counter | 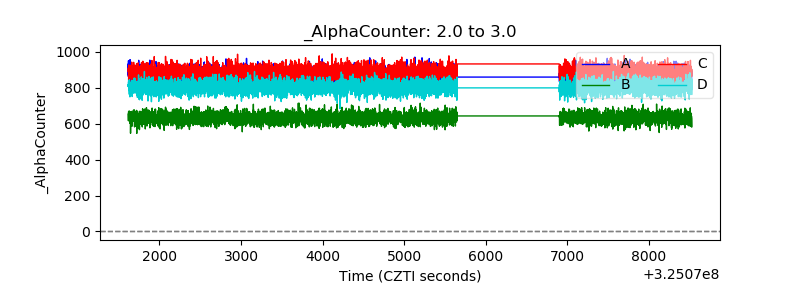 |
| _CPM_Rate | 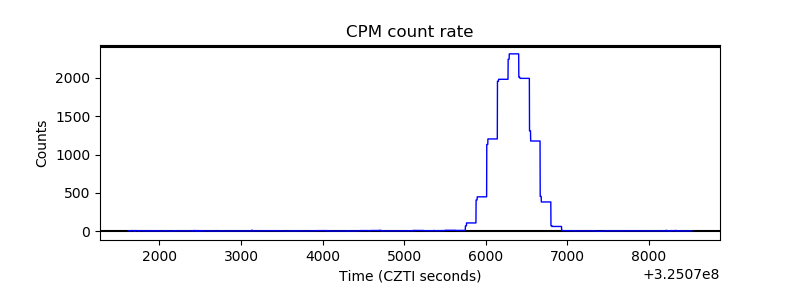 |
| CZT Counter | 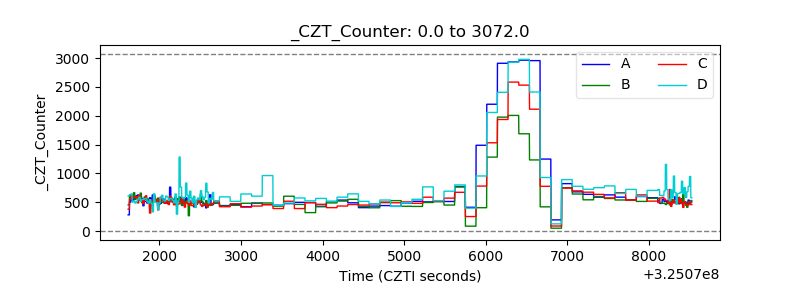 |
| +2.5 Volts monitor |  |
| +5 Volts monitor |  |
| _ROLL_ROT | 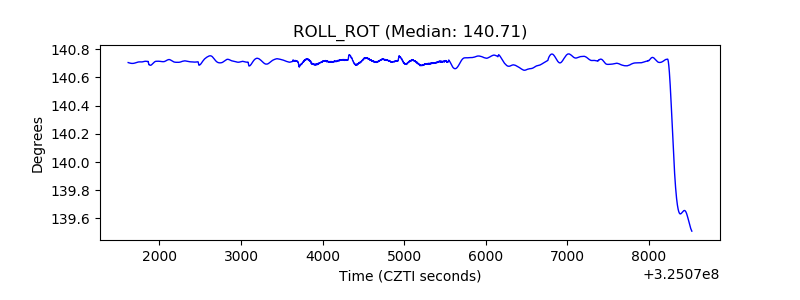 |
| _Roll_DEC | 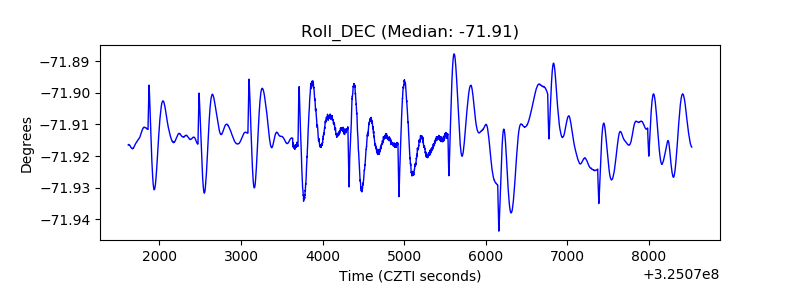 |
| _Roll_RA | 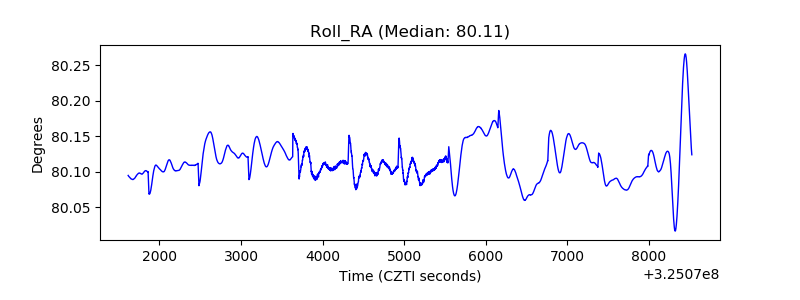 |
| Veto Counter | 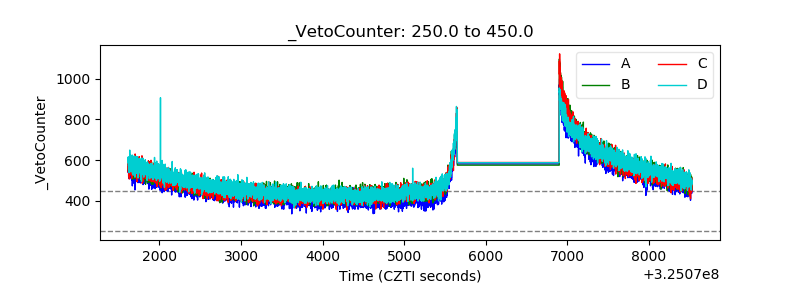 |