| Param | Original file | Final file |
|---|---|---|
| Filename | modeM0/AS1T03_191T01_9000003618_24666cztM0_level2.evt | modeM0/AS1T03_191T01_9000003618_24666cztM0_level2_quad_clean.evt |
| Size (bytes) | 455,310,720 | 128,018,880 |
| Size | 434.2 MB | 122.1 MB |
| Events in quadrant A | 3,011,904 | 895,109 |
| Events in quadrant B | 3,068,814 | 894,219 |
| Events in quadrant C | 3,004,329 | 838,023 |
| Events in quadrant D | 4,295,597 | 829,967 |
| Mode M9 | |||
|---|---|---|---|
| Quadrant | BADHDUFLAG | Total packets | Discarded packets |
| A | 0 | 13 | 0 |
| B | 0 | 13 | 0 |
| C | 0 | 13 | 0 |
| D | 0 | 13 | 0 |
| Mode M0 | |||
|---|---|---|---|
| Quadrant | BADHDUFLAG | Total packets | Discarded packets |
| A | 0 | 12630 | 1 |
| B | 0 | 12858 | 1 |
| C | 0 | 12767 | 2 |
| D | 0 | 16831 | 1 |
| Mode SS | |||
|---|---|---|---|
| Quadrant | BADHDUFLAG | Total packets | Discarded packets |
| A | 0 | 120 | 0 |
| B | 0 | 120 | 0 |
| C | 0 | 120 | 0 |
| D | 0 | 120 | 0 |
| Quadrant | Total seconds | Saturated seconds | Saturation percentage |
|---|---|---|---|
| A | 6023 | 92 | 1.527478% |
| B | 6024 | 92 | 1.527224% |
| C | 6023 | 112 | 1.859538% |
| D | 6023 | 171 | 2.839117% |
Noise dominated data is calculated using 1-second bins in cleaned event files. If a bin has >2000 counts, and if more than 50% of those come from <1% of pixels, then it is considered to be noise-dominated and hence unusable.
| Quadrant | # 1 sec bins | Bins with >0 counts | Bins with >2000 counts | High rate bins dominated by noise | Noise dominated (total time) | Noise dominated (detector-on time) | Marked lightcurve |
|---|---|---|---|---|---|---|---|
| A | 7248 | 6023 | 0 | 0 | 0.00% | 0.00% | 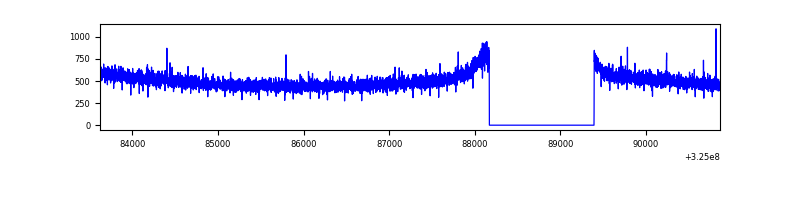 |
| B | 7249 | 6024 | 0 | 0 | 0.00% | 0.00% | 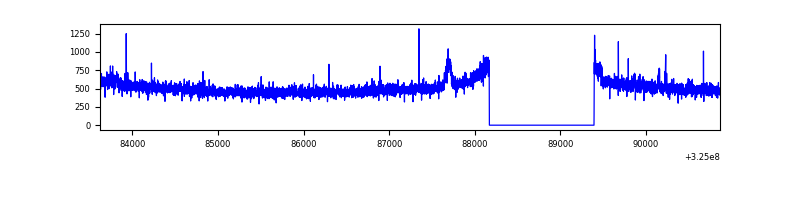 |
| C | 7248 | 6024 | 2 | 2 | 0.03% | 0.03% | 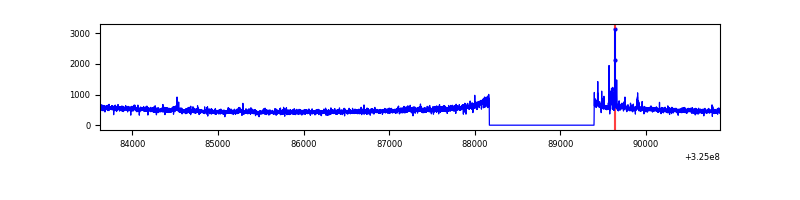 |
| D | 7248 | 6024 | 67 | 67 | 0.92% | 1.11% | 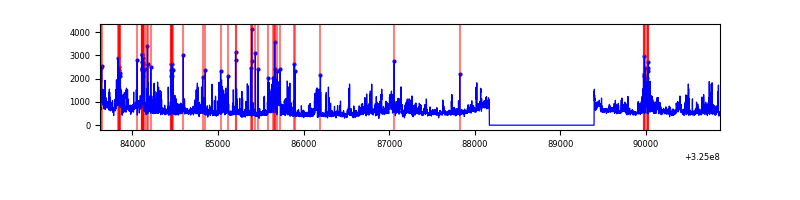 |
Top three noisy pixels from each quadrant. If the there are fewer than three noisy pixels in the level2.evt file, extra rows are filled as -1
| Pixel properties | Quadrant properties | ||||||
|---|---|---|---|---|---|---|---|
| Quadrant | DetID | PixID | Counts | Sigma | Mean | Median | Sigma |
| A | 13 | 254 | 9907 | 58.88 | 780 | 765 | 155.3 |
| A | 0 | 226 | 6837 | 39.11 | 780 | 765 | 155.3 |
| A | 3 | 137 | 6604 | 37.61 | 780 | 765 | 155.3 |
| B | 0 | 189 | 50903 | 350.74 | 762 | 745 | 143.0 |
| B | 7 | 202 | 20973 | 141.45 | 762 | 745 | 143.0 |
| B | 12 | 111 | 16494 | 110.13 | 762 | 745 | 143.0 |
| C | 14 | 238 | 120477 | 726.16 | 722 | 726 | 164.9 |
| C | 6 | 96 | 40220 | 239.49 | 722 | 726 | 164.9 |
| C | 2 | 16 | 14436 | 83.13 | 722 | 726 | 164.9 |
| D | 1 | 52 | 1162479 | 6456.95 | 747 | 725 | 179.9 |
| D | 8 | 195 | 194650 | 1077.82 | 747 | 725 | 179.9 |
| D | 12 | 235 | 85416 | 470.71 | 747 | 725 | 179.9 |
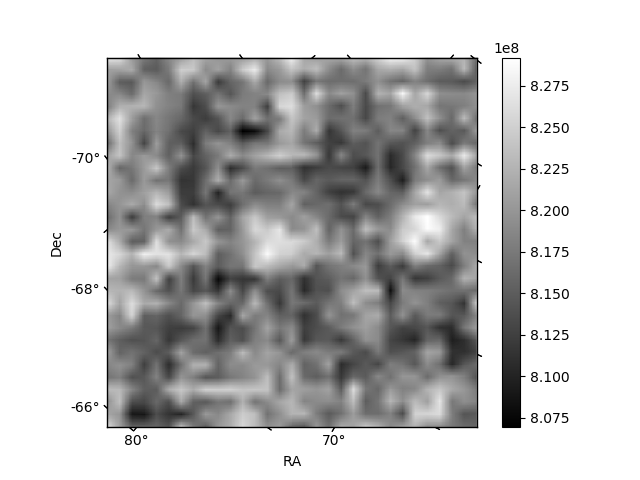
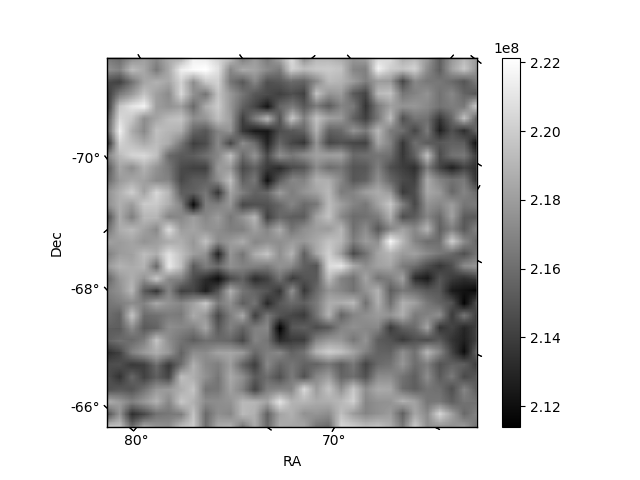
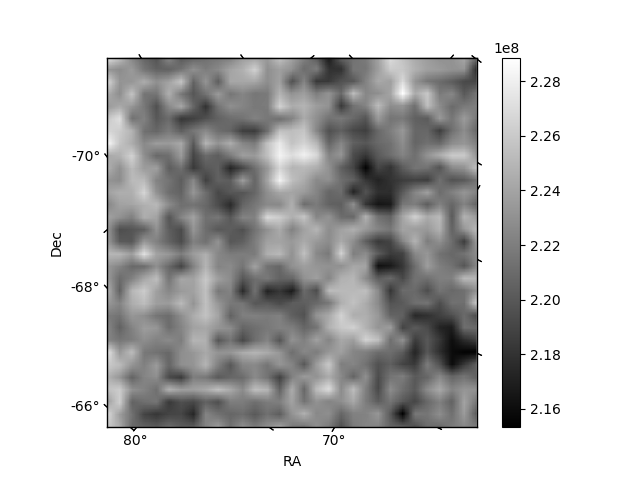
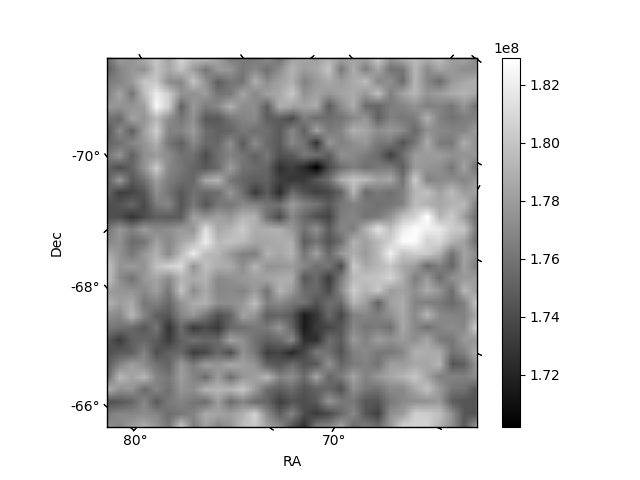
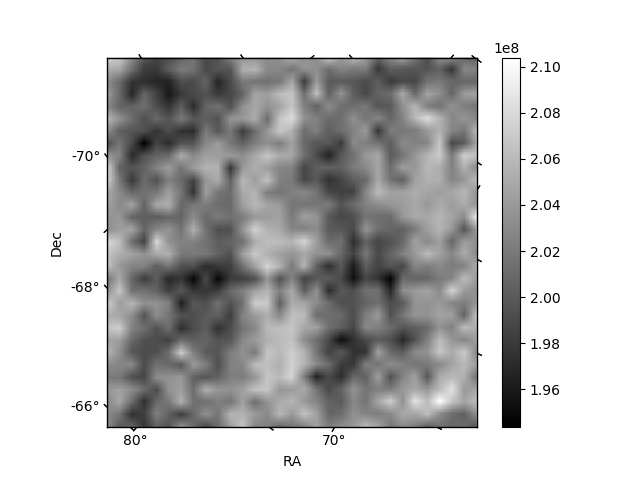
Histogram calculated using DETX and DETY for each event in the final _common_clean file
| Quadrant A | 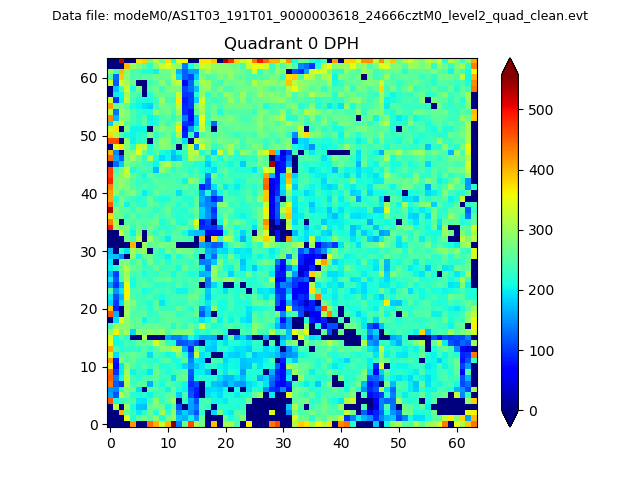 |
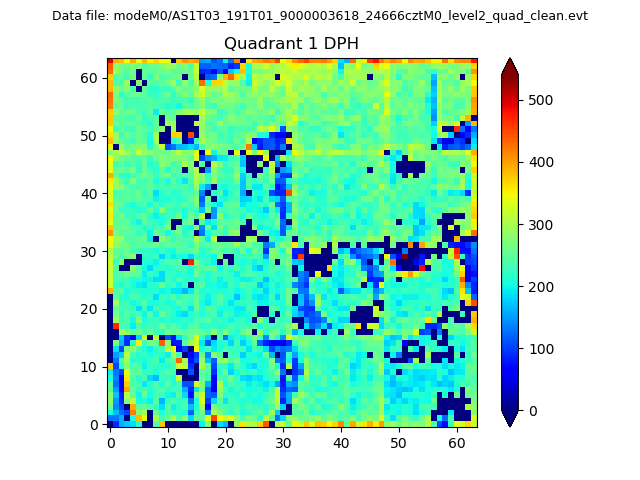 |
Quadrant B |
|---|---|---|---|
| Quadrant D | 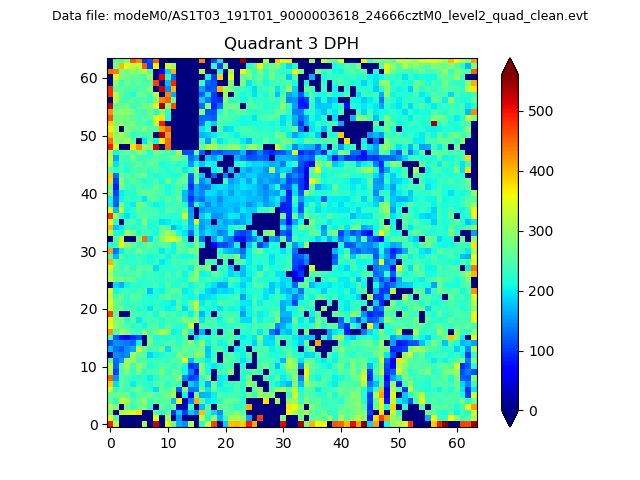 |
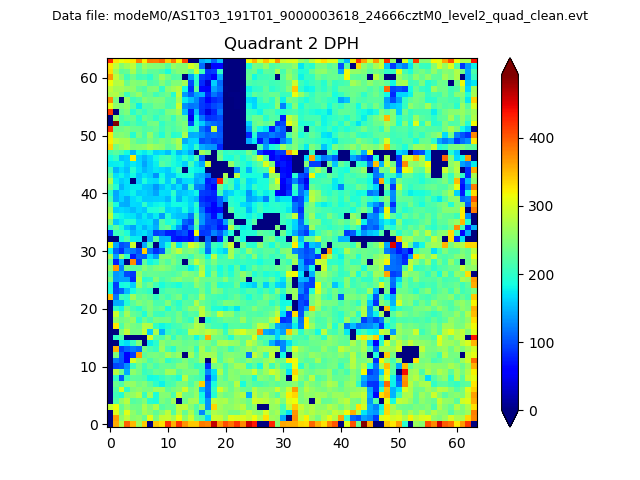 |
Quadrant C |
| Plot type | Count rate plots | Images |
|---|---|---|
| Comparison with Poisson distribution Blue bars denote a histogram of data divided into 1 sec bins. Red curve is a Poisson curve with rate = median count rate of data. |
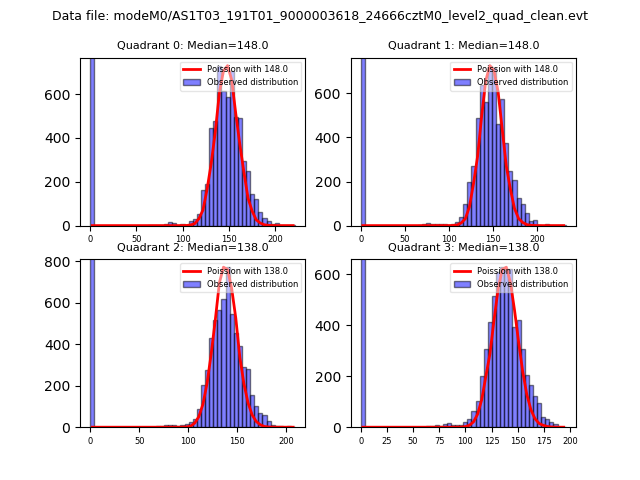 |
 |
| Quadrant-wise count rates Data is divided into 100 sec bins |
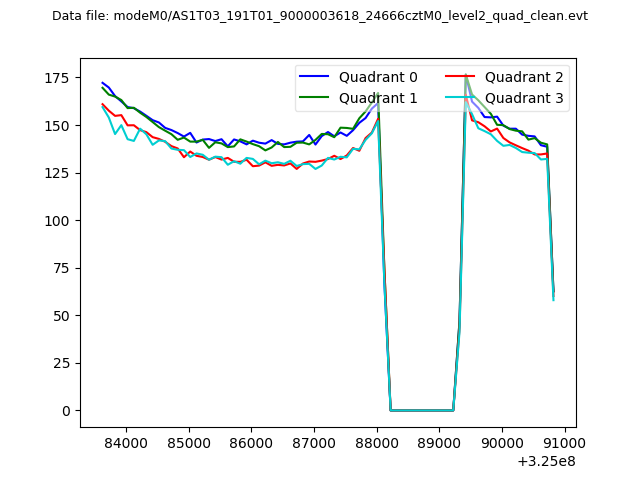 |
|
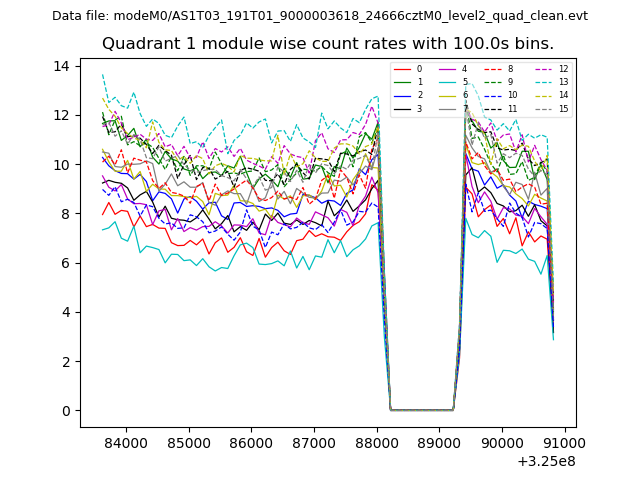
| Module-wise count rates for Quadrant A Data is divided into 100 sec bins |
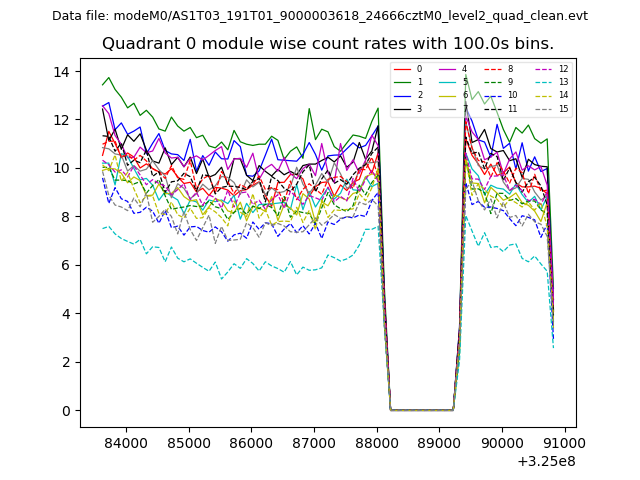 |
 |
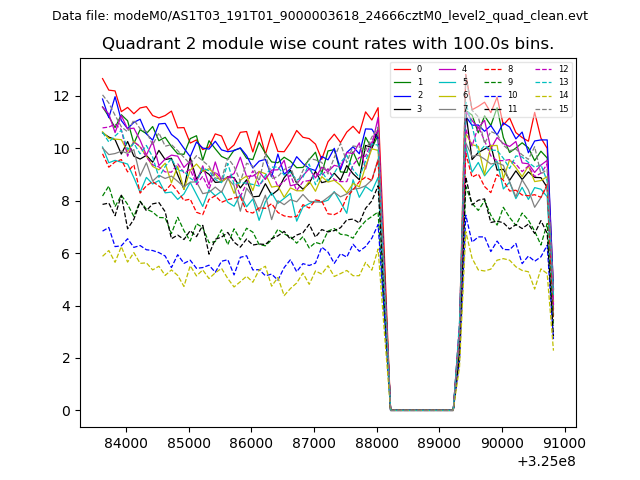
| Module-wise count rates for Quadrant B Data is divided into 100 sec bins |
 |
 |
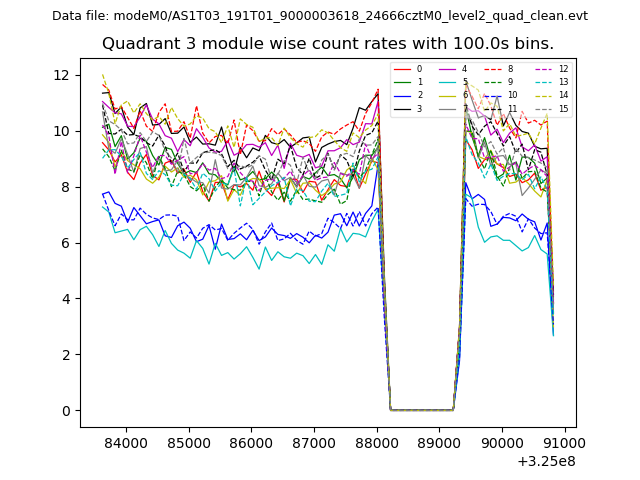
| Module-wise count rates for Quadrant C Data is divided into 100 sec bins |
 |
 |
| Module-wise count rates for Quadrant D Data is divided into 100 sec bins |
 |
 |
| Parameter | Plot |
|---|---|
| CZT HV Monitor | 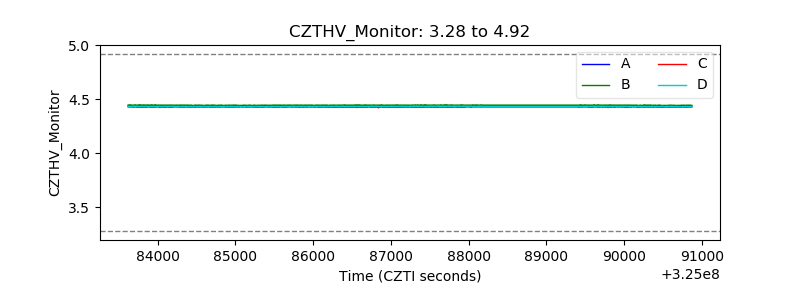 |
| D_VDD |  |
| Temperature 1 | 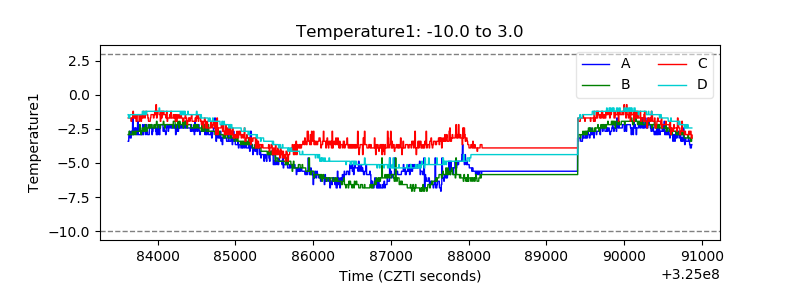 |
| Veto HV Monitor |  |
| Veto LLD | 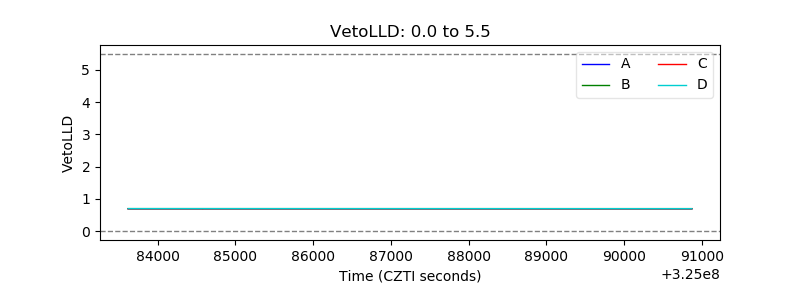 |
| Alpha Counter | 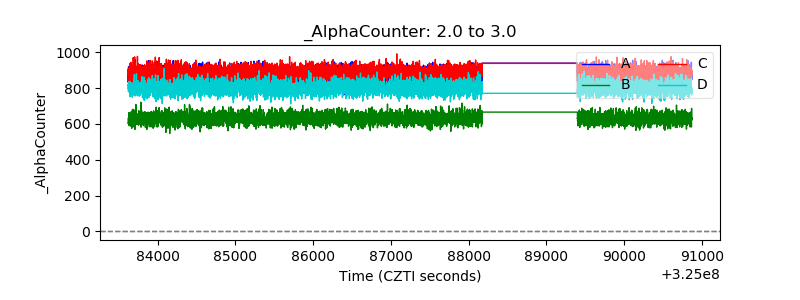 |
| _CPM_Rate | 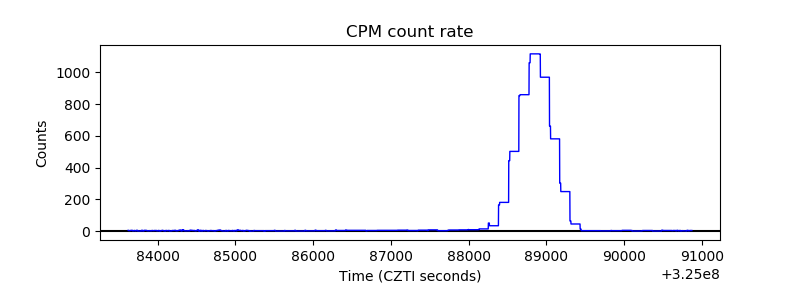 |
| CZT Counter | 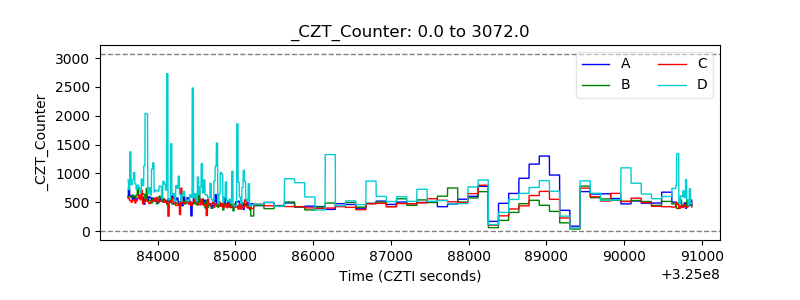 |
| +2.5 Volts monitor |  |
| +5 Volts monitor |  |
| _ROLL_ROT | 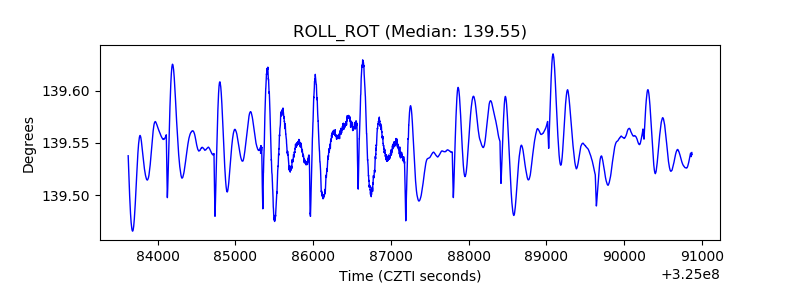 |
| _Roll_DEC | 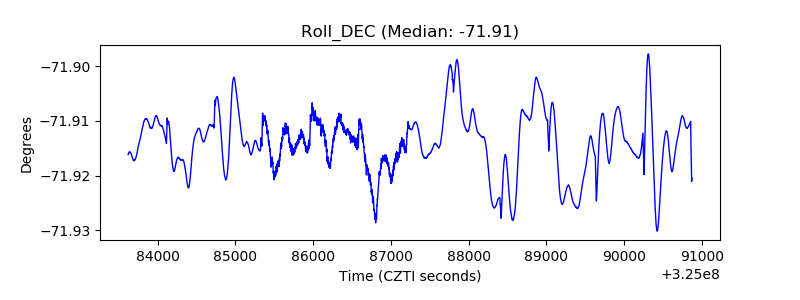 |
| _Roll_RA | 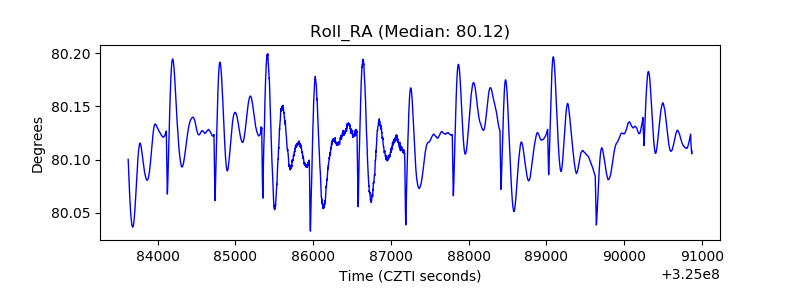 |
| Veto Counter | 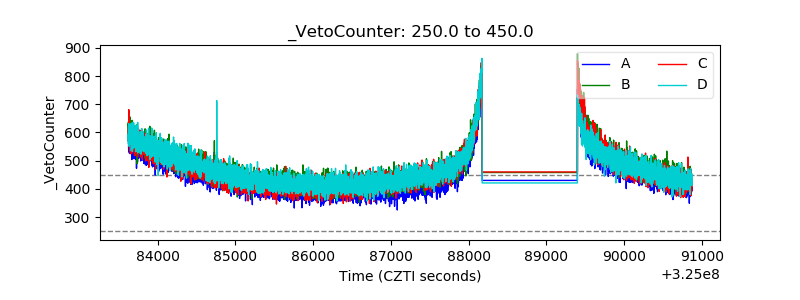 |