| Param | Original file | Final file |
|---|---|---|
| Filename | modeM0/AS1T03_191T01_9000003618_24667cztM0_level2.evt | modeM0/AS1T03_191T01_9000003618_24667cztM0_level2_quad_clean.evt |
| Size (bytes) | 508,590,720 | 129,755,520 |
| Size | 485.0 MB | 123.7 MB |
| Events in quadrant A | 3,109,018 | 906,398 |
| Events in quadrant B | 3,184,874 | 907,211 |
| Events in quadrant C | 3,138,559 | 854,016 |
| Events in quadrant D | 5,531,502 | 811,489 |
| Mode M9 | |||
|---|---|---|---|
| Quadrant | BADHDUFLAG | Total packets | Discarded packets |
| A | 0 | 10 | 0 |
| B | 0 | 10 | 0 |
| C | 0 | 10 | 0 |
| D | 0 | 10 | 0 |
| Mode M0 | |||
|---|---|---|---|
| Quadrant | BADHDUFLAG | Total packets | Discarded packets |
| A | 0 | 13350 | 1 |
| B | 0 | 13482 | 1 |
| C | 0 | 13528 | 1 |
| D | 0 | 20873 | 1 |
| Mode SS | |||
|---|---|---|---|
| Quadrant | BADHDUFLAG | Total packets | Discarded packets |
| A | 0 | 132 | 0 |
| B | 0 | 132 | 0 |
| C | 0 | 132 | 0 |
| D | 0 | 130 | 0 |
| Quadrant | Total seconds | Saturated seconds | Saturation percentage |
|---|---|---|---|
| A | 6461 | 70 | 1.083424% |
| B | 6462 | 75 | 1.160631% |
| C | 6462 | 75 | 1.160631% |
| D | 6462 | 827 | 12.797895% |
Noise dominated data is calculated using 1-second bins in cleaned event files. If a bin has >2000 counts, and if more than 50% of those come from <1% of pixels, then it is considered to be noise-dominated and hence unusable.
| Quadrant | # 1 sec bins | Bins with >0 counts | Bins with >2000 counts | High rate bins dominated by noise | Noise dominated (total time) | Noise dominated (detector-on time) | Marked lightcurve |
|---|---|---|---|---|---|---|---|
| A | 7466 | 6462 | 1 | 1 | 0.01% | 0.02% | 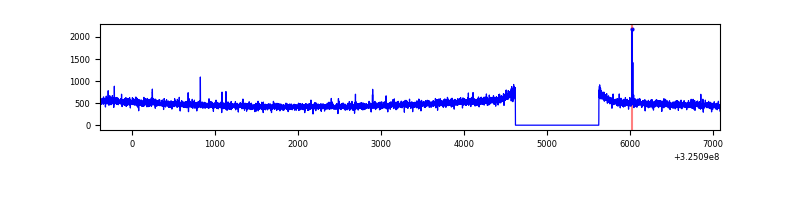 |
| B | 7467 | 6463 | 2 | 2 | 0.03% | 0.03% | 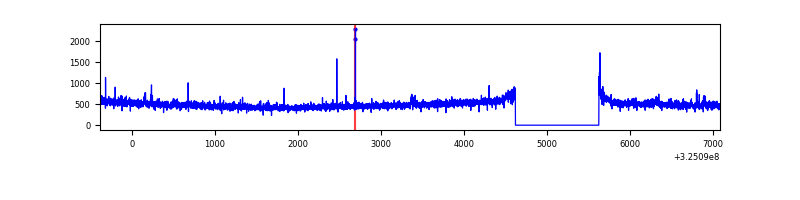 |
| C | 7467 | 6463 | 2 | 2 | 0.03% | 0.03% | 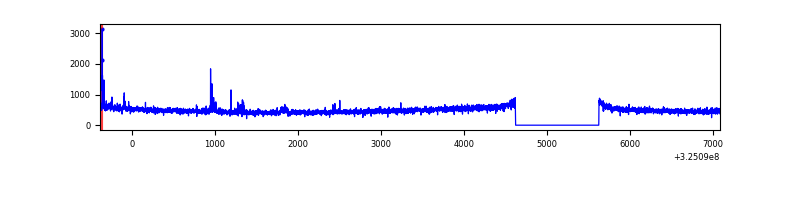 |
| D | 7467 | 6463 | 729 | 729 | 9.76% | 11.28% | 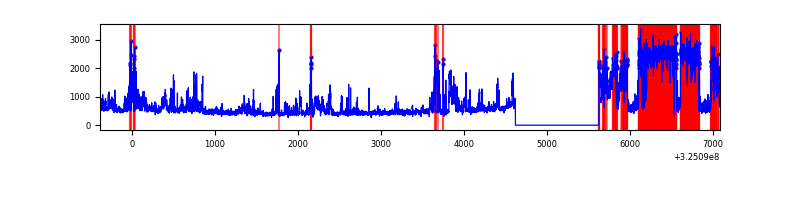 |
Top three noisy pixels from each quadrant. If the there are fewer than three noisy pixels in the level2.evt file, extra rows are filled as -1
| Pixel properties | Quadrant properties | ||||||
|---|---|---|---|---|---|---|---|
| Quadrant | DetID | PixID | Counts | Sigma | Mean | Median | Sigma |
| A | 13 | 254 | 11217 | 64.58 | 804 | 786 | 161.5 |
| A | 4 | 2 | 7240 | 39.96 | 804 | 786 | 161.5 |
| A | 0 | 226 | 7087 | 39.01 | 804 | 786 | 161.5 |
| B | 7 | 202 | 33798 | 220.68 | 792 | 771 | 149.7 |
| B | 0 | 189 | 21305 | 137.2 | 792 | 771 | 149.7 |
| B | 12 | 111 | 17590 | 112.38 | 792 | 771 | 149.7 |
| C | 14 | 238 | 123758 | 709.56 | 751 | 755 | 173.4 |
| C | 2 | 16 | 30946 | 174.16 | 751 | 755 | 173.4 |
| C | 6 | 96 | 29429 | 165.41 | 751 | 755 | 173.4 |
| D | 1 | 52 | 2429965 | 13526.22 | 746 | 726 | 179.6 |
| D | 12 | 235 | 173277 | 960.78 | 746 | 726 | 179.6 |
| D | 8 | 195 | 66813 | 367.98 | 746 | 726 | 179.6 |
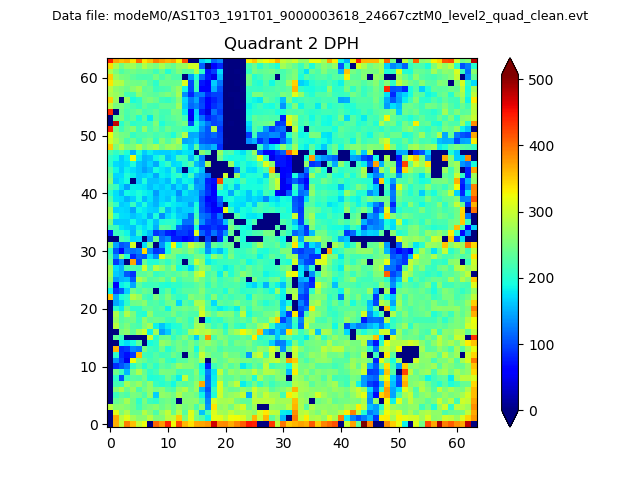
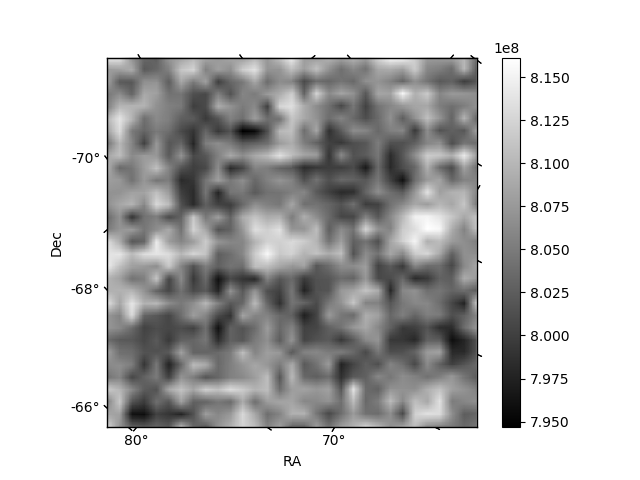
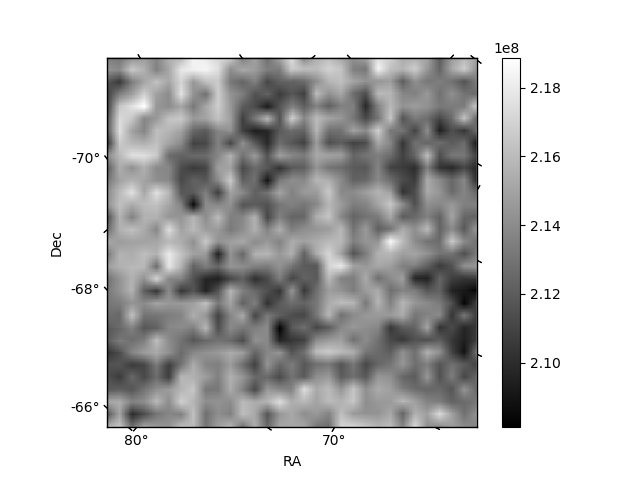
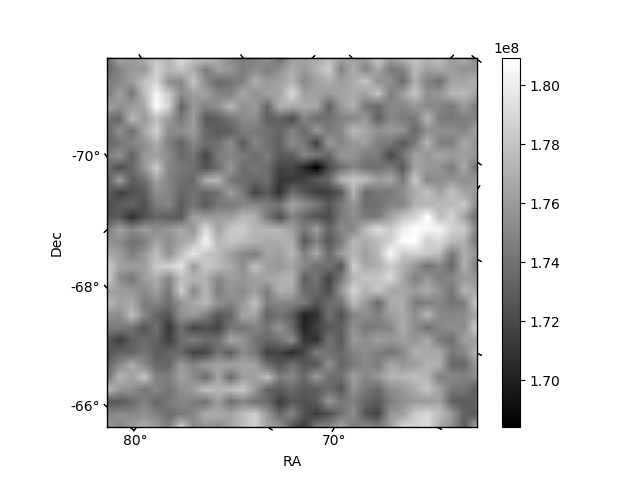
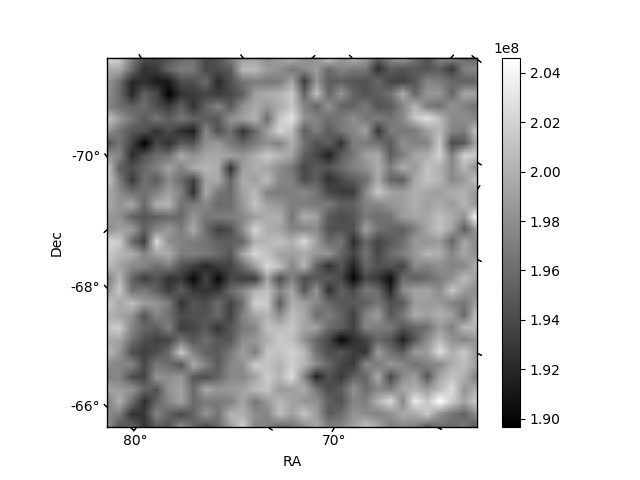
Histogram calculated using DETX and DETY for each event in the final _common_clean file
| Quadrant A | 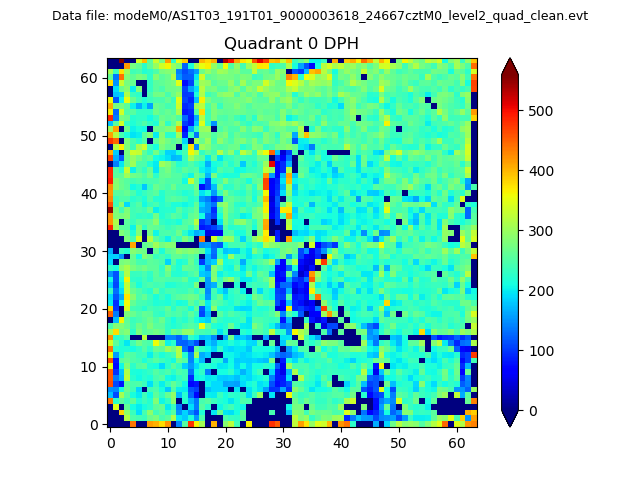 |
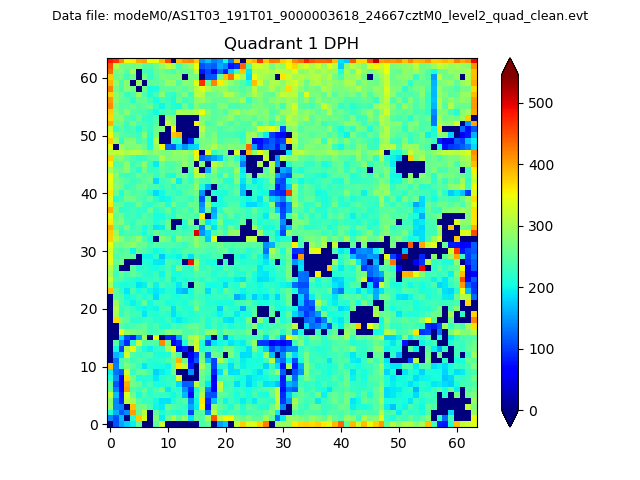 |
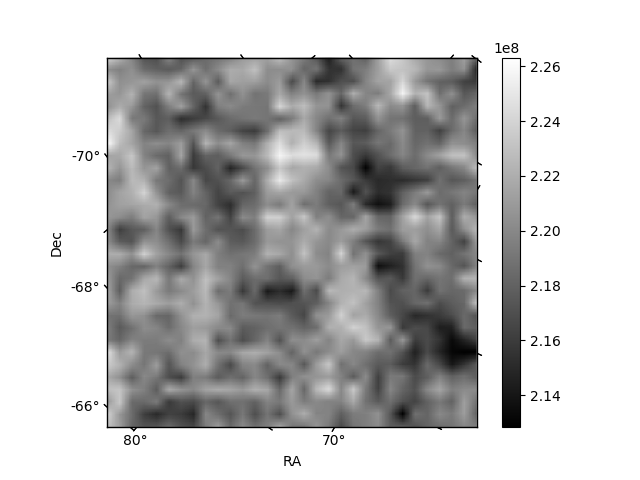
Quadrant B |
|---|---|---|---|
| Quadrant D | 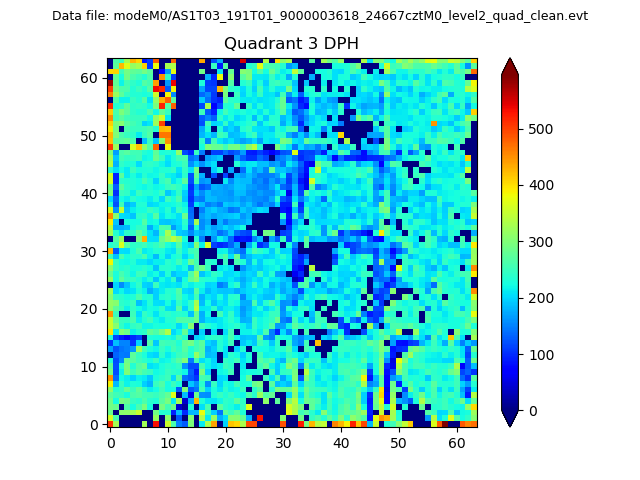 |
 |
Quadrant C |
| Plot type | Count rate plots | Images |
|---|---|---|
| Comparison with Poisson distribution Blue bars denote a histogram of data divided into 1 sec bins. Red curve is a Poisson curve with rate = median count rate of data. |
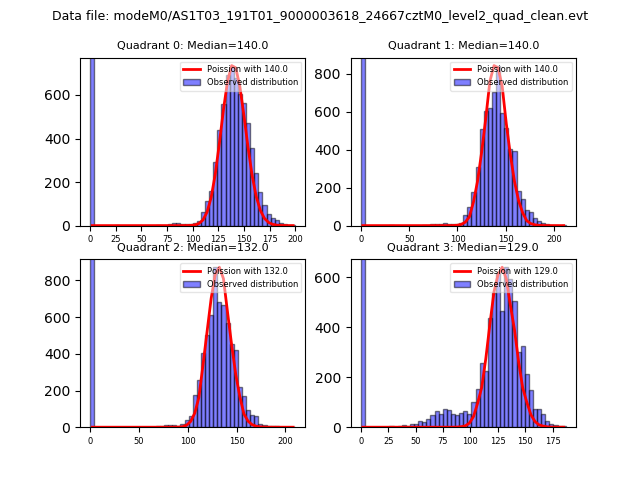 |
 |
| Quadrant-wise count rates Data is divided into 100 sec bins |
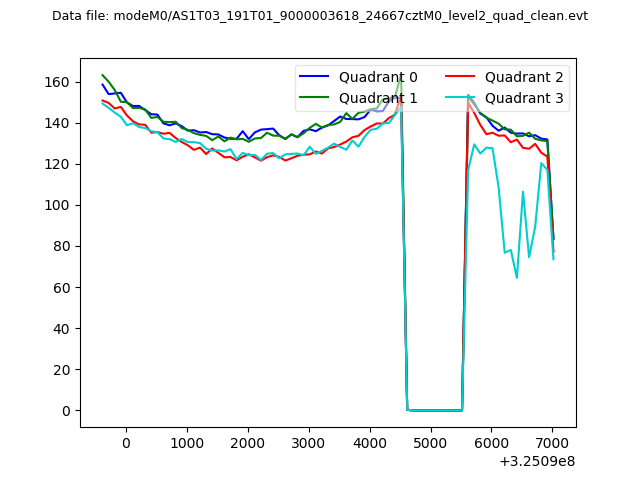 |
|
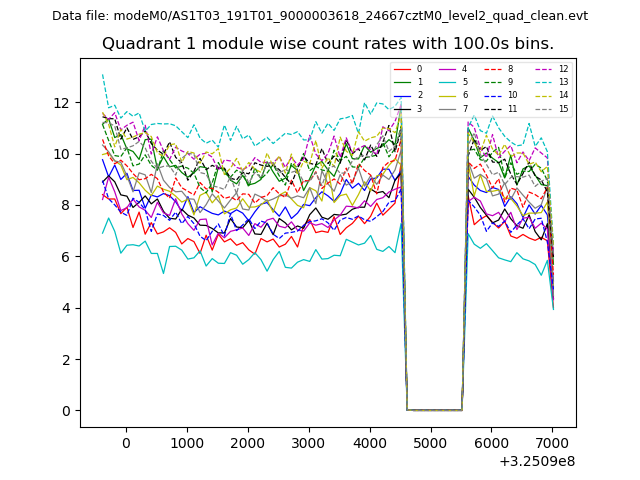
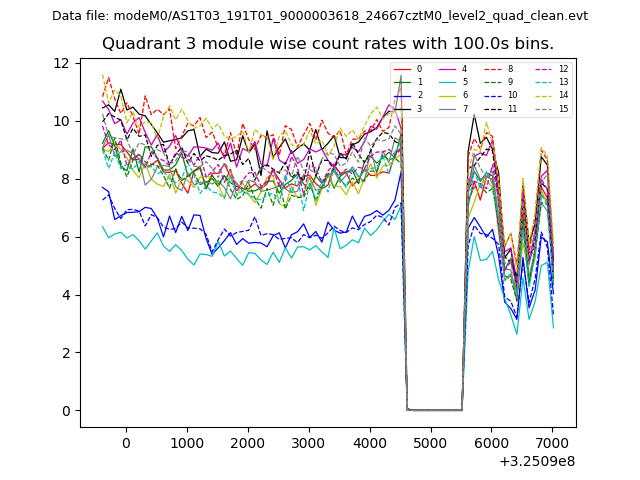
| Module-wise count rates for Quadrant A Data is divided into 100 sec bins |
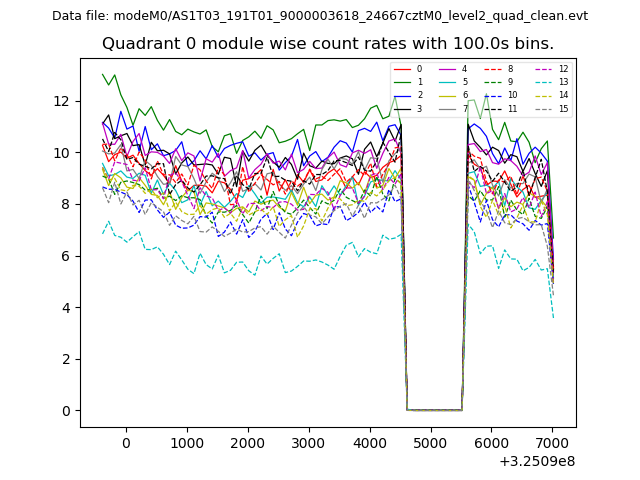 |
 |
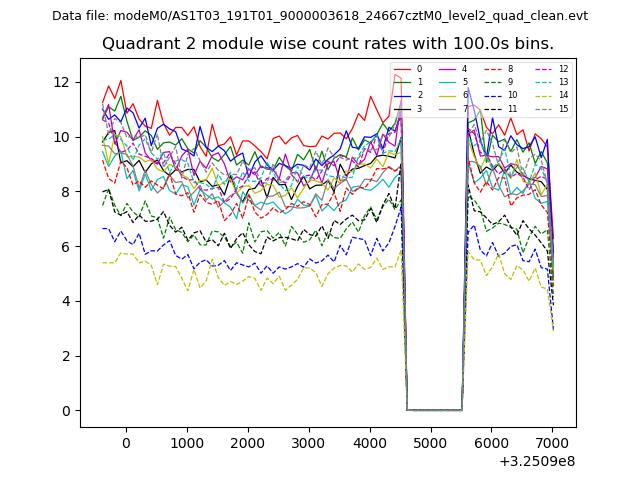
| Module-wise count rates for Quadrant B Data is divided into 100 sec bins |
 |
 |
| Module-wise count rates for Quadrant C Data is divided into 100 sec bins |
 |
 |
| Module-wise count rates for Quadrant D Data is divided into 100 sec bins |
 |
 |
| Parameter | Plot |
|---|---|
| CZT HV Monitor | 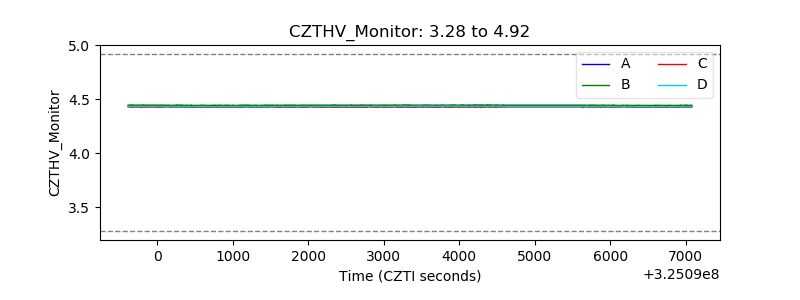 |
| D_VDD | 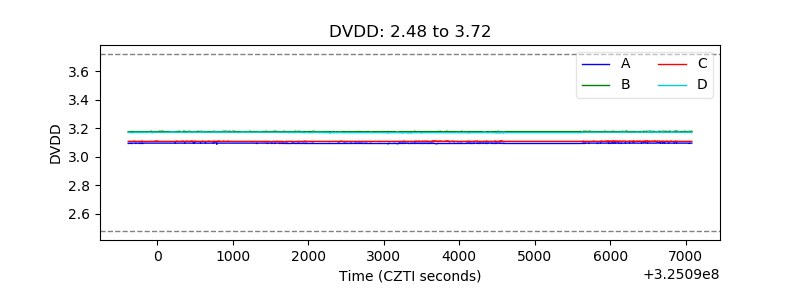 |
| Temperature 1 | 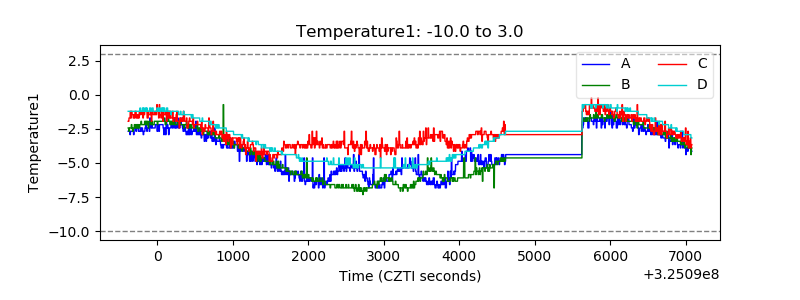 |
| Veto HV Monitor | 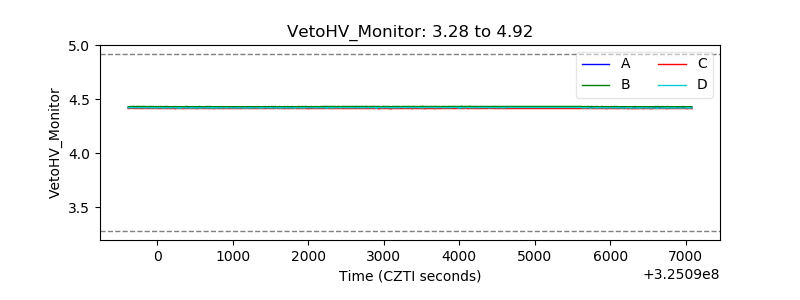 |
| Veto LLD | 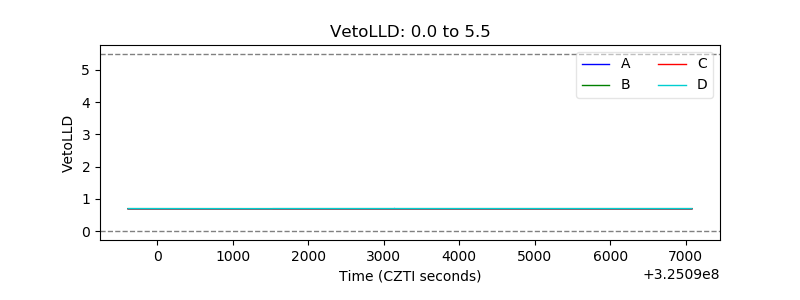 |
| Alpha Counter | 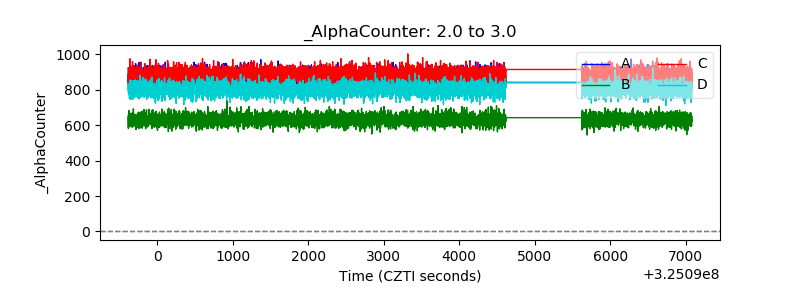 |
| _CPM_Rate | 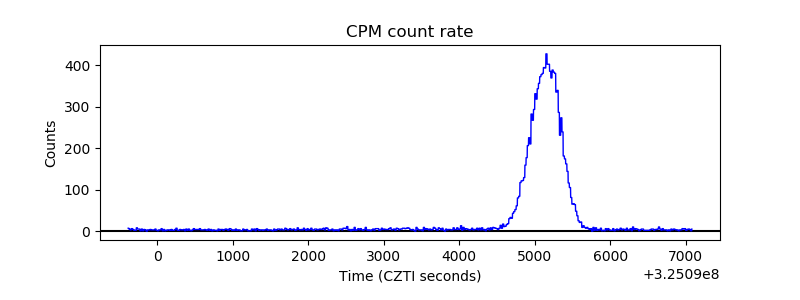 |
| CZT Counter | 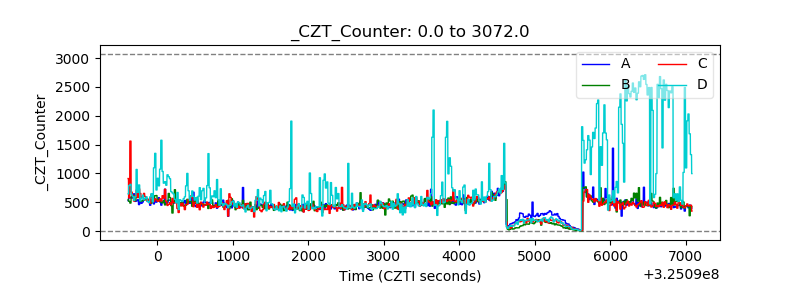 |
| +2.5 Volts monitor |  |
| +5 Volts monitor |  |
| _ROLL_ROT | 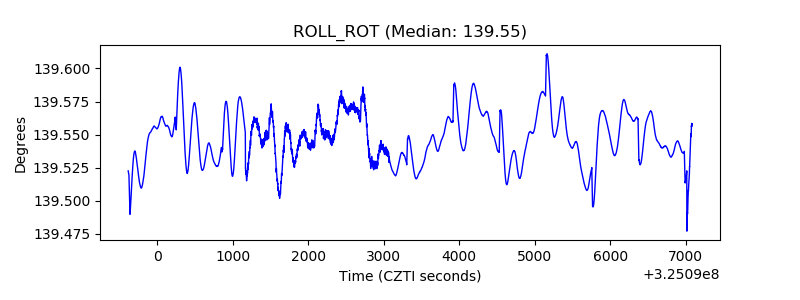 |
| _Roll_DEC | 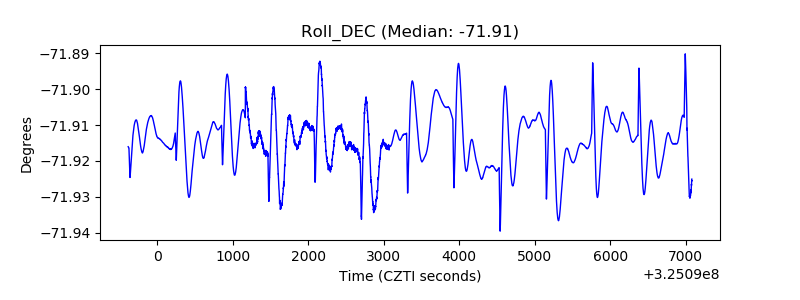 |
| _Roll_RA | 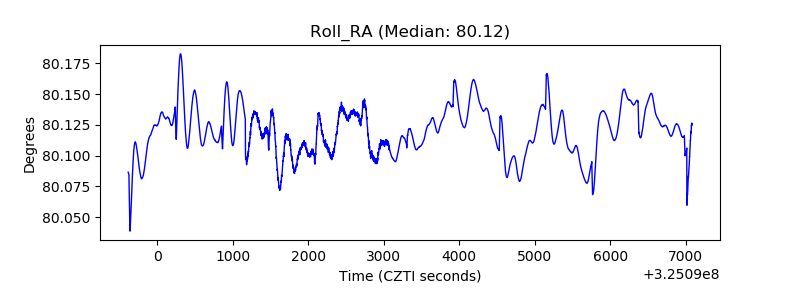 |
| Veto Counter | 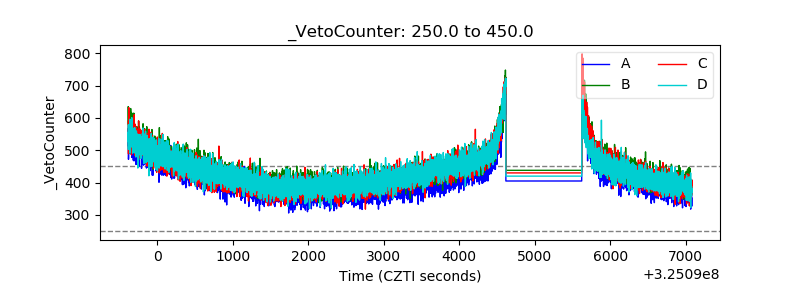 |