| Param | Original file | Final file |
|---|---|---|
| Filename | modeM0/AS1T03_191T01_9000003618_24668cztM0_level2.evt | modeM0/AS1T03_191T01_9000003618_24668cztM0_level2_quad_clean.evt |
| Size (bytes) | 580,227,840 | 135,213,120 |
| Size | 553.3 MB | 128.9 MB |
| Events in quadrant A | 3,285,100 | 940,990 |
| Events in quadrant B | 3,417,887 | 940,519 |
| Events in quadrant C | 3,318,566 | 892,084 |
| Events in quadrant D | 7,074,467 | 832,288 |
| Mode M9 | |||
|---|---|---|---|
| Quadrant | BADHDUFLAG | Total packets | Discarded packets |
| A | 0 | 7 | 0 |
| B | 0 | 7 | 0 |
| C | 0 | 7 | 0 |
| D | 0 | 7 | 0 |
| Mode M0 | |||
|---|---|---|---|
| Quadrant | BADHDUFLAG | Total packets | Discarded packets |
| A | 0 | 14384 | 2 |
| B | 0 | 14637 | 2 |
| C | 0 | 14414 | 2 |
| D | 0 | 25837 | 2 |
| Mode SS | |||
|---|---|---|---|
| Quadrant | BADHDUFLAG | Total packets | Discarded packets |
| A | 0 | 144 | 0 |
| B | 0 | 144 | 0 |
| C | 0 | 144 | 0 |
| D | 0 | 144 | 0 |
| Quadrant | Total seconds | Saturated seconds | Saturation percentage |
|---|---|---|---|
| A | 7025 | 36 | 0.512456% |
| B | 7026 | 66 | 0.939368% |
| C | 7026 | 67 | 0.953601% |
| D | 7026 | 1080 | 15.371477% |
Noise dominated data is calculated using 1-second bins in cleaned event files. If a bin has >2000 counts, and if more than 50% of those come from <1% of pixels, then it is considered to be noise-dominated and hence unusable.
| Quadrant | # 1 sec bins | Bins with >0 counts | Bins with >2000 counts | High rate bins dominated by noise | Noise dominated (total time) | Noise dominated (detector-on time) | Marked lightcurve |
|---|---|---|---|---|---|---|---|
| A | 7690 | 7027 | 1 | 1 | 0.01% | 0.01% | 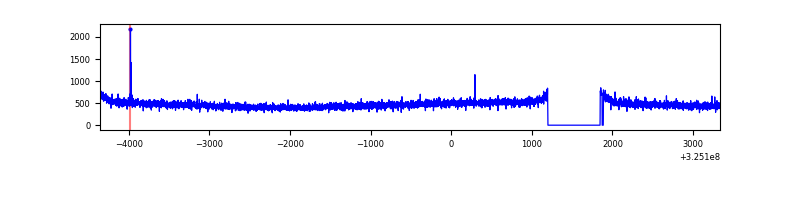 |
| B | 7691 | 7028 | 0 | 0 | 0.00% | 0.00% | 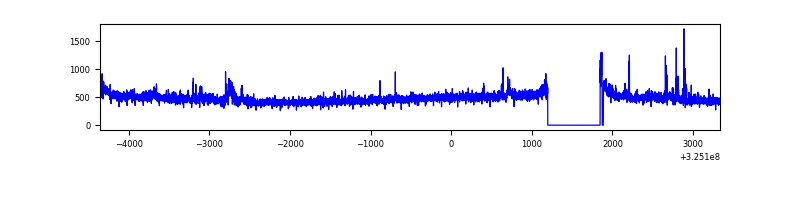 |
| C | 7691 | 7028 | 0 | 0 | 0.00% | 0.00% | 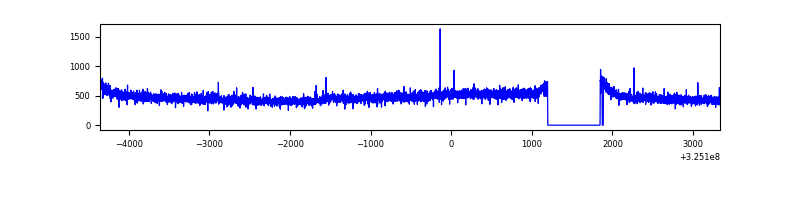 |
| D | 7691 | 7028 | 1017 | 1017 | 13.22% | 14.47% | 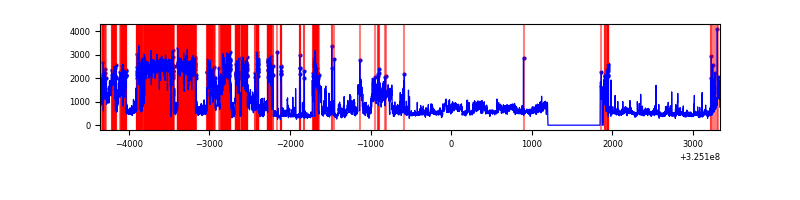 |
Top three noisy pixels from each quadrant. If the there are fewer than three noisy pixels in the level2.evt file, extra rows are filled as -1
| Pixel properties | Quadrant properties | ||||||
|---|---|---|---|---|---|---|---|
| Quadrant | DetID | PixID | Counts | Sigma | Mean | Median | Sigma |
| A | 13 | 254 | 12835 | 70.65 | 849 | 832 | 169.9 |
| A | 3 | 137 | 7676 | 40.28 | 849 | 832 | 169.9 |
| A | 0 | 226 | 7464 | 39.04 | 849 | 832 | 169.9 |
| B | 7 | 202 | 58217 | 361.94 | 838 | 817 | 158.6 |
| B | 0 | 189 | 32452 | 199.48 | 838 | 817 | 158.6 |
| B | 0 | 190 | 22749 | 138.29 | 838 | 817 | 158.6 |
| C | 14 | 238 | 129184 | 692.53 | 800 | 803 | 185.4 |
| C | 7 | 247 | 56581 | 300.89 | 800 | 803 | 185.4 |
| C | 2 | 16 | 8041 | 39.04 | 800 | 803 | 185.4 |
| D | 1 | 52 | 3763514 | 19656.42 | 786 | 764 | 191.4 |
| D | 12 | 235 | 184729 | 961.02 | 786 | 764 | 191.4 |
| D | 8 | 195 | 66154 | 341.59 | 786 | 764 | 191.4 |
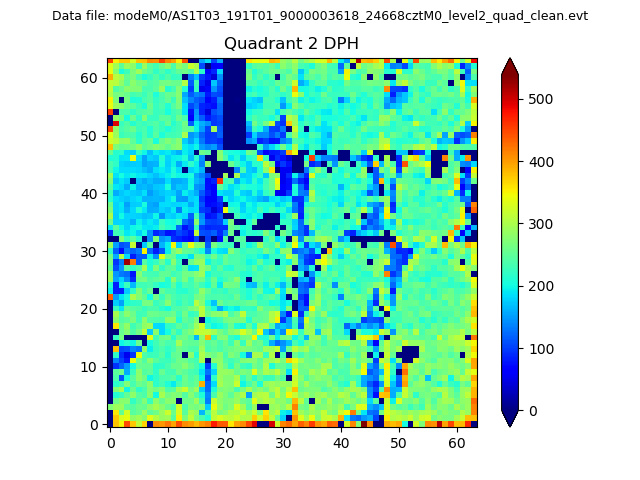
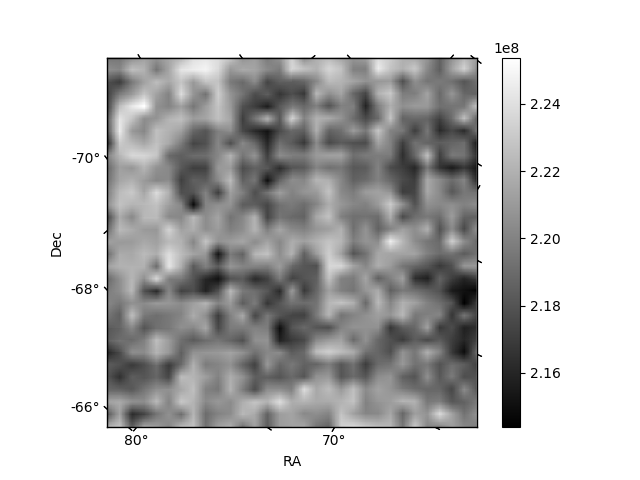
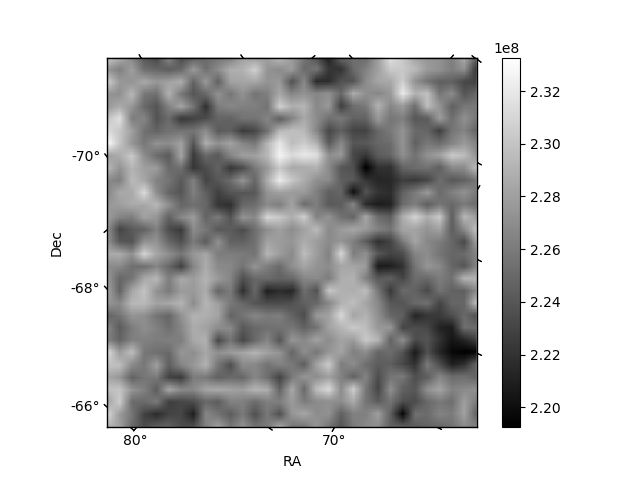
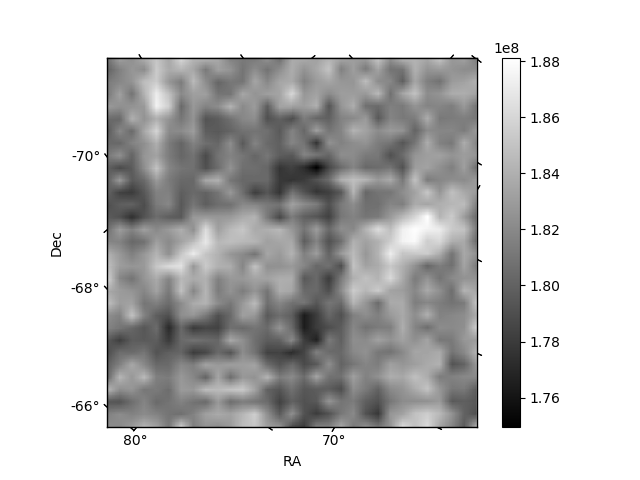
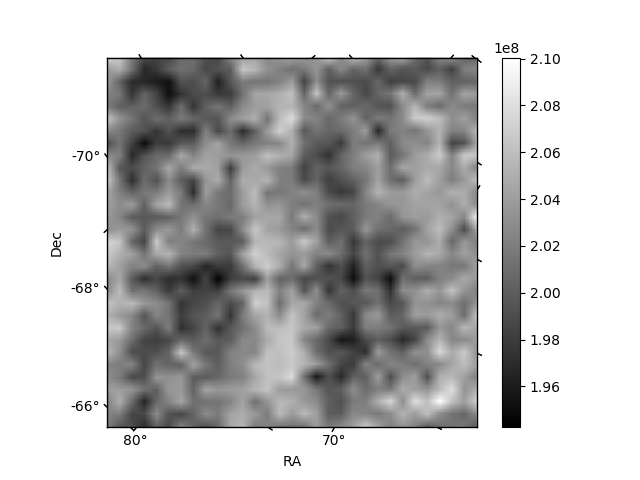
Histogram calculated using DETX and DETY for each event in the final _common_clean file
| Quadrant A | 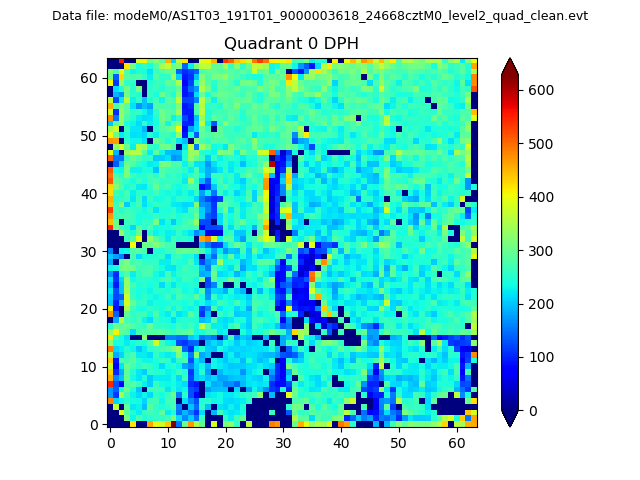 |
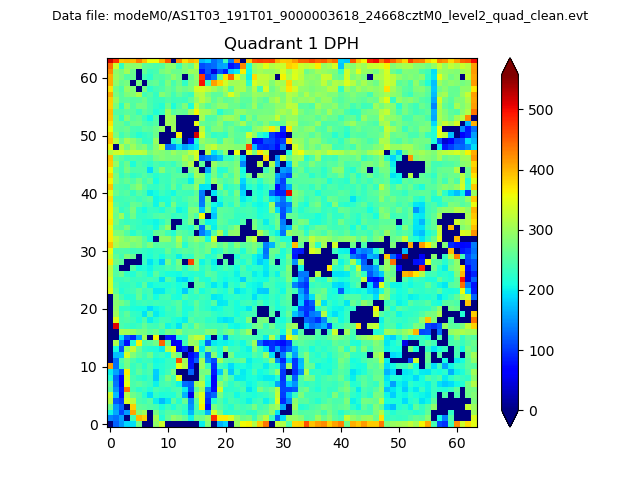 |
Quadrant B |
|---|---|---|---|
| Quadrant D | 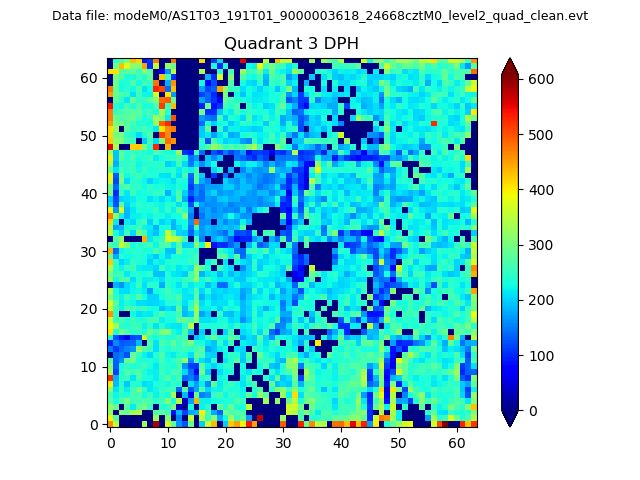 |
 |
Quadrant C |
| Plot type | Count rate plots | Images |
|---|---|---|
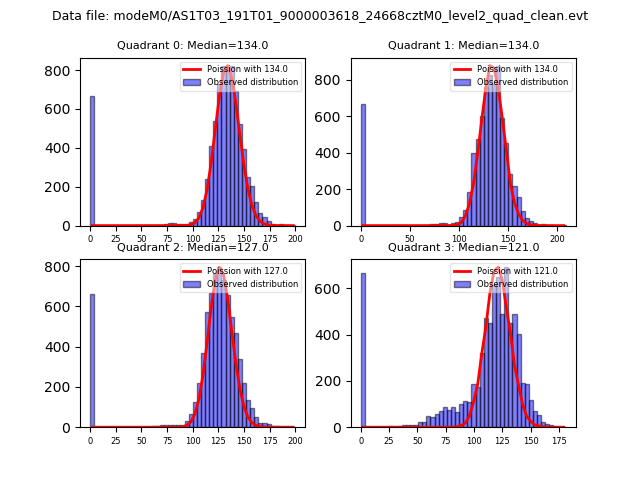
| Comparison with Poisson distribution Blue bars denote a histogram of data divided into 1 sec bins. Red curve is a Poisson curve with rate = median count rate of data. |
 |
 |
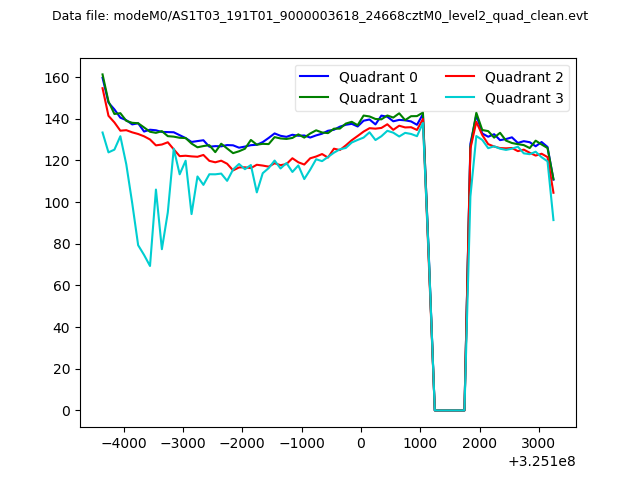
| Quadrant-wise count rates Data is divided into 100 sec bins |
 |
|
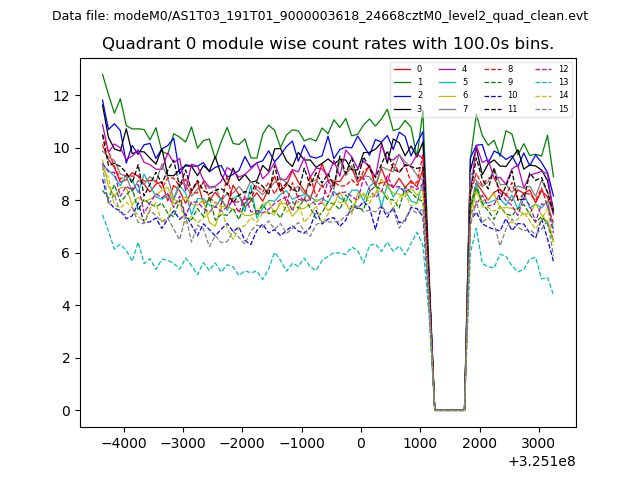
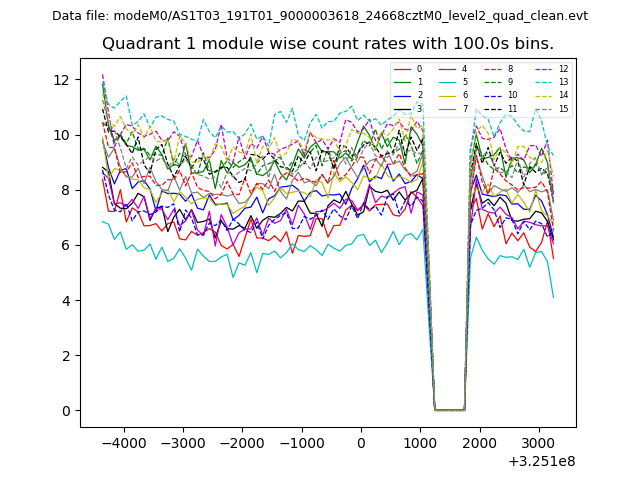
| Module-wise count rates for Quadrant A Data is divided into 100 sec bins |
 |
 |
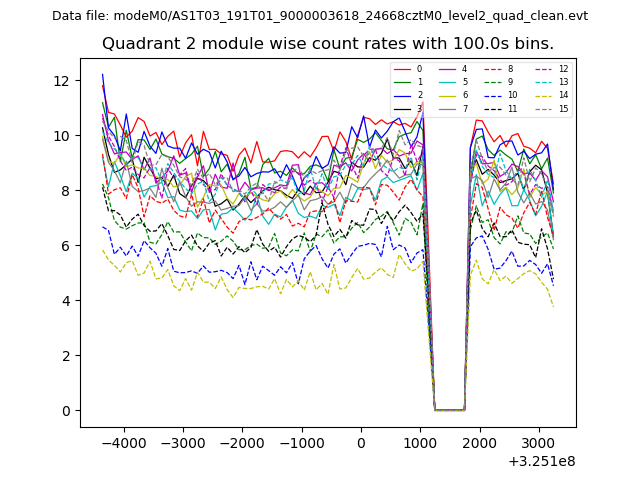
| Module-wise count rates for Quadrant B Data is divided into 100 sec bins |
 |
 |
| Module-wise count rates for Quadrant C Data is divided into 100 sec bins |
 |
 |
| Module-wise count rates for Quadrant D Data is divided into 100 sec bins |
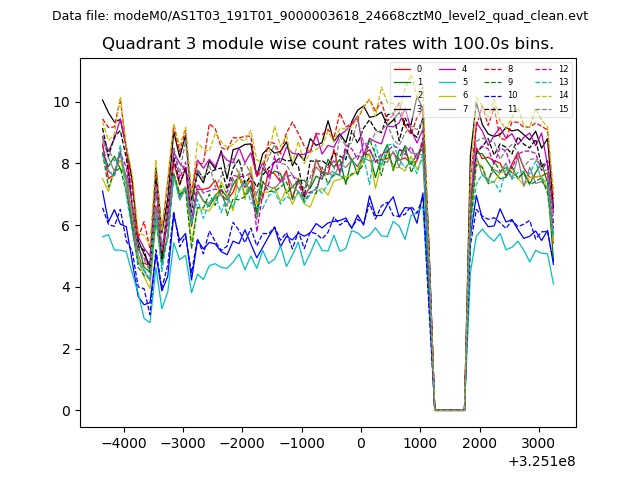 |
 |
| Parameter | Plot |
|---|---|
| CZT HV Monitor | 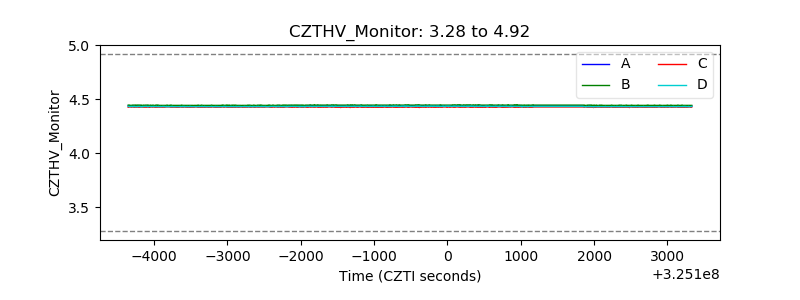 |
| D_VDD | 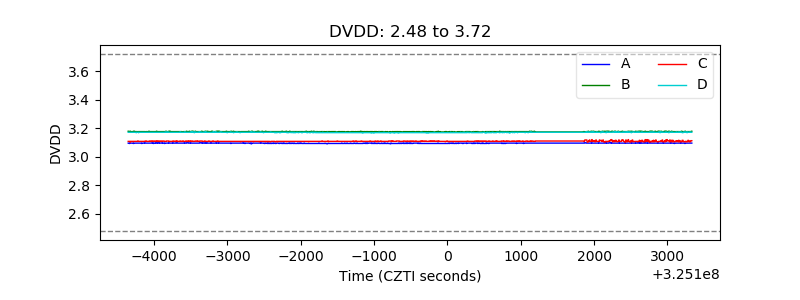 |
| Temperature 1 | 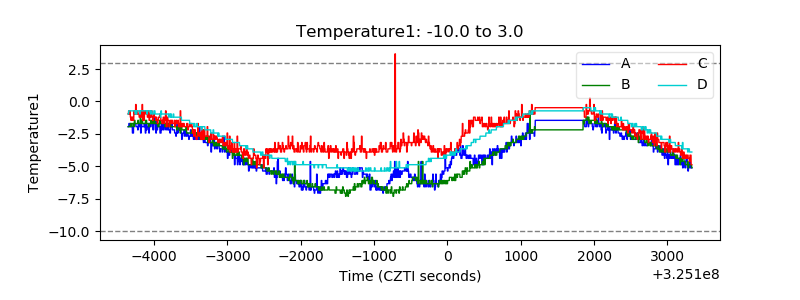 |
| Veto HV Monitor |  |
| Veto LLD | 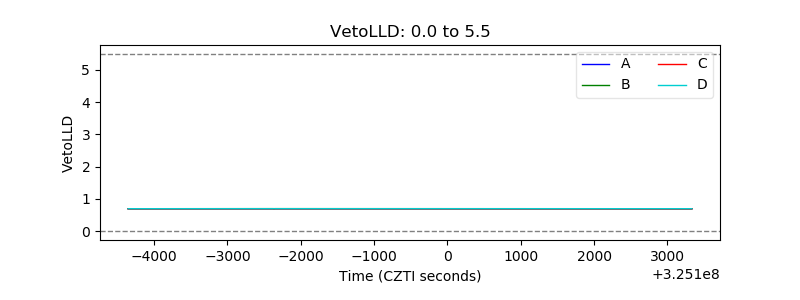 |
| Alpha Counter | 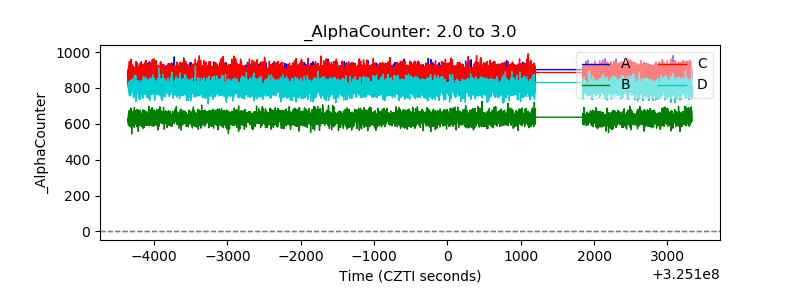 |
| _CPM_Rate | 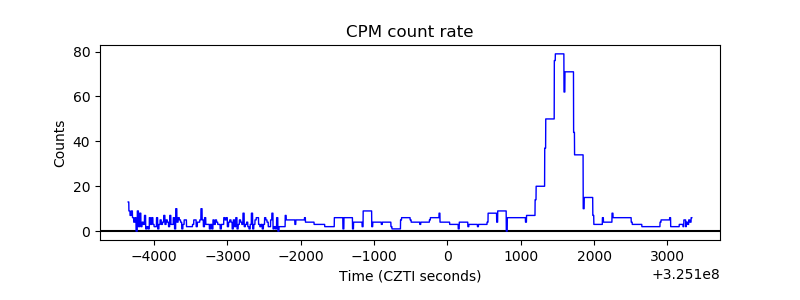 |
| CZT Counter | 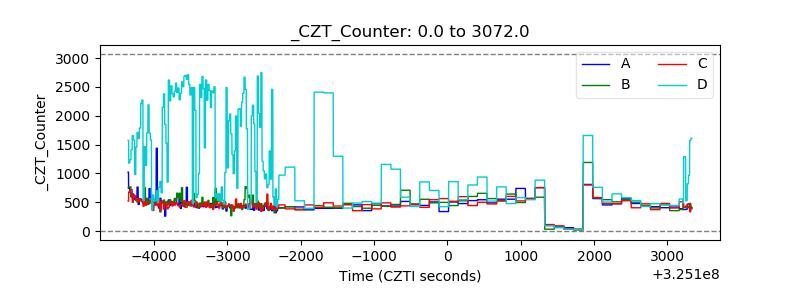 |
| +2.5 Volts monitor |  |
| +5 Volts monitor |  |
| _ROLL_ROT | 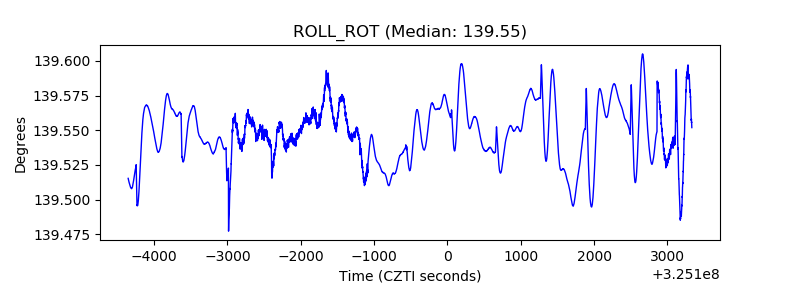 |
| _Roll_DEC | 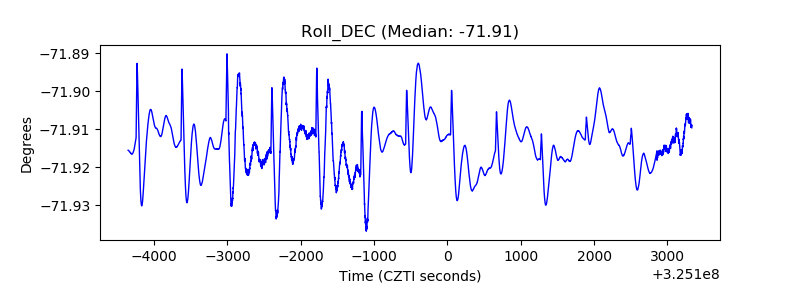 |
| _Roll_RA | 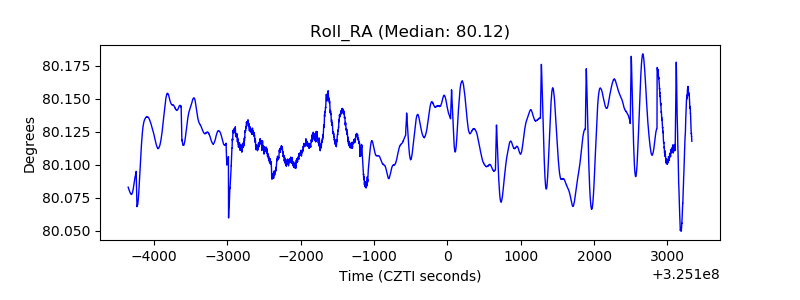 |
| Veto Counter | 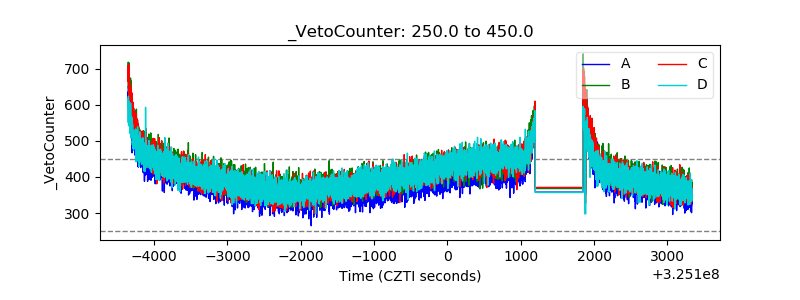 |