| Param | Original file | Final file |
|---|---|---|
| Filename | modeM0/AS1T03_191T01_9000003618_24670cztM0_level2.evt | modeM0/AS1T03_191T01_9000003618_24670cztM0_level2_quad_clean.evt |
| Size (bytes) | 520,128,000 | 142,945,920 |
| Size | 496.0 MB | 136.3 MB |
| Events in quadrant A | 3,531,924 | 979,432 |
| Events in quadrant B | 3,738,630 | 973,773 |
| Events in quadrant C | 3,546,433 | 926,240 |
| Events in quadrant D | 4,419,682 | 922,249 |
| Mode M9 | |||
|---|---|---|---|
| Quadrant | BADHDUFLAG | Total packets | Discarded packets |
| A | 0 | 2 | 0 |
| B | 0 | 3 | 0 |
| C | 0 | 3 | 0 |
| D | 0 | 3 | 0 |
| Mode M0 | |||
|---|---|---|---|
| Quadrant | BADHDUFLAG | Total packets | Discarded packets |
| A | 0 | 15652 | 2 |
| B | 0 | 16061 | 2 |
| C | 0 | 15610 | 2 |
| D | 0 | 18328 | 2 |
| Mode SS | |||
|---|---|---|---|
| Quadrant | BADHDUFLAG | Total packets | Discarded packets |
| A | 0 | 154 | 0 |
| B | 0 | 154 | 0 |
| C | 0 | 154 | 0 |
| D | 0 | 154 | 0 |
| Quadrant | Total seconds | Saturated seconds | Saturation percentage |
|---|---|---|---|
| A | 7588 | 62 | 0.817080% |
| B | 7588 | 136 | 1.792304% |
| C | 7587 | 107 | 1.410307% |
| D | 7587 | 138 | 1.818901% |
Noise dominated data is calculated using 1-second bins in cleaned event files. If a bin has >2000 counts, and if more than 50% of those come from <1% of pixels, then it is considered to be noise-dominated and hence unusable.
| Quadrant | # 1 sec bins | Bins with >0 counts | Bins with >2000 counts | High rate bins dominated by noise | Noise dominated (total time) | Noise dominated (detector-on time) | Marked lightcurve |
|---|---|---|---|---|---|---|---|
| A | 7838 | 7589 | 1 | 1 | 0.01% | 0.01% |  |
| B | 7838 | 7589 | 10 | 10 | 0.13% | 0.13% | 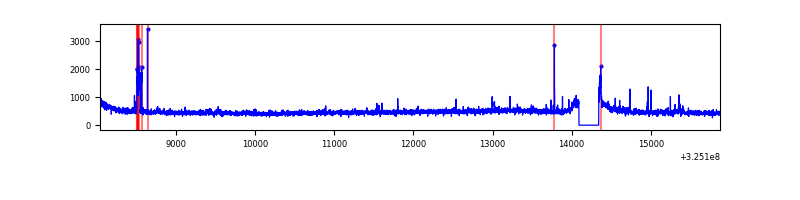 |
| C | 7837 | 7588 | 0 | 0 | 0.00% | 0.00% | 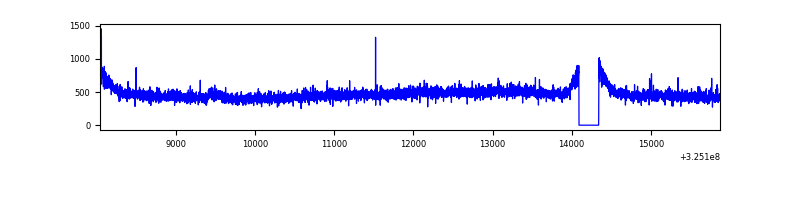 |
| D | 7837 | 7588 | 79 | 79 | 1.01% | 1.04% | 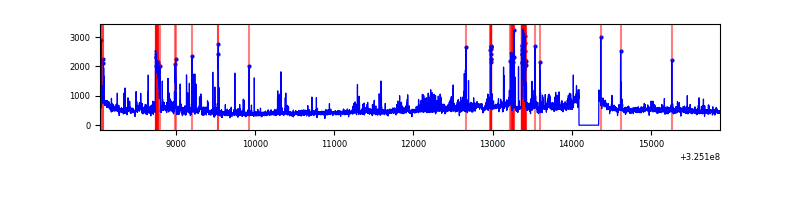 |
Top three noisy pixels from each quadrant. If the there are fewer than three noisy pixels in the level2.evt file, extra rows are filled as -1
| Pixel properties | Quadrant properties | ||||||
|---|---|---|---|---|---|---|---|
| Quadrant | DetID | PixID | Counts | Sigma | Mean | Median | Sigma |
| A | 12 | 96 | 18955 | 99.19 | 910 | 887 | 182.2 |
| A | 13 | 254 | 13375 | 68.55 | 910 | 887 | 182.2 |
| A | 3 | 137 | 8325 | 40.83 | 910 | 887 | 182.2 |
| B | 7 | 205 | 68644 | 395.21 | 901 | 879 | 171.5 |
| B | 7 | 202 | 36604 | 208.35 | 901 | 879 | 171.5 |
| B | 0 | 189 | 27982 | 158.07 | 901 | 879 | 171.5 |
| C | 14 | 238 | 139693 | 691.31 | 860 | 864 | 200.8 |
| C | 7 | 247 | 25507 | 122.71 | 860 | 864 | 200.8 |
| C | 10 | 91 | 12815 | 59.51 | 860 | 864 | 200.8 |
| D | 1 | 52 | 1023687 | 4835.92 | 876 | 847 | 211.5 |
| D | 8 | 195 | 50379 | 234.18 | 876 | 847 | 211.5 |
| D | 2 | 234 | 33823 | 155.91 | 876 | 847 | 211.5 |
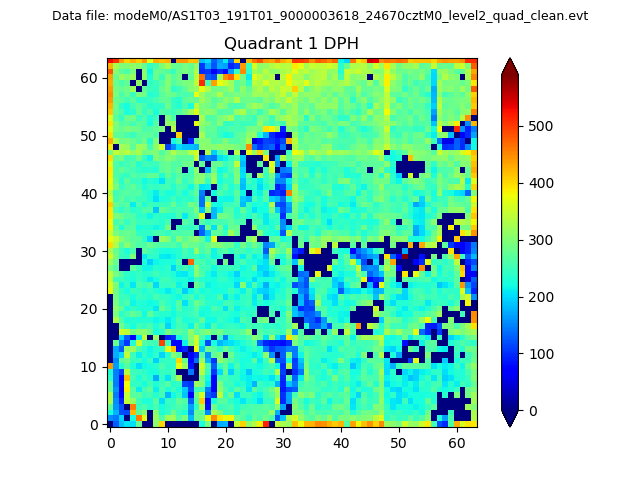
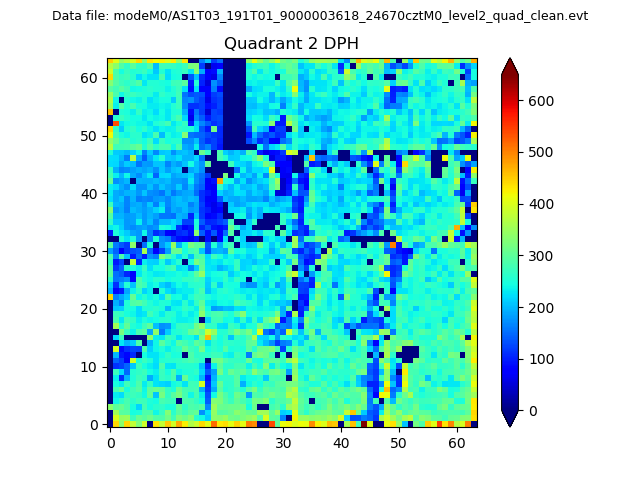
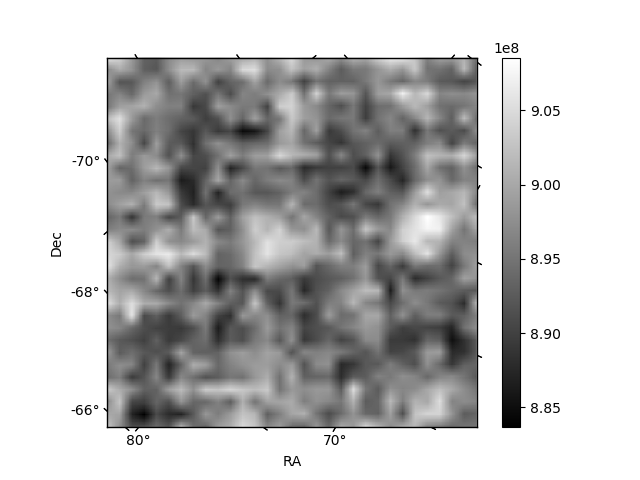
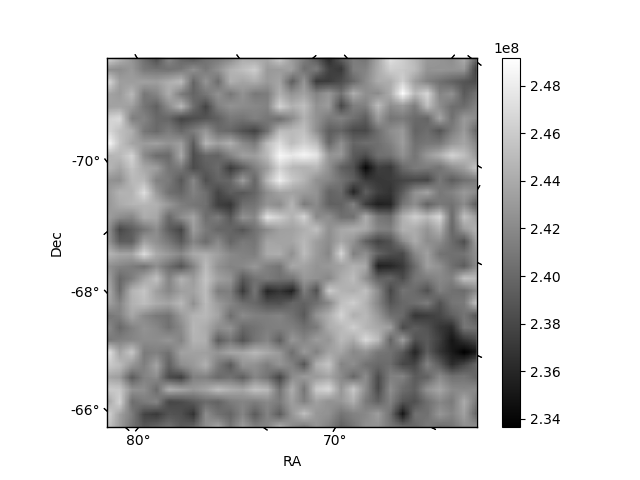
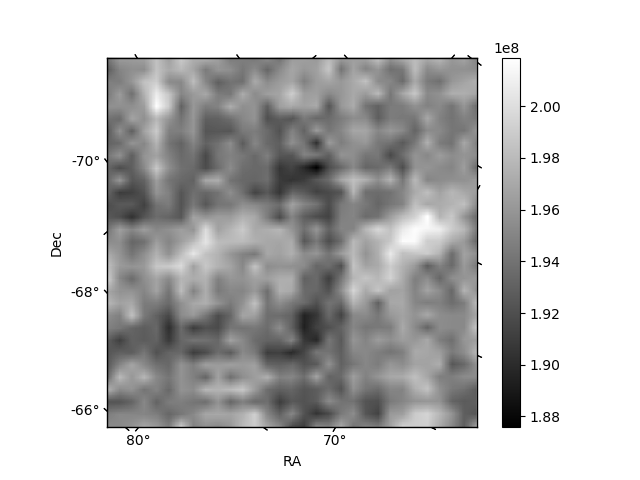
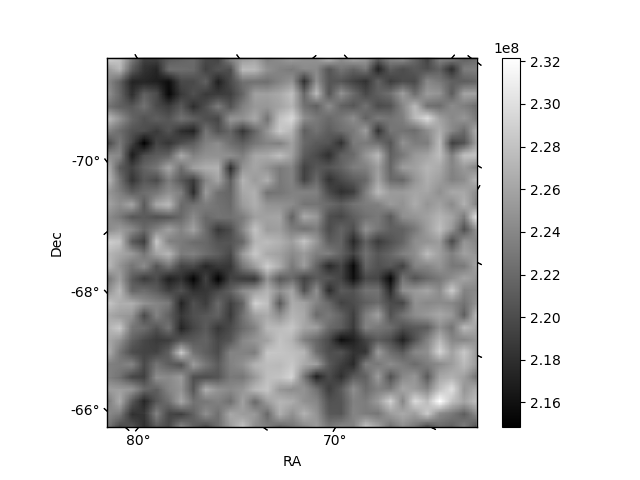
Histogram calculated using DETX and DETY for each event in the final _common_clean file
| Quadrant A | 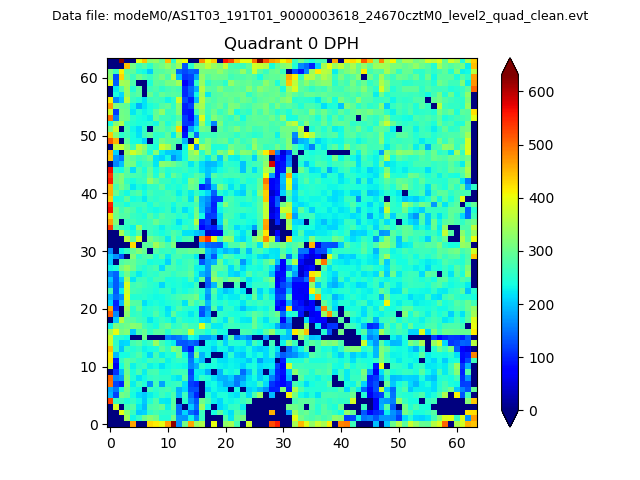 |
 |
Quadrant B |
|---|---|---|---|
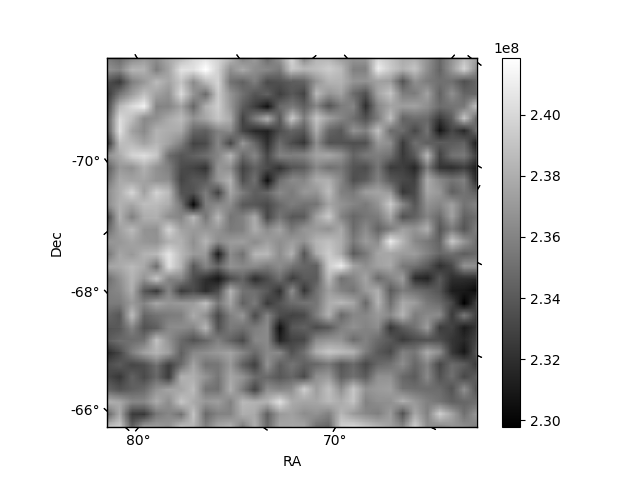
| Quadrant D | 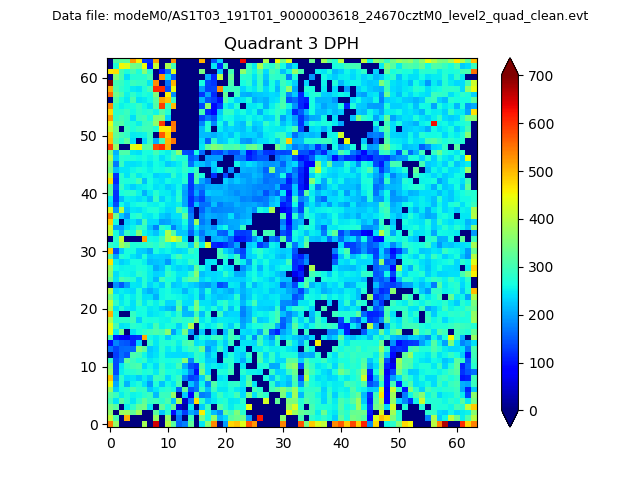 |
 |
Quadrant C |
| Plot type | Count rate plots | Images |
|---|---|---|
| Comparison with Poisson distribution Blue bars denote a histogram of data divided into 1 sec bins. Red curve is a Poisson curve with rate = median count rate of data. |
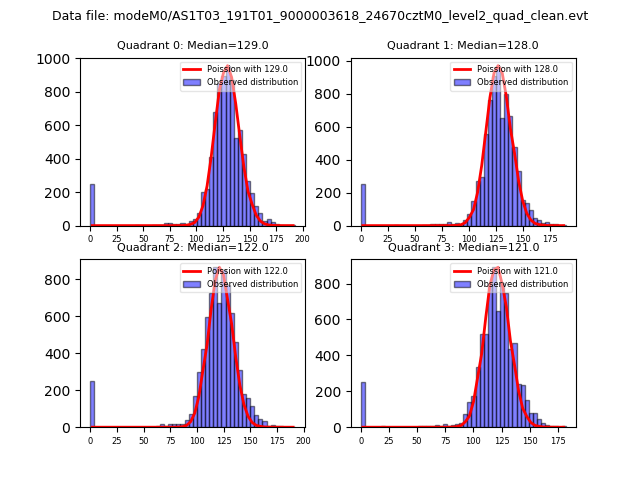 |
 |
| Quadrant-wise count rates Data is divided into 100 sec bins |
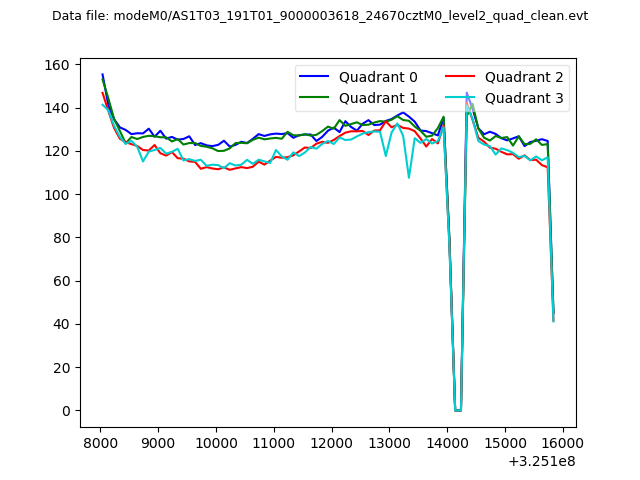 |
|
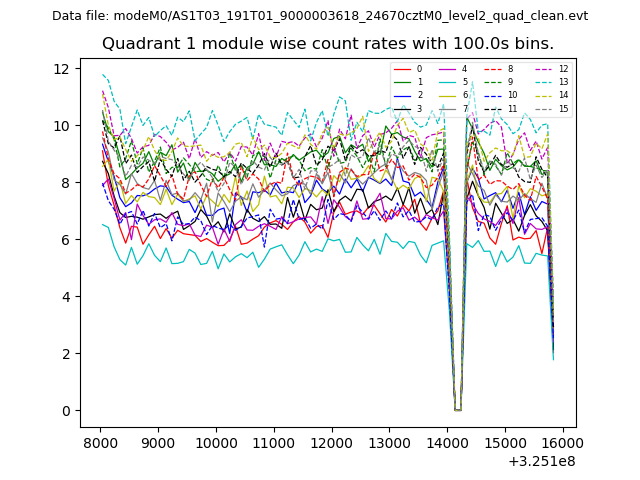
| Module-wise count rates for Quadrant A Data is divided into 100 sec bins |
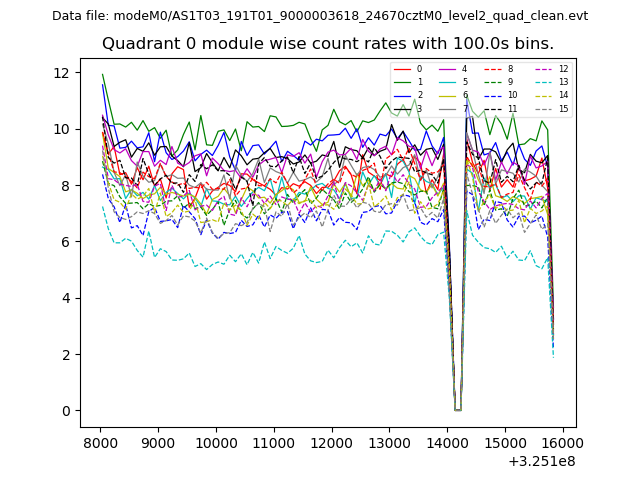 |
 |
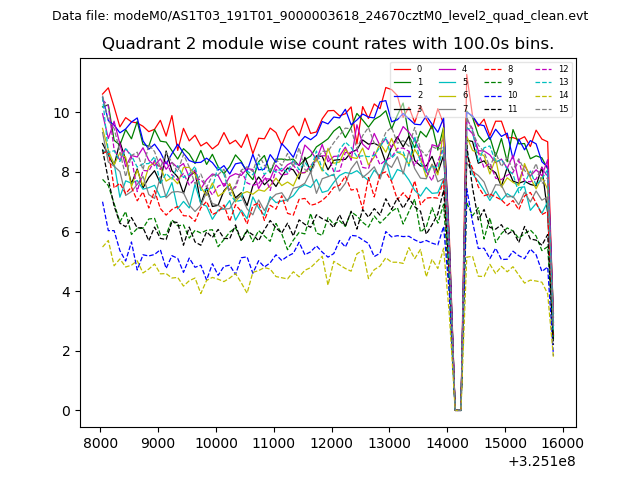
| Module-wise count rates for Quadrant B Data is divided into 100 sec bins |
 |
 |
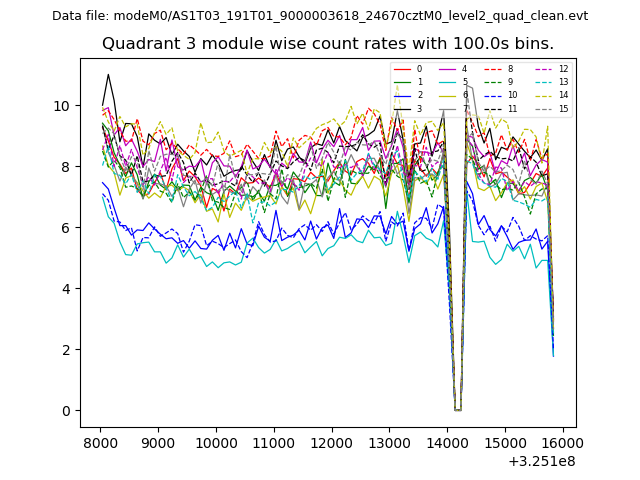
| Module-wise count rates for Quadrant C Data is divided into 100 sec bins |
 |
 |
| Module-wise count rates for Quadrant D Data is divided into 100 sec bins |
 |
 |
| Parameter | Plot |
|---|---|
| CZT HV Monitor | 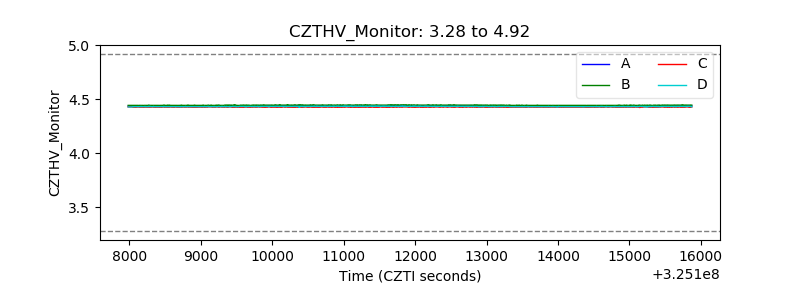 |
| D_VDD | 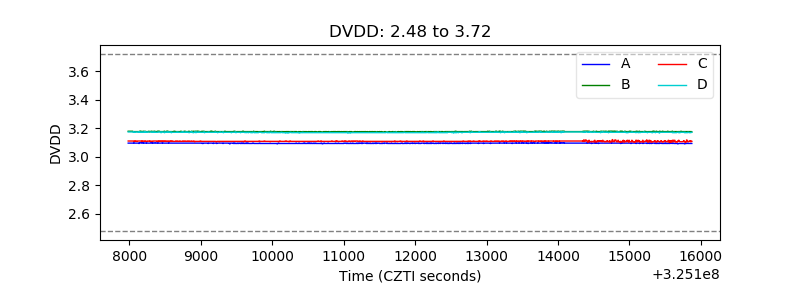 |
| Temperature 1 | 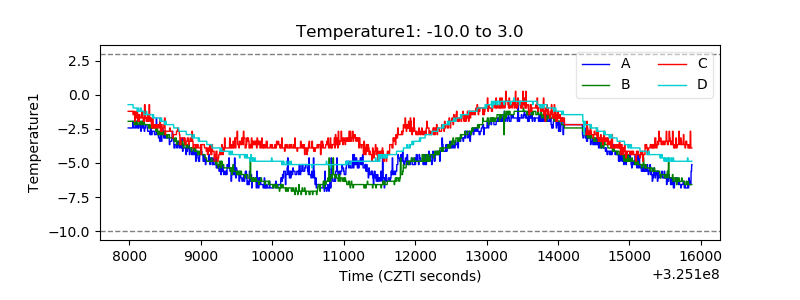 |
| Veto HV Monitor | 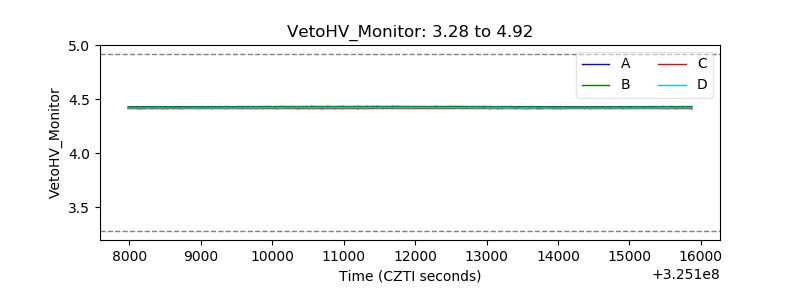 |
| Veto LLD | 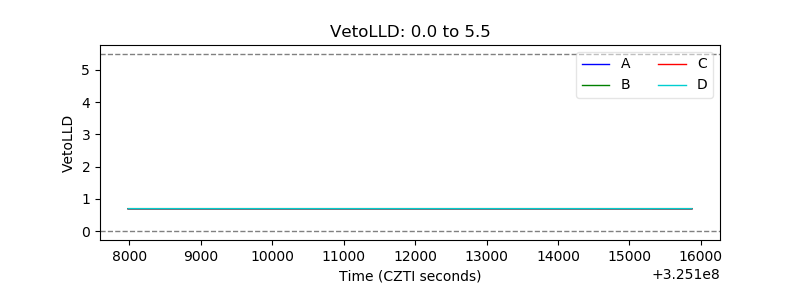 |
| Alpha Counter | 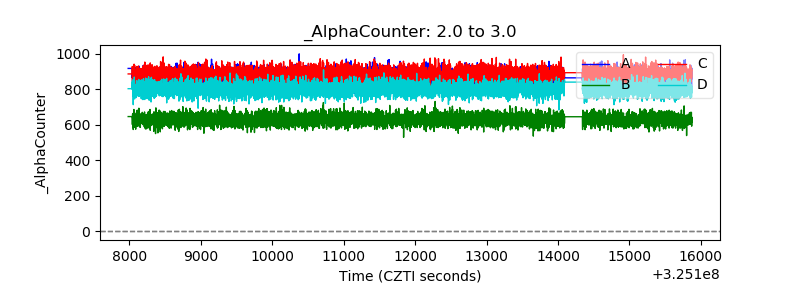 |
| _CPM_Rate | 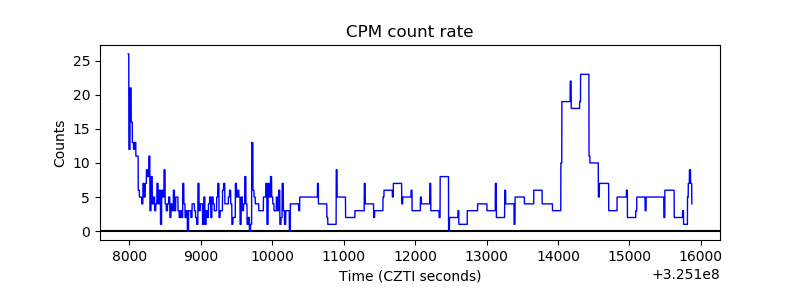 |
| CZT Counter | 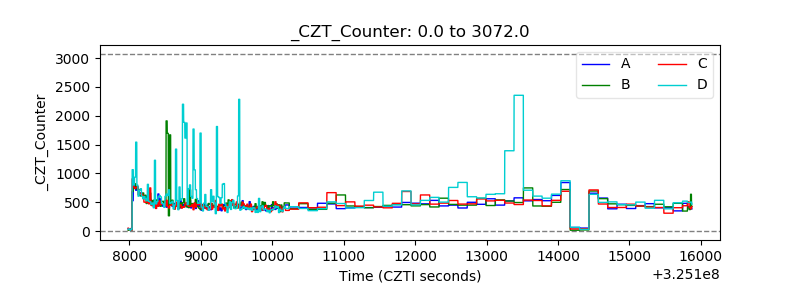 |
| +2.5 Volts monitor |  |
| +5 Volts monitor |  |
| _ROLL_ROT | 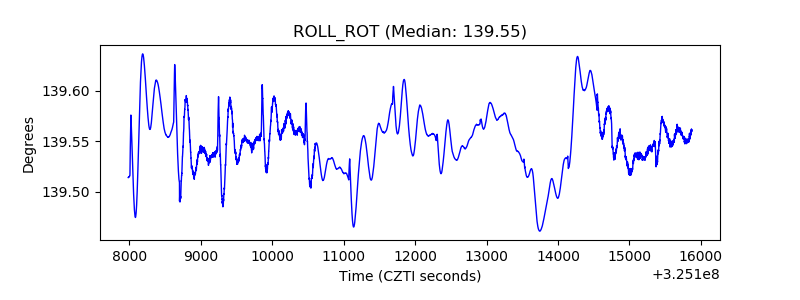 |
| _Roll_DEC | 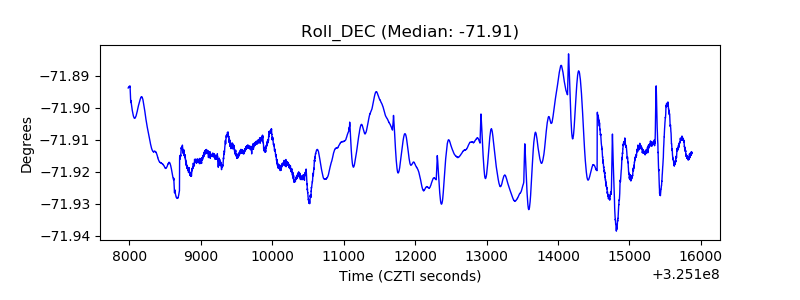 |
| _Roll_RA | 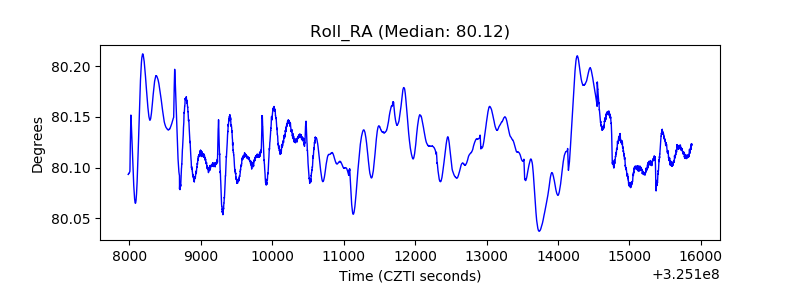 |
| Veto Counter | 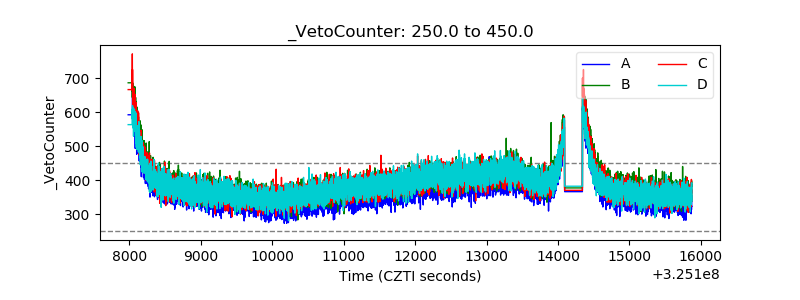 |