| Param | Original file | Final file |
|---|---|---|
| Filename | modeM0/AS1T03_191T01_9000003618_24674cztM0_level2.evt | modeM0/AS1T03_191T01_9000003618_24674cztM0_level2_quad_clean.evt |
| Size (bytes) | 433,782,720 | 124,502,400 |
| Size | 413.7 MB | 118.7 MB |
| Events in quadrant A | 3,031,443 | 846,826 |
| Events in quadrant B | 3,113,342 | 855,362 |
| Events in quadrant C | 3,057,216 | 814,590 |
| Events in quadrant D | 3,496,547 | 804,275 |
| Mode M9 | |||
|---|---|---|---|
| Quadrant | BADHDUFLAG | Total packets | Discarded packets |
| A | 0 | 9 | 0 |
| B | 0 | 9 | 0 |
| C | 0 | 9 | 0 |
| D | 0 | 9 | 0 |
| Mode M0 | |||
|---|---|---|---|
| Quadrant | BADHDUFLAG | Total packets | Discarded packets |
| A | 0 | 13165 | 1 |
| B | 0 | 13284 | 1 |
| C | 0 | 13157 | 1 |
| D | 0 | 14535 | 3 |
| Mode SS | |||
|---|---|---|---|
| Quadrant | BADHDUFLAG | Total packets | Discarded packets |
| A | 0 | 132 | 0 |
| B | 0 | 132 | 0 |
| C | 0 | 132 | 0 |
| D | 0 | 132 | 0 |
| Quadrant | Total seconds | Saturated seconds | Saturation percentage |
|---|---|---|---|
| A | 6446 | 32 | 0.496432% |
| B | 6446 | 42 | 0.651567% |
| C | 6447 | 78 | 1.209865% |
| D | 6446 | 59 | 0.915296% |
Noise dominated data is calculated using 1-second bins in cleaned event files. If a bin has >2000 counts, and if more than 50% of those come from <1% of pixels, then it is considered to be noise-dominated and hence unusable.
| Quadrant | # 1 sec bins | Bins with >0 counts | Bins with >2000 counts | High rate bins dominated by noise | Noise dominated (total time) | Noise dominated (detector-on time) | Marked lightcurve |
|---|---|---|---|---|---|---|---|
| A | 7371 | 6446 | 2 | 2 | 0.03% | 0.03% | 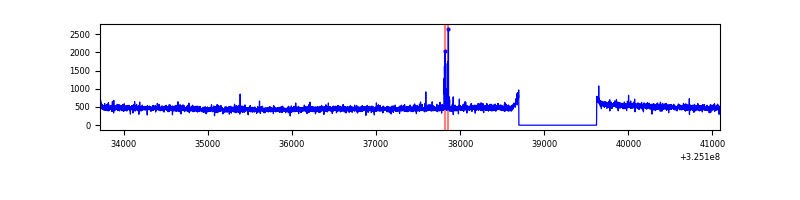 |
| B | 7371 | 6446 | 0 | 0 | 0.00% | 0.00% | 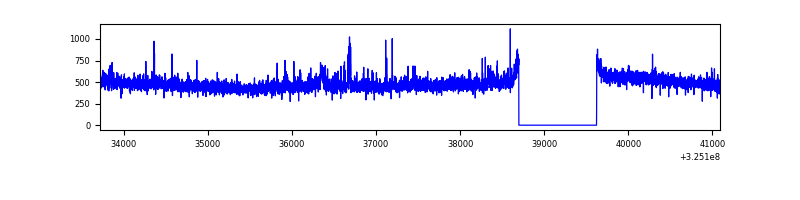 |
| C | 7372 | 6447 | 0 | 0 | 0.00% | 0.00% | 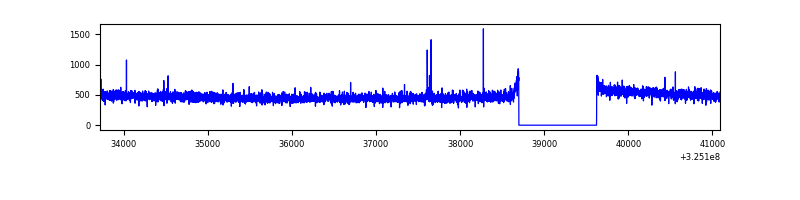 |
| D | 7371 | 6447 | 33 | 33 | 0.45% | 0.51% | 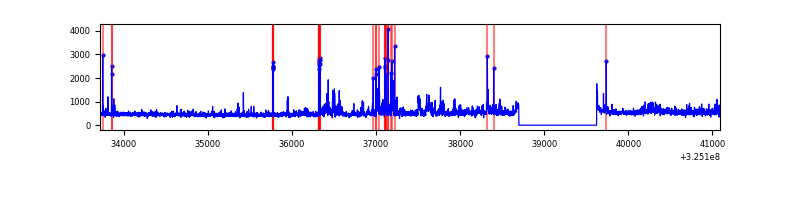 |
Top three noisy pixels from each quadrant. If the there are fewer than three noisy pixels in the level2.evt file, extra rows are filled as -1
| Pixel properties | Quadrant properties | ||||||
|---|---|---|---|---|---|---|---|
| Quadrant | DetID | PixID | Counts | Sigma | Mean | Median | Sigma |
| A | 4 | 2 | 26857 | 166.99 | 778 | 762 | 156.3 |
| A | 13 | 254 | 10610 | 63.02 | 778 | 762 | 156.3 |
| A | 3 | 137 | 7043 | 40.19 | 778 | 762 | 156.3 |
| B | 0 | 189 | 39582 | 264.76 | 773 | 753 | 146.7 |
| B | 7 | 202 | 23072 | 152.18 | 773 | 753 | 146.7 |
| B | 12 | 111 | 18055 | 117.97 | 773 | 753 | 146.7 |
| C | 14 | 238 | 120684 | 687.43 | 750 | 753 | 174.5 |
| C | 2 | 16 | 8210 | 42.74 | 750 | 753 | 174.5 |
| C | 13 | 61 | 5308 | 26.11 | 750 | 753 | 174.5 |
| D | 1 | 52 | 396238 | 2166.19 | 758 | 736 | 182.6 |
| D | 8 | 195 | 226250 | 1235.15 | 758 | 736 | 182.6 |
| D | 2 | 234 | 29082 | 155.25 | 758 | 736 | 182.6 |
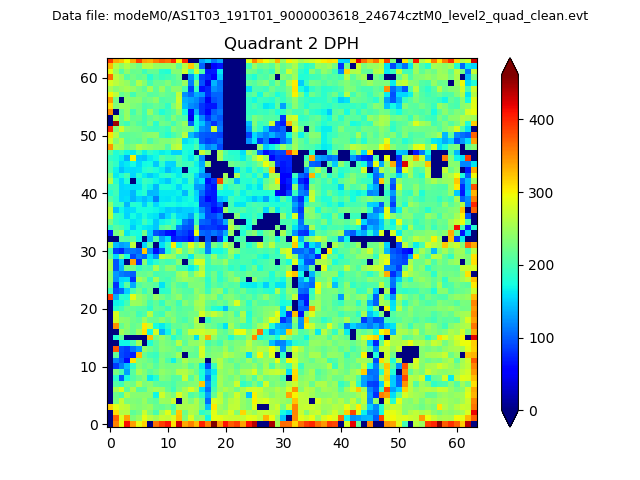
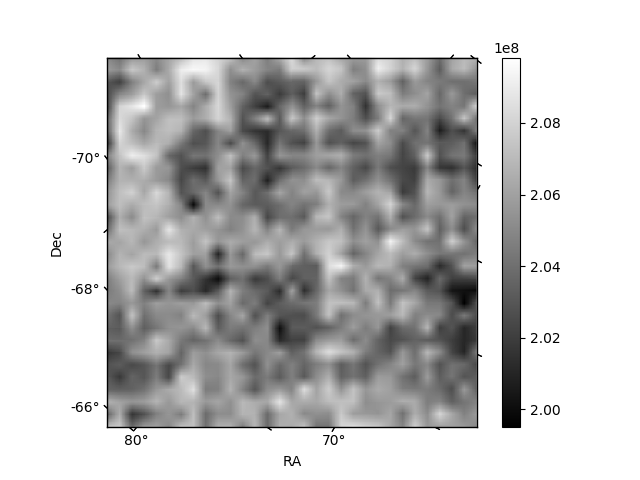
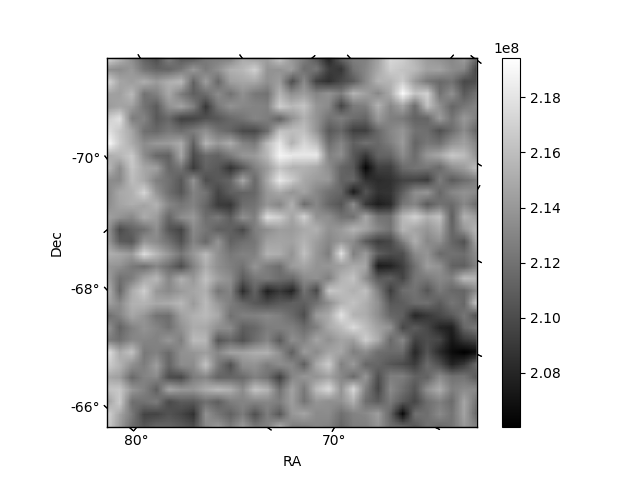
Histogram calculated using DETX and DETY for each event in the final _common_clean file
| Quadrant A |  |
 |
Quadrant B |
|---|---|---|---|
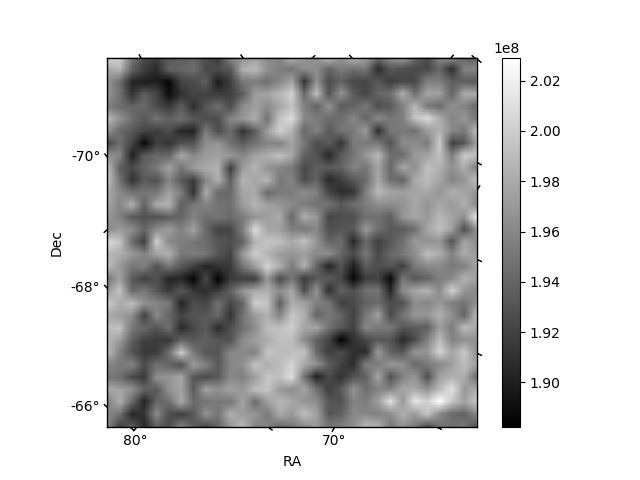
| Quadrant D |  |
 |
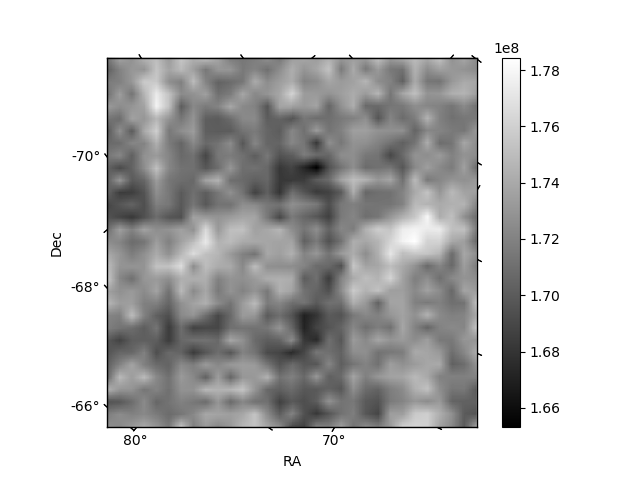
Quadrant C |
| Plot type | Count rate plots | Images |
|---|---|---|
| Comparison with Poisson distribution Blue bars denote a histogram of data divided into 1 sec bins. Red curve is a Poisson curve with rate = median count rate of data. |
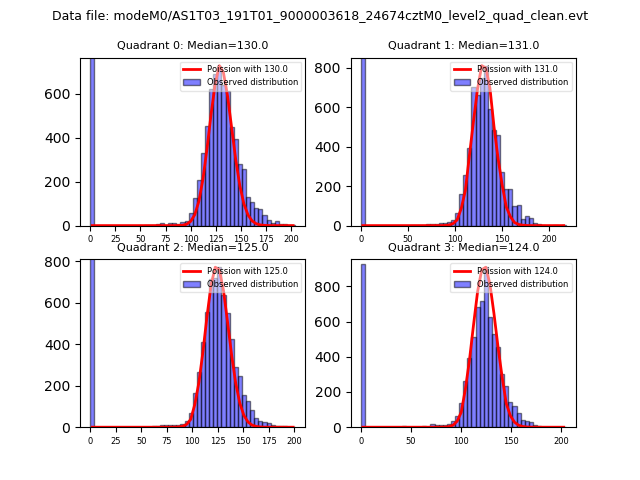 |
 |
| Quadrant-wise count rates Data is divided into 100 sec bins |
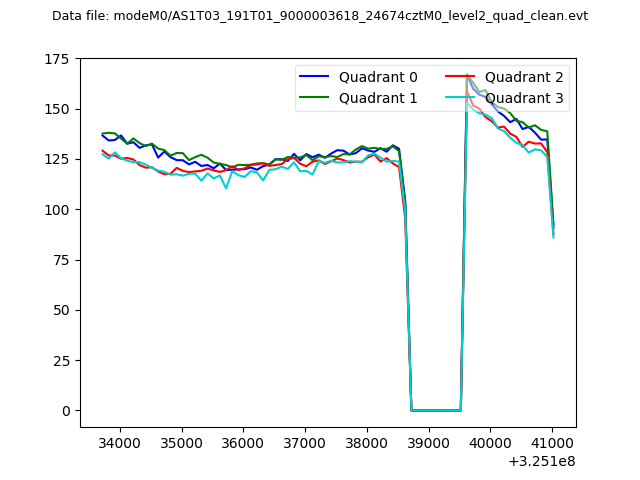 |
|
| Module-wise count rates for Quadrant A Data is divided into 100 sec bins |
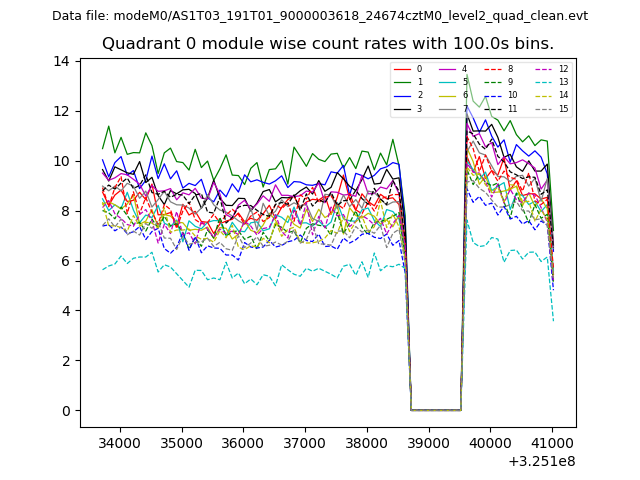 |
 |
| Module-wise count rates for Quadrant B Data is divided into 100 sec bins |
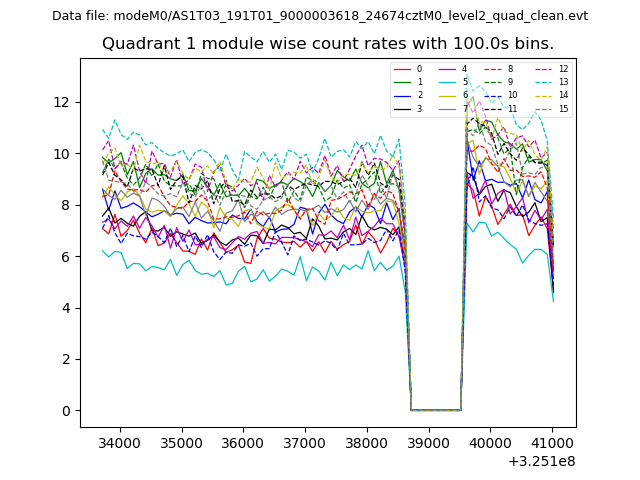 |
 |
| Module-wise count rates for Quadrant C Data is divided into 100 sec bins |
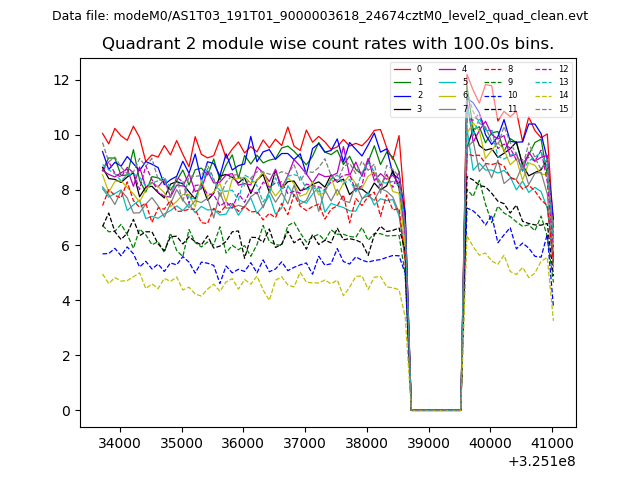 |
 |
| Module-wise count rates for Quadrant D Data is divided into 100 sec bins |
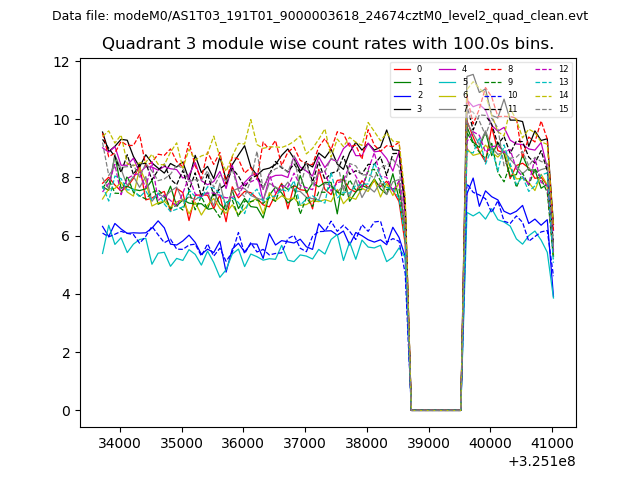 |
 |
| Parameter | Plot |
|---|---|
| CZT HV Monitor | 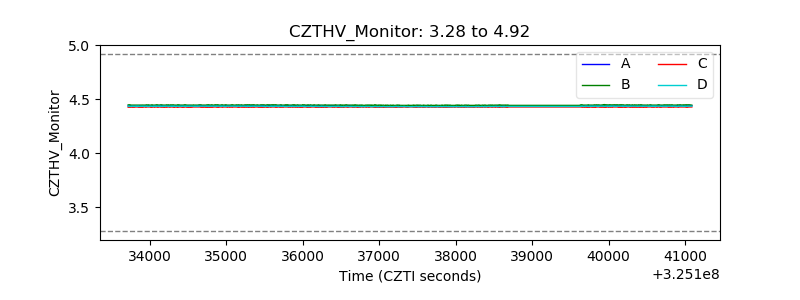 |
| D_VDD | 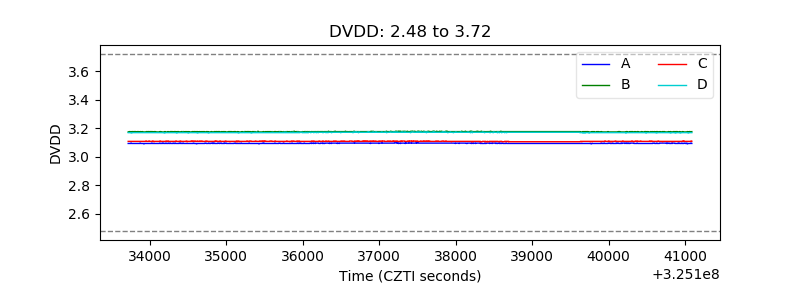 |
| Temperature 1 | 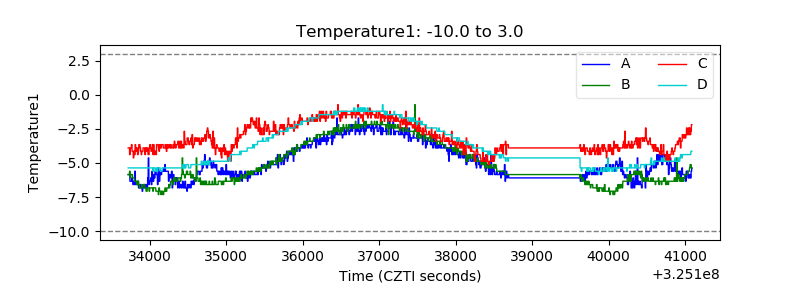 |
| Veto HV Monitor | 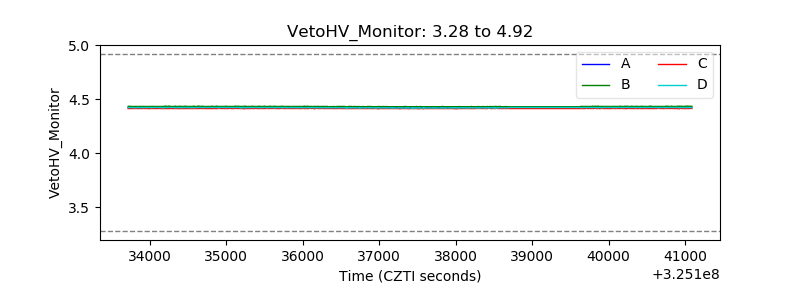 |
| Veto LLD | 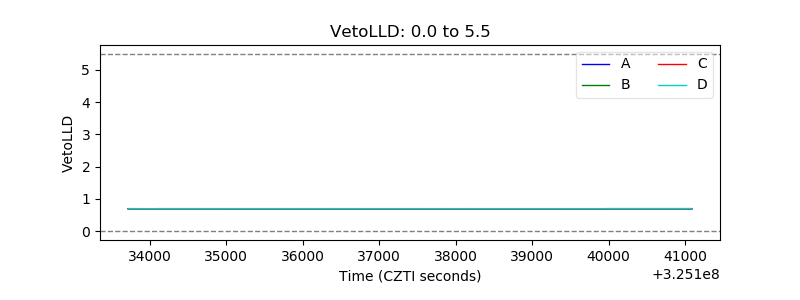 |
| Alpha Counter | 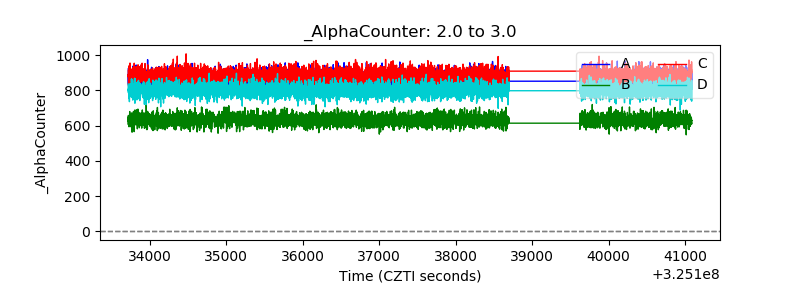 |
| _CPM_Rate | 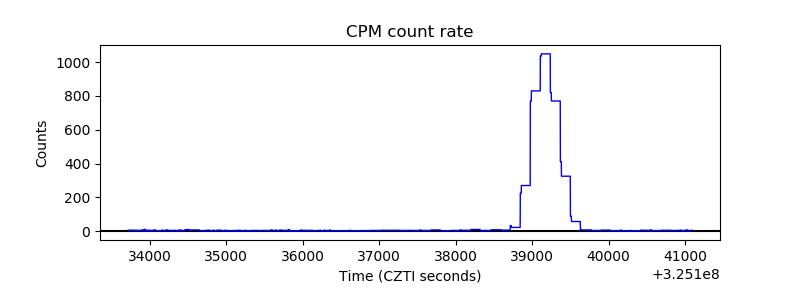 |
| CZT Counter | 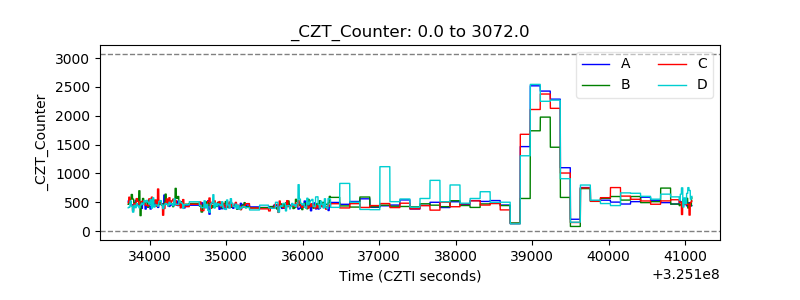 |
| +2.5 Volts monitor | 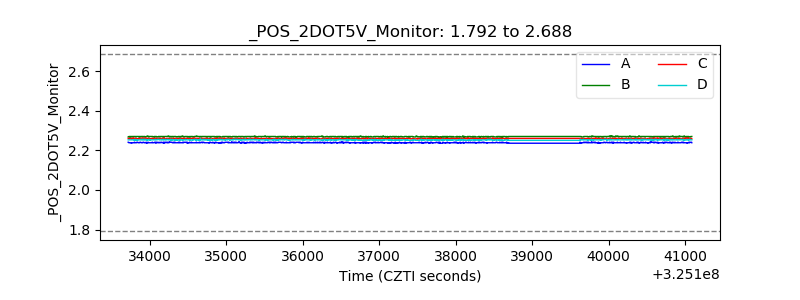 |
| +5 Volts monitor |  |
| _ROLL_ROT | 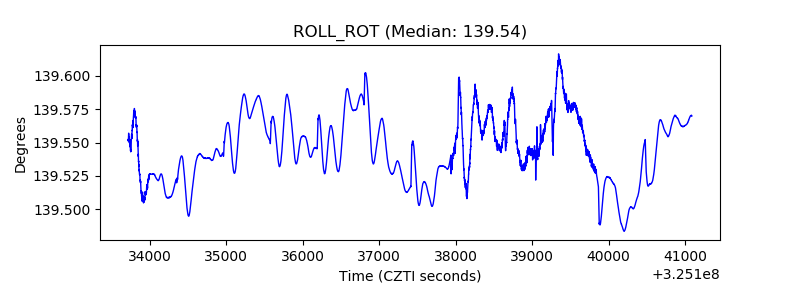 |
| _Roll_DEC | 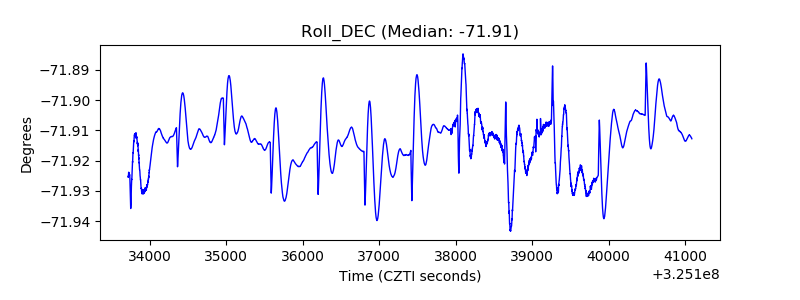 |
| _Roll_RA | 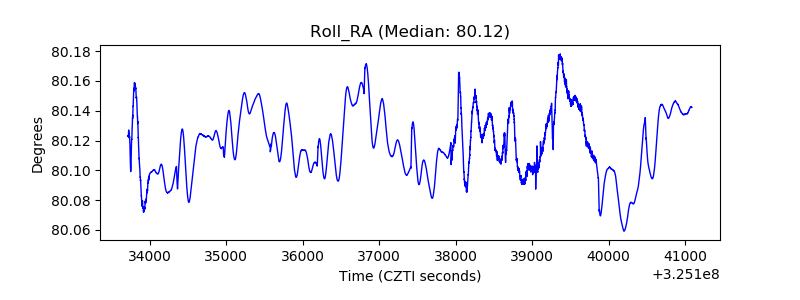 |
| Veto Counter | 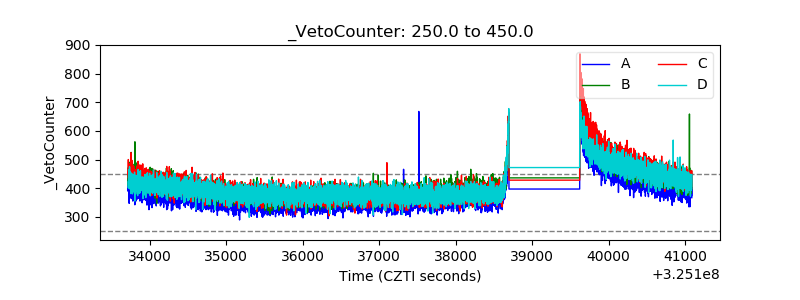 |