| Param | Original file | Final file |
|---|---|---|
| Filename | modeM0/AS1T03_191T01_9000003618_24677cztM0_level2.evt | modeM0/AS1T03_191T01_9000003618_24677cztM0_level2_quad_clean.evt |
| Size (bytes) | 488,479,680 | 135,858,240 |
| Size | 465.9 MB | 129.6 MB |
| Events in quadrant A | 3,179,995 | 939,451 |
| Events in quadrant B | 3,237,666 | 949,887 |
| Events in quadrant C | 3,217,372 | 908,357 |
| Events in quadrant D | 4,733,836 | 880,323 |
| Mode M9 | |||
|---|---|---|---|
| Quadrant | BADHDUFLAG | Total packets | Discarded packets |
| A | 0 | 12 | 0 |
| B | 0 | 12 | 0 |
| C | 0 | 12 | 0 |
| D | 0 | 12 | 0 |
| Mode M0 | |||
|---|---|---|---|
| Quadrant | BADHDUFLAG | Total packets | Discarded packets |
| A | 0 | 13505 | 1 |
| B | 0 | 13636 | 1 |
| C | 0 | 13740 | 1 |
| D | 0 | 18457 | 1 |
| Mode SS | |||
|---|---|---|---|
| Quadrant | BADHDUFLAG | Total packets | Discarded packets |
| A | 0 | 128 | 0 |
| B | 0 | 128 | 0 |
| C | 0 | 128 | 0 |
| D | 0 | 128 | 0 |
| Quadrant | Total seconds | Saturated seconds | Saturation percentage |
|---|---|---|---|
| A | 6257 | 41 | 0.655266% |
| B | 6258 | 58 | 0.926814% |
| C | 6258 | 82 | 1.310323% |
| D | 6258 | 223 | 3.563439% |
Noise dominated data is calculated using 1-second bins in cleaned event files. If a bin has >2000 counts, and if more than 50% of those come from <1% of pixels, then it is considered to be noise-dominated and hence unusable.
| Quadrant | # 1 sec bins | Bins with >0 counts | Bins with >2000 counts | High rate bins dominated by noise | Noise dominated (total time) | Noise dominated (detector-on time) | Marked lightcurve |
|---|---|---|---|---|---|---|---|
| A | 7457 | 6257 | 0 | 0 | 0.00% | 0.00% | 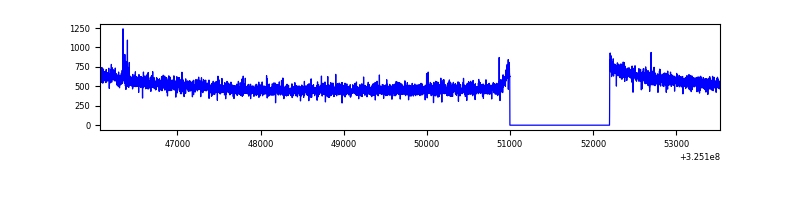 |
| B | 7458 | 6258 | 5 | 5 | 0.07% | 0.08% | 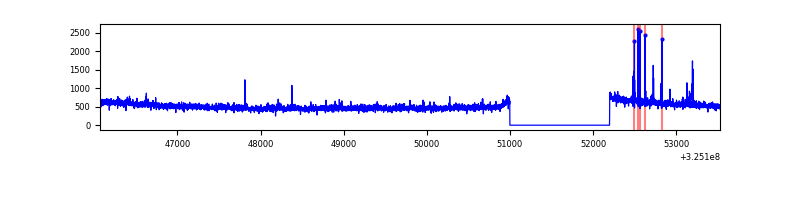 |
| C | 7458 | 6258 | 0 | 0 | 0.00% | 0.00% | 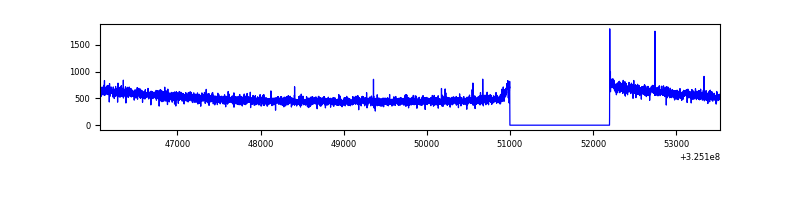 |
| D | 7458 | 6258 | 205 | 205 | 2.75% | 3.28% | 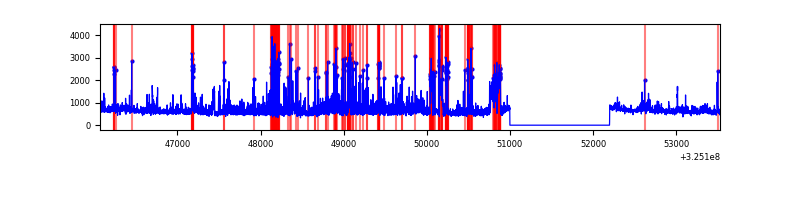 |
Top three noisy pixels from each quadrant. If the there are fewer than three noisy pixels in the level2.evt file, extra rows are filled as -1
| Pixel properties | Quadrant properties | ||||||
|---|---|---|---|---|---|---|---|
| Quadrant | DetID | PixID | Counts | Sigma | Mean | Median | Sigma |
| A | 12 | 96 | 9819 | 55.79 | 822 | 807 | 161.5 |
| A | 13 | 254 | 9479 | 53.68 | 822 | 807 | 161.5 |
| A | 0 | 226 | 7007 | 38.38 | 822 | 807 | 161.5 |
| B | 0 | 189 | 54240 | 350.83 | 810 | 791 | 152.3 |
| B | 12 | 111 | 17458 | 109.4 | 810 | 791 | 152.3 |
| B | 11 | 111 | 16008 | 99.88 | 810 | 791 | 152.3 |
| C | 14 | 238 | 127113 | 700.49 | 789 | 796 | 180.3 |
| C | 13 | 61 | 5447 | 25.79 | 789 | 796 | 180.3 |
| C | 3 | 233 | 4952 | 23.05 | 789 | 796 | 180.3 |
| D | 1 | 52 | 1098090 | 5760.96 | 799 | 776 | 190.5 |
| D | 8 | 195 | 561930 | 2946.09 | 799 | 776 | 190.5 |
| D | 2 | 234 | 24803 | 126.14 | 799 | 776 | 190.5 |
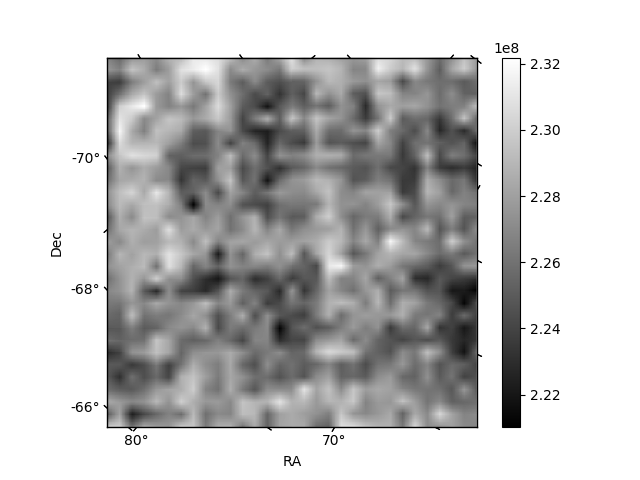
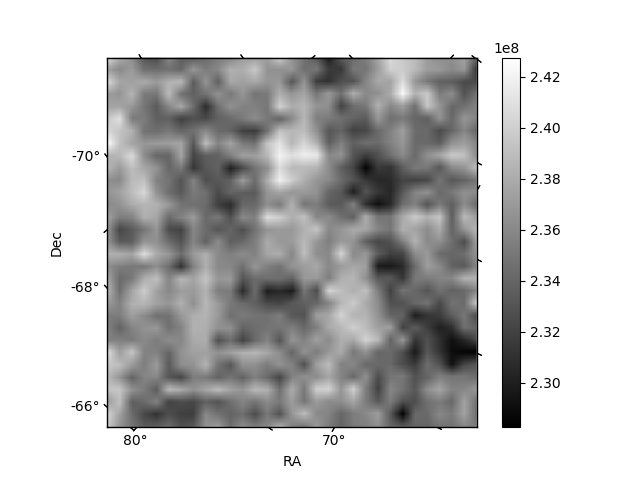
Histogram calculated using DETX and DETY for each event in the final _common_clean file
| Quadrant A |  |
 |
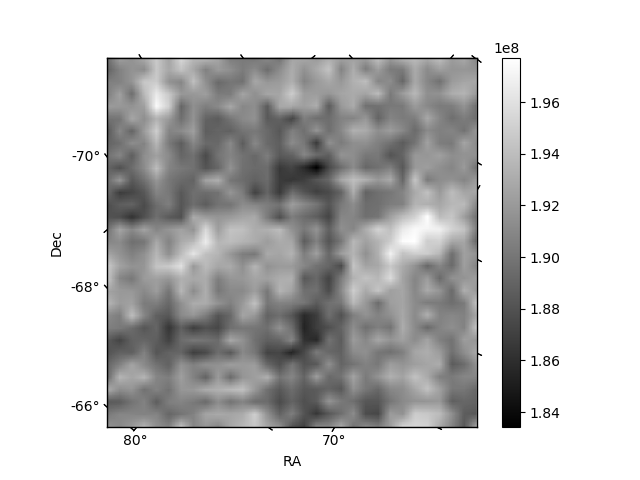
Quadrant B |
|---|---|---|---|
| Quadrant D |  |
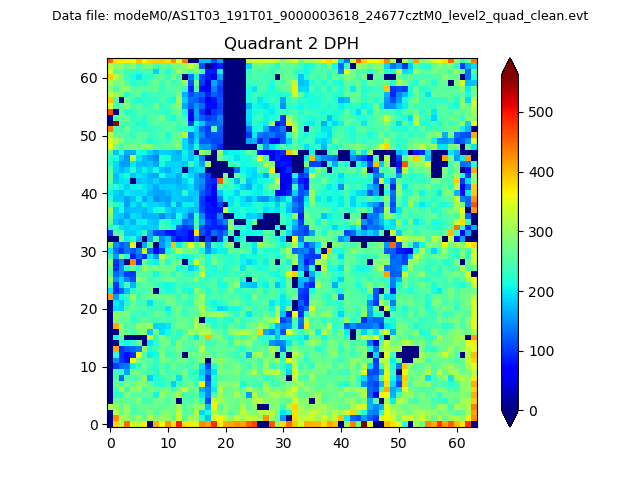 |
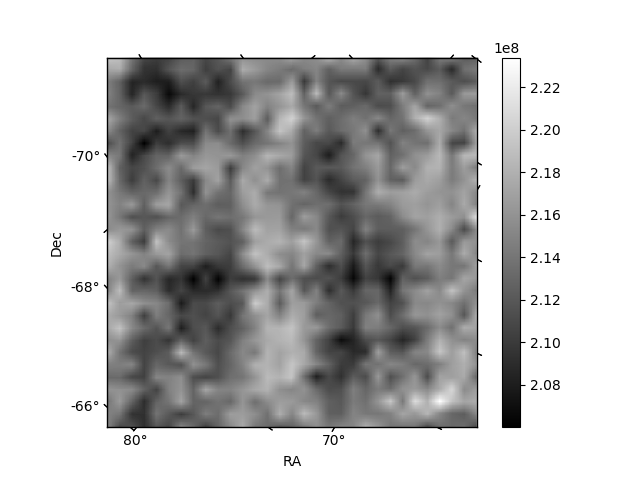
Quadrant C |
| Plot type | Count rate plots | Images |
|---|---|---|
| Comparison with Poisson distribution Blue bars denote a histogram of data divided into 1 sec bins. Red curve is a Poisson curve with rate = median count rate of data. |
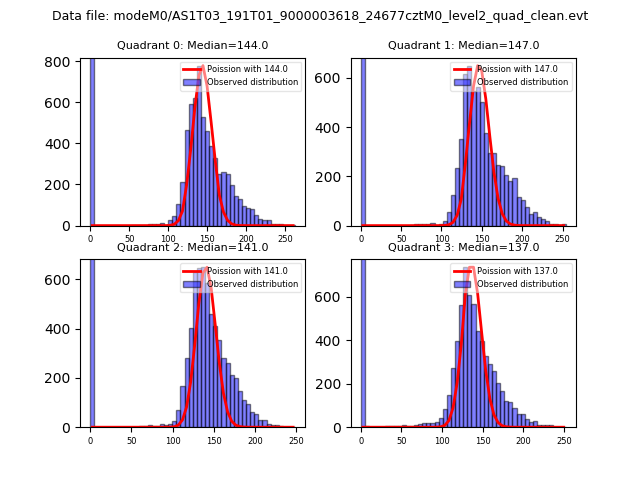 |
 |
| Quadrant-wise count rates Data is divided into 100 sec bins |
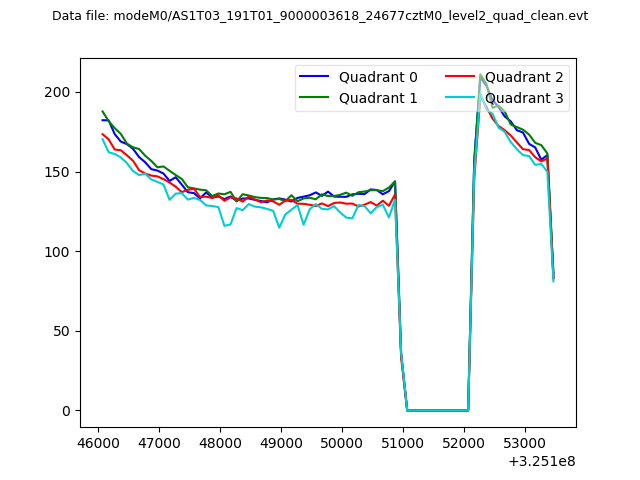 |
|
| Module-wise count rates for Quadrant A Data is divided into 100 sec bins |
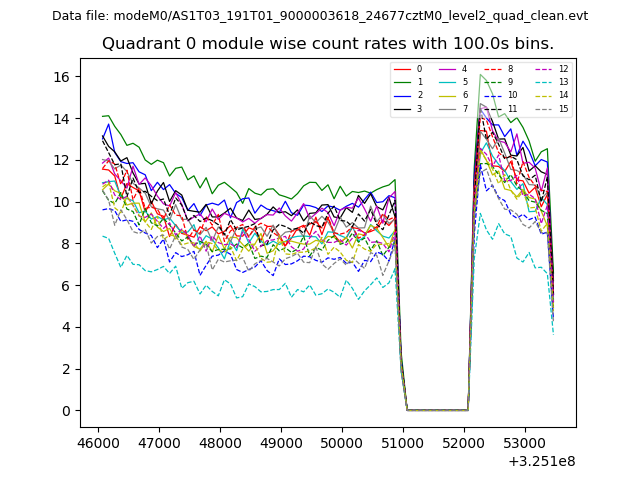 |
 |
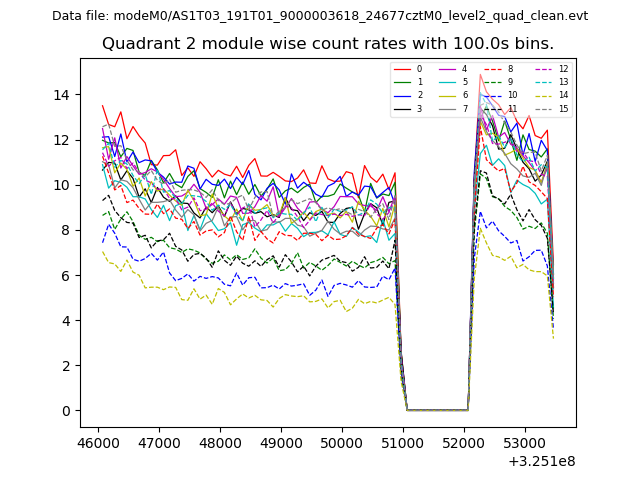
| Module-wise count rates for Quadrant B Data is divided into 100 sec bins |
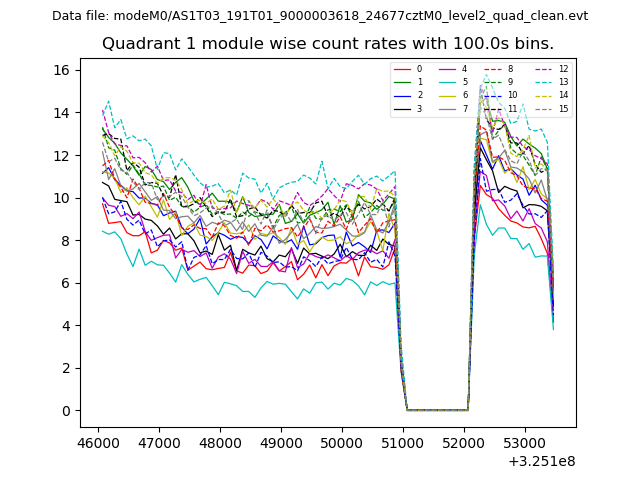 |
 |
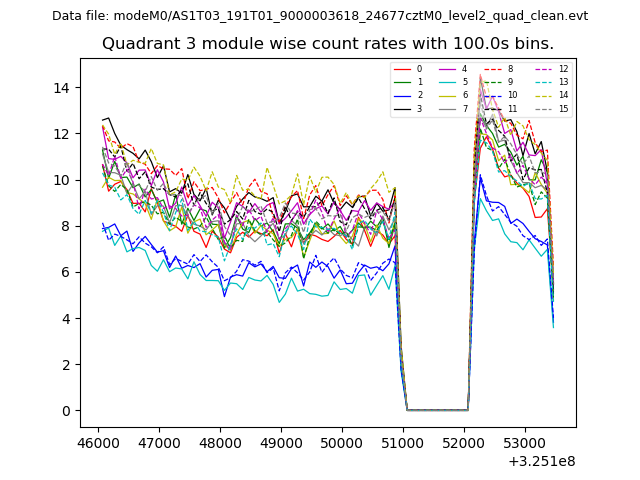
| Module-wise count rates for Quadrant C Data is divided into 100 sec bins |
 |
 |
| Module-wise count rates for Quadrant D Data is divided into 100 sec bins |
 |
 |
| Parameter | Plot |
|---|---|
| CZT HV Monitor | 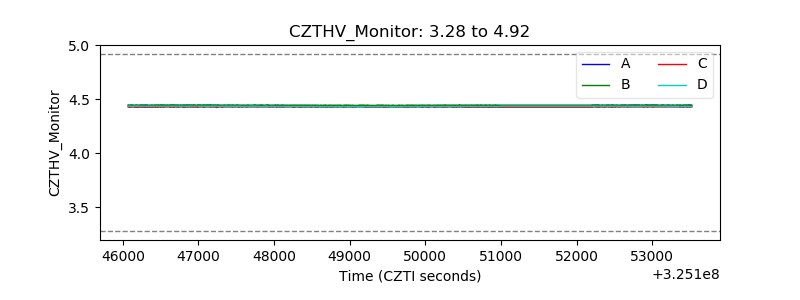 |
| D_VDD | 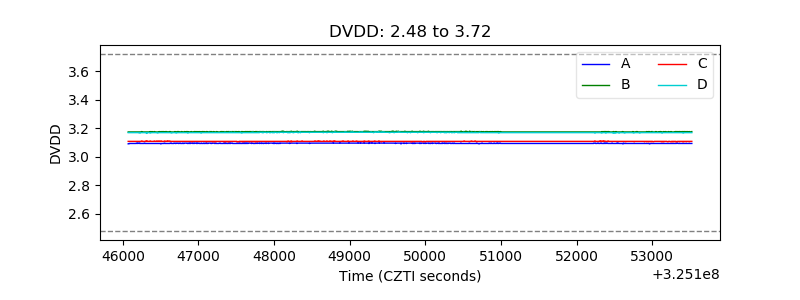 |
| Temperature 1 | 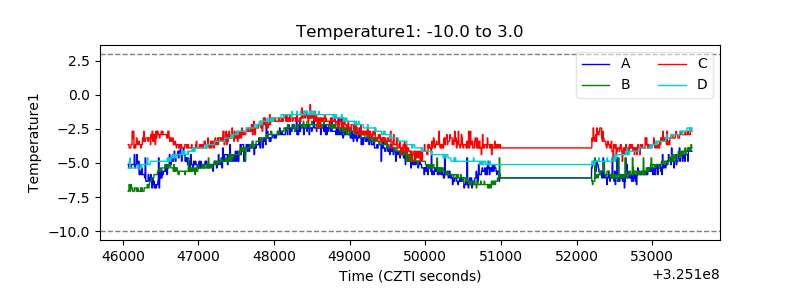 |
| Veto HV Monitor | 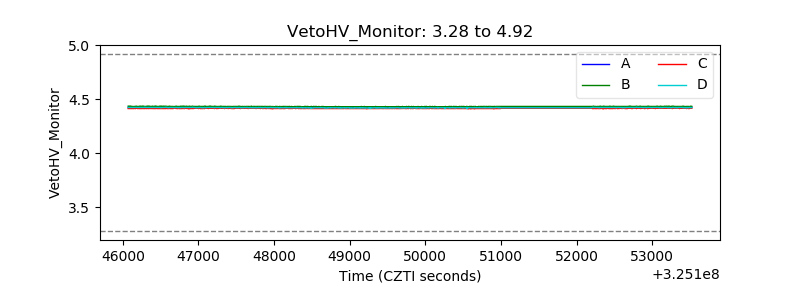 |
| Veto LLD |  |
| Alpha Counter | 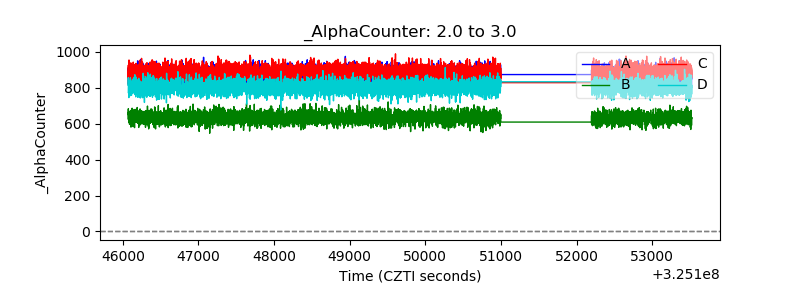 |
| _CPM_Rate |  |
| CZT Counter | 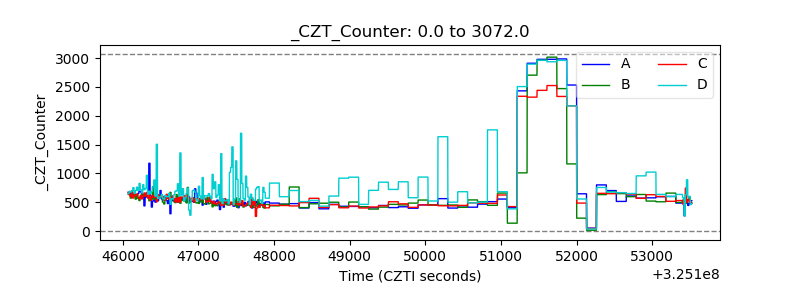 |
| +2.5 Volts monitor |  |
| +5 Volts monitor | 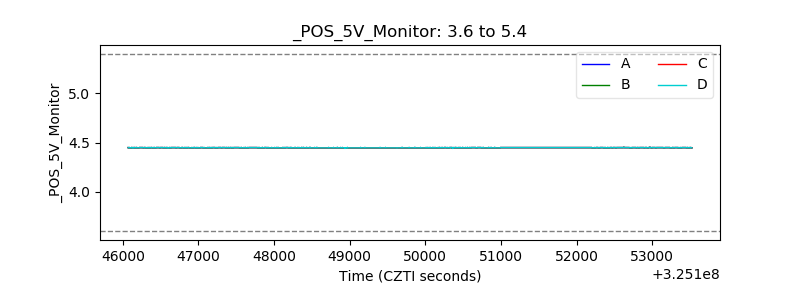 |
| _ROLL_ROT | 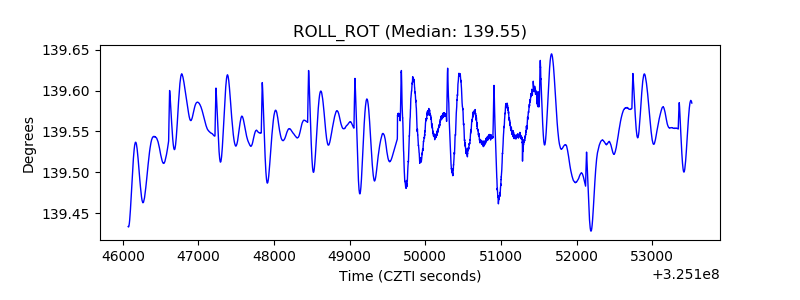 |
| _Roll_DEC | 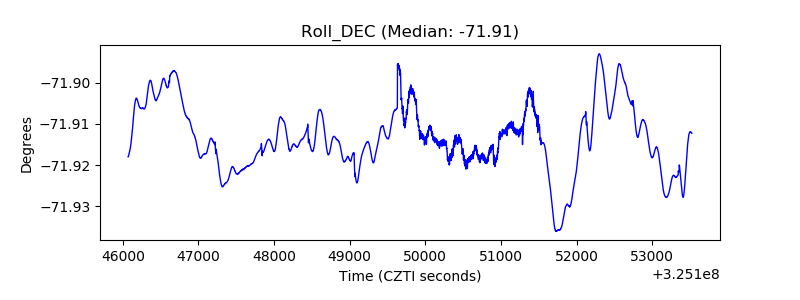 |
| _Roll_RA | 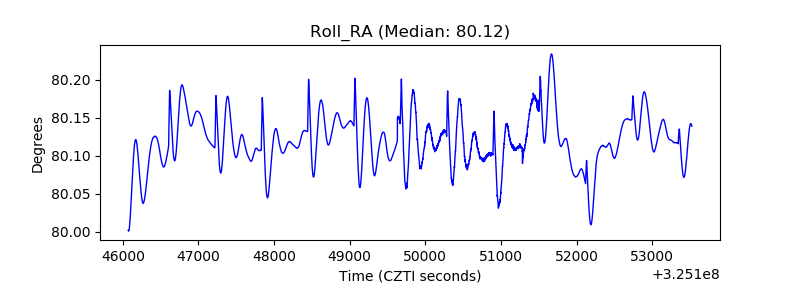 |
| Veto Counter | 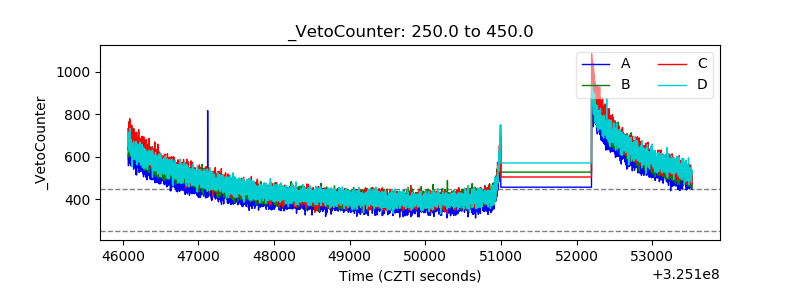 |