| Param | Original file | Final file |
|---|---|---|
| Filename | modeM0/AS1T03_191T01_9000003618_24682cztM0_level2.evt | modeM0/AS1T03_191T01_9000003618_24682cztM0_level2_quad_clean.evt |
| Size (bytes) | 432,659,520 | 120,447,360 |
| Size | 412.6 MB | 114.9 MB |
| Events in quadrant A | 2,895,247 | 830,418 |
| Events in quadrant B | 2,994,697 | 830,307 |
| Events in quadrant C | 2,850,780 | 785,376 |
| Events in quadrant D | 3,948,549 | 776,867 |
| Mode M9 | |||
|---|---|---|---|
| Quadrant | BADHDUFLAG | Total packets | Discarded packets |
| A | 0 | 9 | 0 |
| B | 0 | 9 | 0 |
| C | 0 | 9 | 0 |
| D | 0 | 9 | 0 |
| Mode M0 | |||
|---|---|---|---|
| Quadrant | BADHDUFLAG | Total packets | Discarded packets |
| A | 0 | 12535 | 2 |
| B | 0 | 12794 | 1 |
| C | 0 | 12584 | 1 |
| D | 0 | 15759 | 1 |
| Mode SS | |||
|---|---|---|---|
| Quadrant | BADHDUFLAG | Total packets | Discarded packets |
| A | 0 | 122 | 0 |
| B | 0 | 122 | 0 |
| C | 0 | 122 | 0 |
| D | 0 | 122 | 0 |
| Quadrant | Total seconds | Saturated seconds | Saturation percentage |
|---|---|---|---|
| A | 6093 | 55 | 0.902675% |
| B | 6094 | 89 | 1.460453% |
| C | 6094 | 68 | 1.115852% |
| D | 6094 | 159 | 2.609124% |
Noise dominated data is calculated using 1-second bins in cleaned event files. If a bin has >2000 counts, and if more than 50% of those come from <1% of pixels, then it is considered to be noise-dominated and hence unusable.
| Quadrant | # 1 sec bins | Bins with >0 counts | Bins with >2000 counts | High rate bins dominated by noise | Noise dominated (total time) | Noise dominated (detector-on time) | Marked lightcurve |
|---|---|---|---|---|---|---|---|
| A | 6938 | 6094 | 3 | 3 | 0.04% | 0.05% | 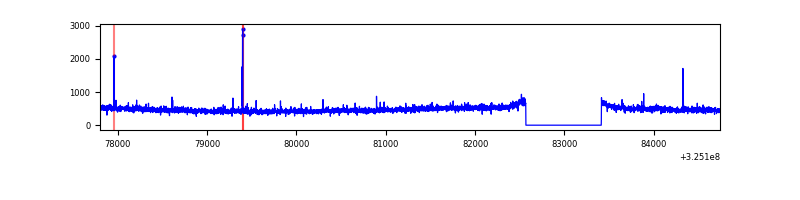 |
| B | 6939 | 6094 | 17 | 17 | 0.24% | 0.28% | 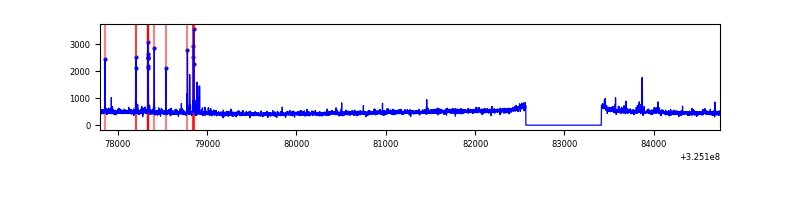 |
| C | 6939 | 6094 | 0 | 0 | 0.00% | 0.00% | 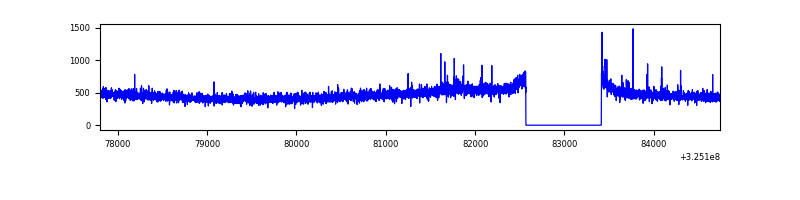 |
| D | 6939 | 6095 | 147 | 147 | 2.12% | 2.41% | 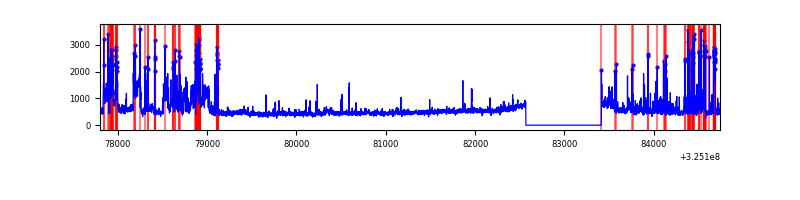 |
Top three noisy pixels from each quadrant. If the there are fewer than three noisy pixels in the level2.evt file, extra rows are filled as -1
| Pixel properties | Quadrant properties | ||||||
|---|---|---|---|---|---|---|---|
| Quadrant | DetID | PixID | Counts | Sigma | Mean | Median | Sigma |
| A | 4 | 2 | 16361 | 105.19 | 739 | 725 | 148.6 |
| A | 12 | 96 | 15386 | 98.63 | 739 | 725 | 148.6 |
| A | 13 | 254 | 9840 | 61.32 | 739 | 725 | 148.6 |
| B | 4 | 80 | 98358 | 711.82 | 729 | 711 | 137.2 |
| B | 7 | 202 | 20839 | 146.73 | 729 | 711 | 137.2 |
| B | 12 | 111 | 16402 | 114.38 | 729 | 711 | 137.2 |
| C | 14 | 238 | 112178 | 692.81 | 693 | 697 | 160.9 |
| C | 6 | 96 | 29394 | 178.34 | 693 | 697 | 160.9 |
| C | 13 | 61 | 4781 | 25.38 | 693 | 697 | 160.9 |
| D | 1 | 52 | 1101591 | 6438.5 | 706 | 684 | 171.0 |
| D | 8 | 195 | 94172 | 546.75 | 706 | 684 | 171.0 |
| D | 7 | 238 | 67495 | 390.73 | 706 | 684 | 171.0 |
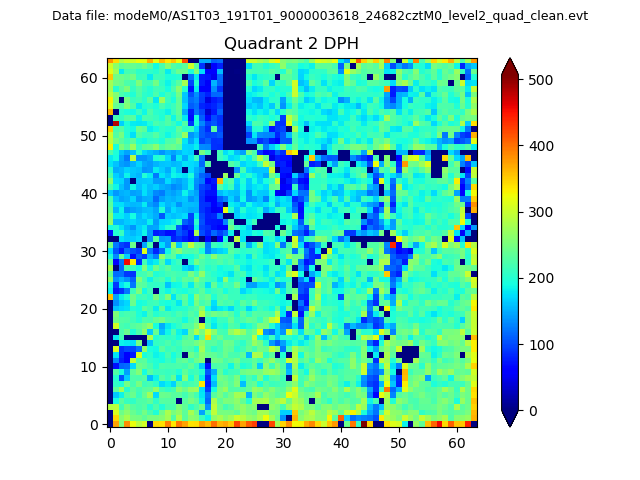
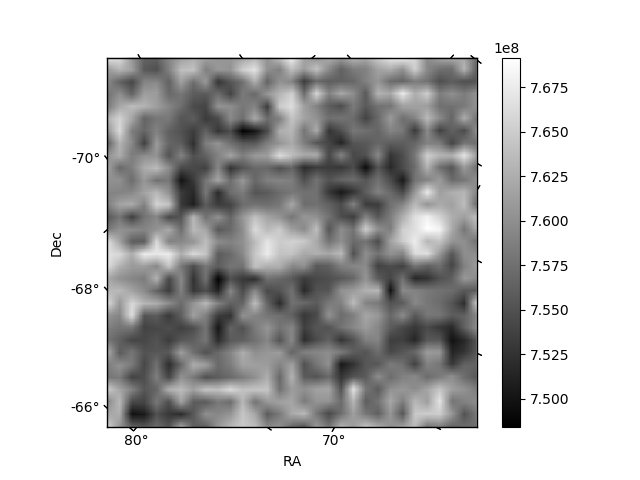
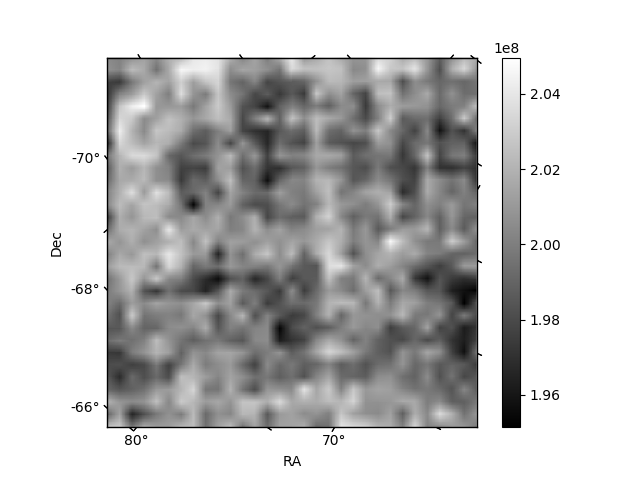
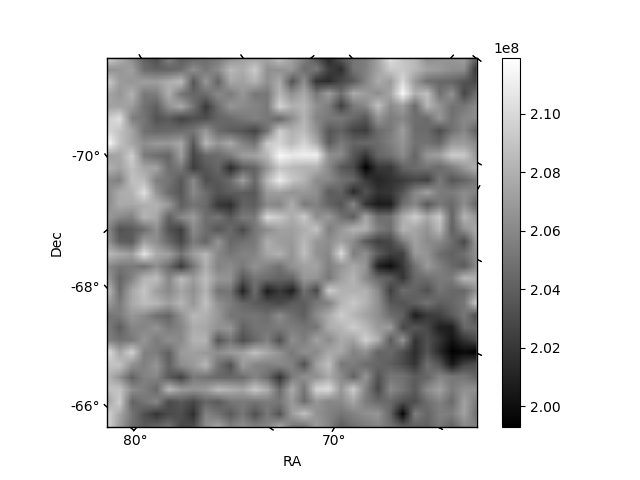
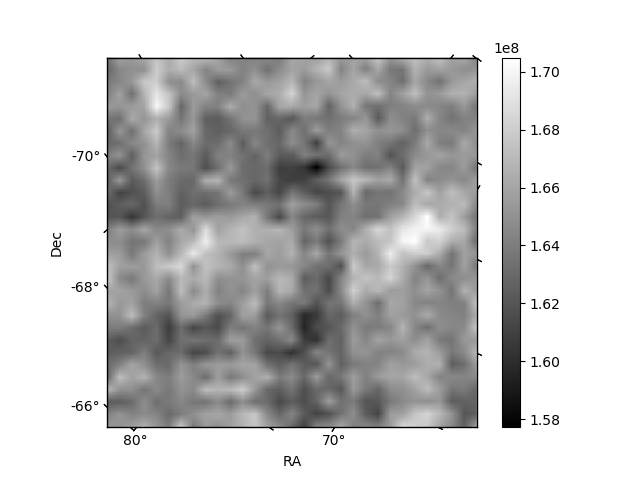
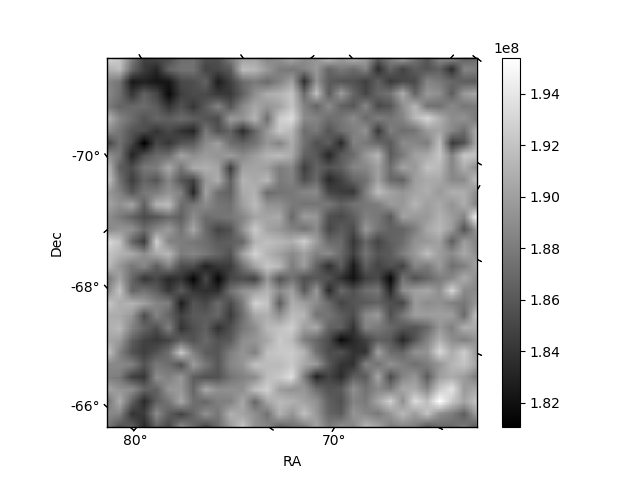
Histogram calculated using DETX and DETY for each event in the final _common_clean file
| Quadrant A | 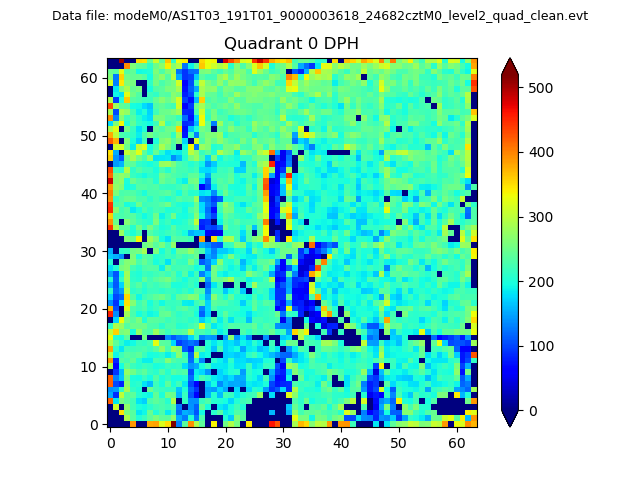 |
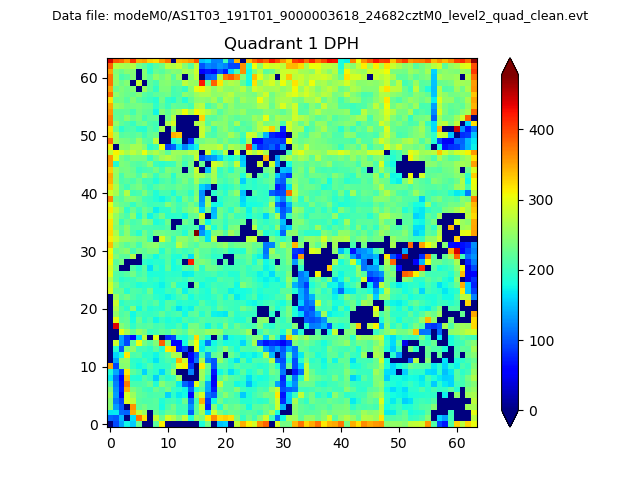 |
Quadrant B |
|---|---|---|---|
| Quadrant D | 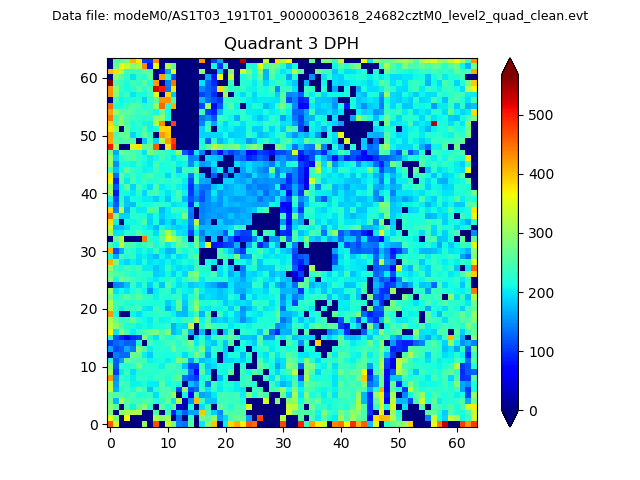 |
 |
Quadrant C |
| Plot type | Count rate plots | Images |
|---|---|---|
| Comparison with Poisson distribution Blue bars denote a histogram of data divided into 1 sec bins. Red curve is a Poisson curve with rate = median count rate of data. |
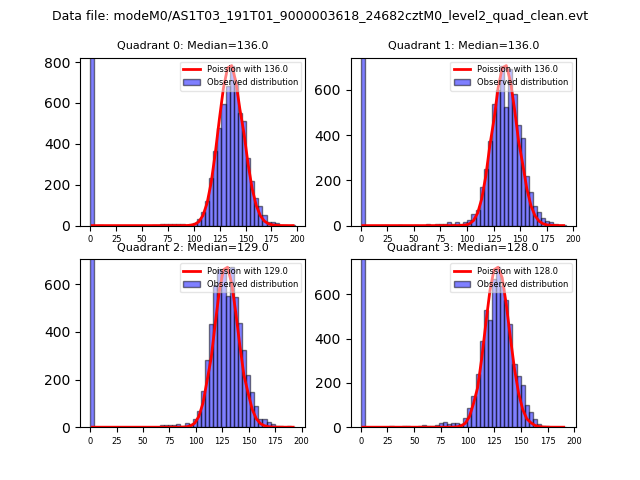 |
 |
| Quadrant-wise count rates Data is divided into 100 sec bins |
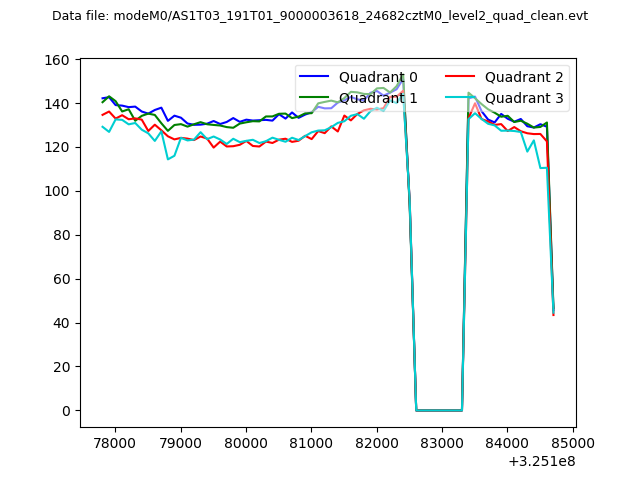 |
|
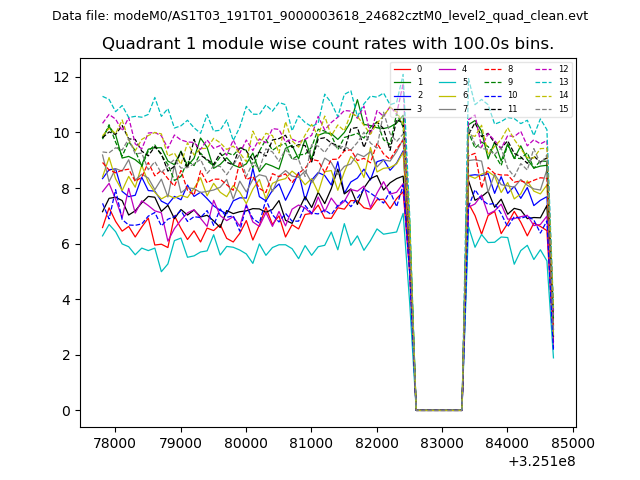
| Module-wise count rates for Quadrant A Data is divided into 100 sec bins |
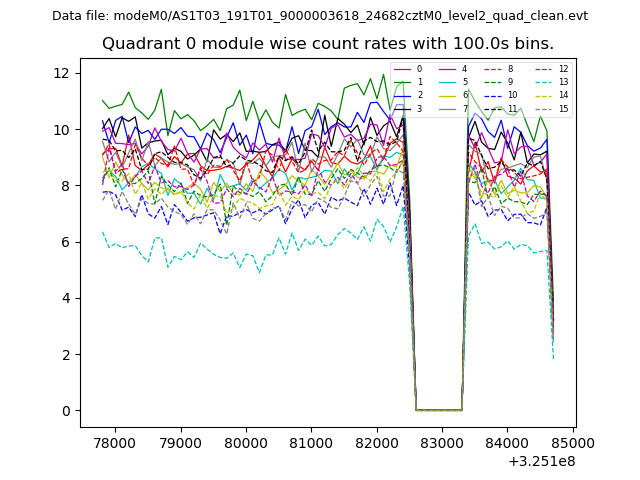 |
 |
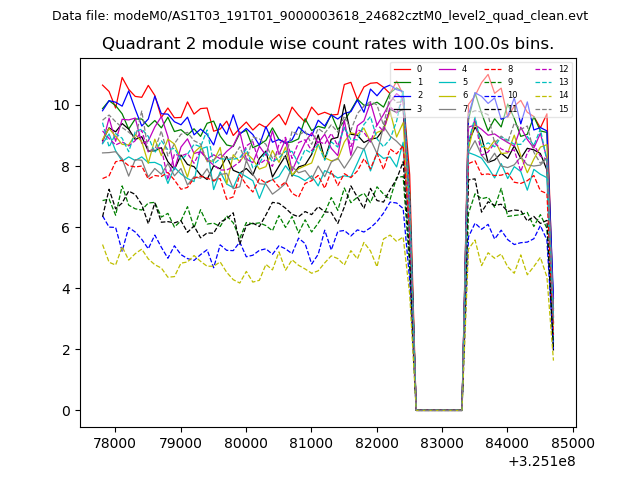
| Module-wise count rates for Quadrant B Data is divided into 100 sec bins |
 |
 |
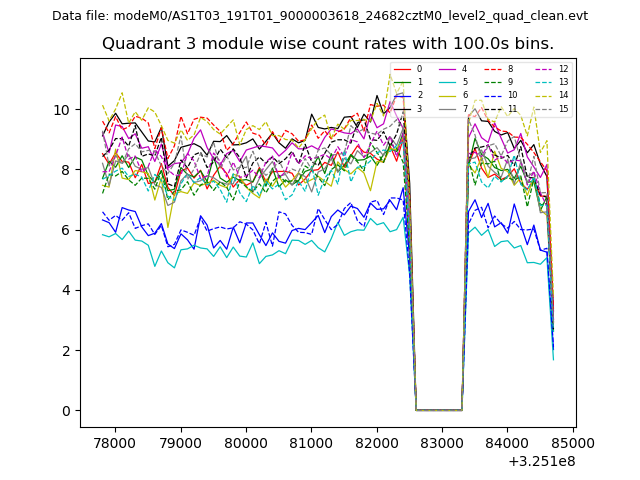
| Module-wise count rates for Quadrant C Data is divided into 100 sec bins |
 |
 |
| Module-wise count rates for Quadrant D Data is divided into 100 sec bins |
 |
 |
| Parameter | Plot |
|---|---|
| CZT HV Monitor | 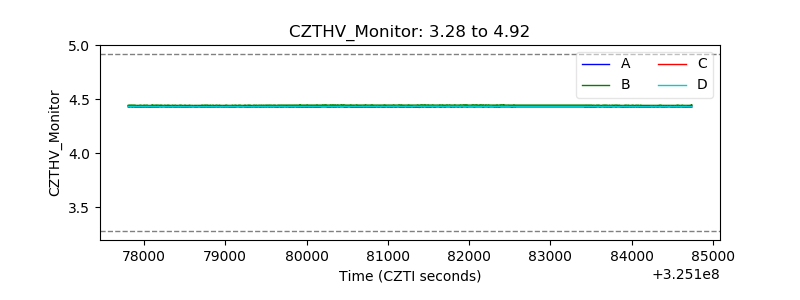 |
| D_VDD | 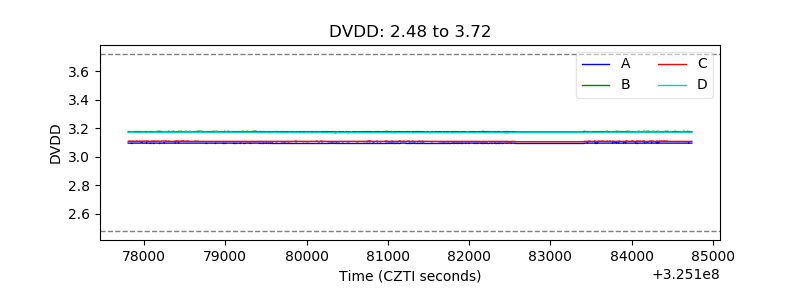 |
| Temperature 1 |  |
| Veto HV Monitor | 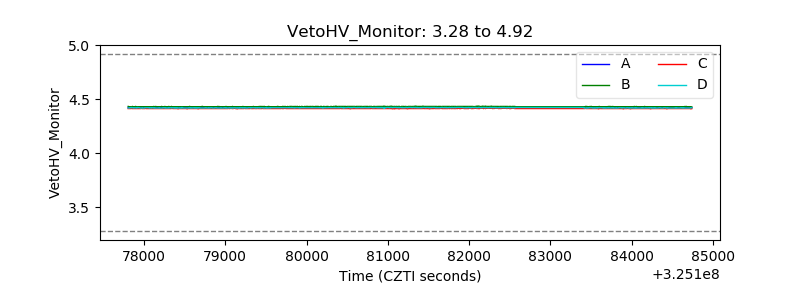 |
| Veto LLD |  |
| Alpha Counter | 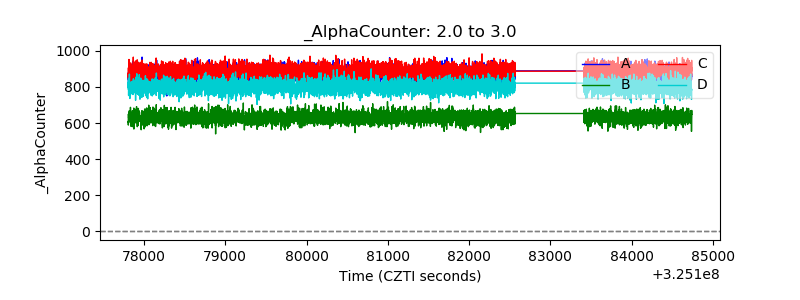 |
| _CPM_Rate | 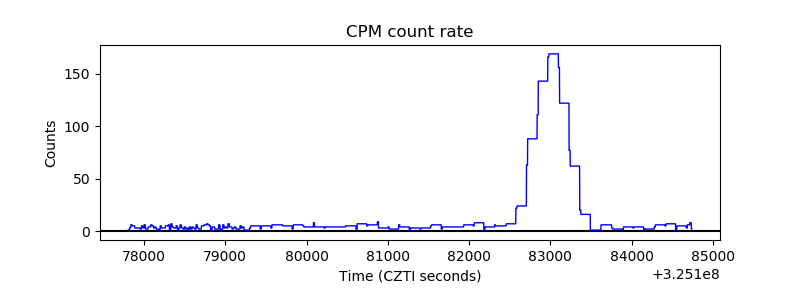 |
| CZT Counter | 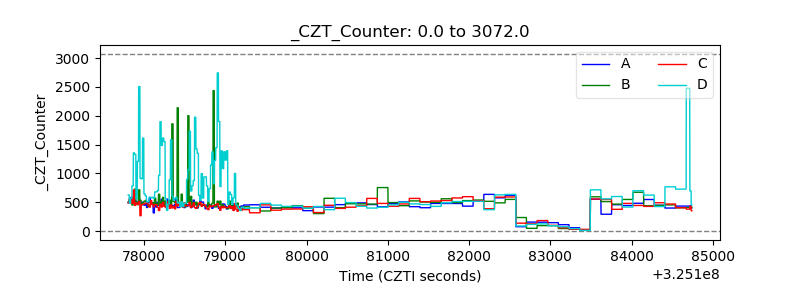 |
| +2.5 Volts monitor |  |
| +5 Volts monitor |  |
| _ROLL_ROT | 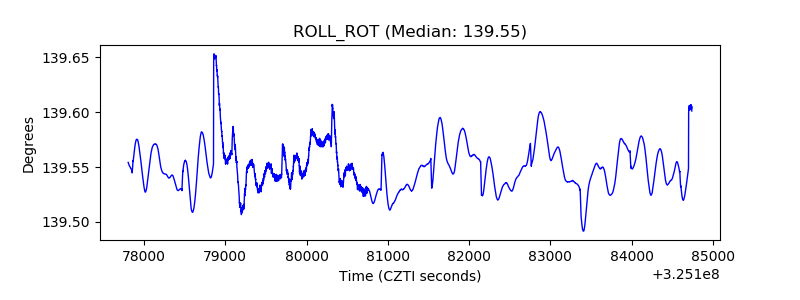 |
| _Roll_DEC |  |
| _Roll_RA | 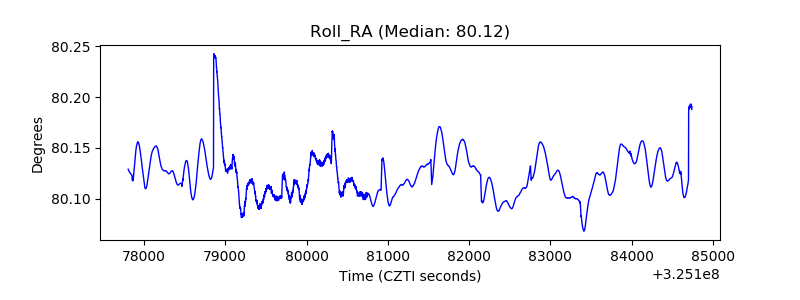 |
| Veto Counter | 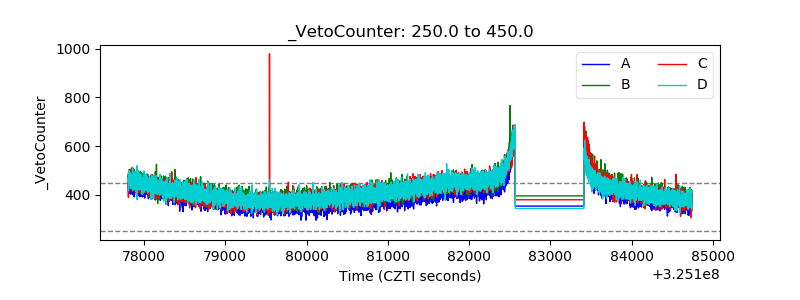 |