| Param | Original file | Final file |
|---|---|---|
| Filename | modeM0/AS1T03_191T01_9000003618_24684cztM0_level2.evt | modeM0/AS1T03_191T01_9000003618_24684cztM0_level2_quad_clean.evt |
| Size (bytes) | 698,662,080 | 142,263,360 |
| Size | 666.3 MB | 135.7 MB |
| Events in quadrant A | 3,567,488 | 984,856 |
| Events in quadrant B | 3,796,047 | 987,814 |
| Events in quadrant C | 3,629,894 | 939,144 |
| Events in quadrant D | 9,649,465 | 865,779 |
| Mode M9 | |||
|---|---|---|---|
| Quadrant | BADHDUFLAG | Total packets | Discarded packets |
| A | 0 | 3 | 0 |
| B | 0 | 4 | 0 |
| C | 0 | 4 | 0 |
| D | 0 | 4 | 0 |
| Mode M0 | |||
|---|---|---|---|
| Quadrant | BADHDUFLAG | Total packets | Discarded packets |
| A | 0 | 15756 | 2 |
| B | 0 | 16314 | 2 |
| C | 0 | 15779 | 2 |
| D | 0 | 33844 | 4 |
| Mode SS | |||
|---|---|---|---|
| Quadrant | BADHDUFLAG | Total packets | Discarded packets |
| A | 0 | 156 | 0 |
| B | 0 | 156 | 0 |
| C | 0 | 156 | 0 |
| D | 0 | 154 | 0 |
| Quadrant | Total seconds | Saturated seconds | Saturation percentage |
|---|---|---|---|
| A | 7628 | 70 | 0.917672% |
| B | 7628 | 129 | 1.691138% |
| C | 7628 | 101 | 1.324069% |
| D | 7627 | 1423 | 18.657401% |
Noise dominated data is calculated using 1-second bins in cleaned event files. If a bin has >2000 counts, and if more than 50% of those come from <1% of pixels, then it is considered to be noise-dominated and hence unusable.
| Quadrant | # 1 sec bins | Bins with >0 counts | Bins with >2000 counts | High rate bins dominated by noise | Noise dominated (total time) | Noise dominated (detector-on time) | Marked lightcurve |
|---|---|---|---|---|---|---|---|
| A | 7853 | 7629 | 4 | 4 | 0.05% | 0.05% | 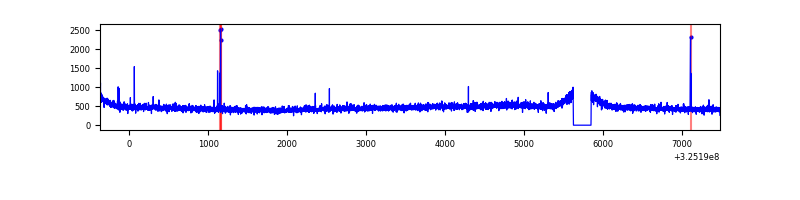 |
| B | 7853 | 7629 | 36 | 36 | 0.46% | 0.47% | 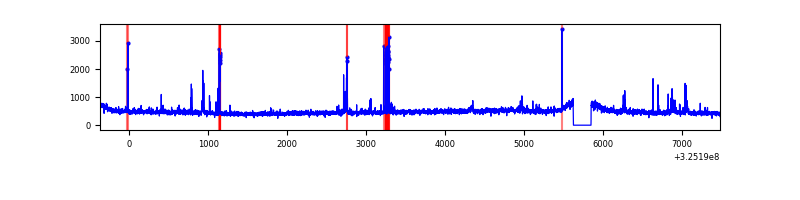 |
| C | 7853 | 7629 | 4 | 4 | 0.05% | 0.05% | 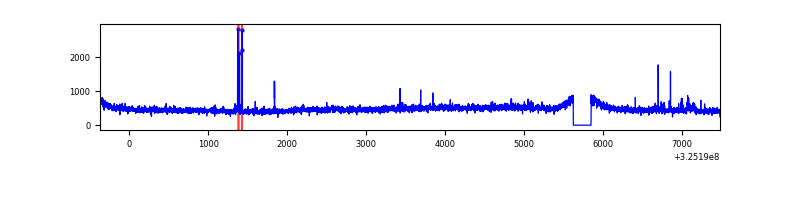 |
| D | 7852 | 7627 | 1538 | 1538 | 19.59% | 20.17% | 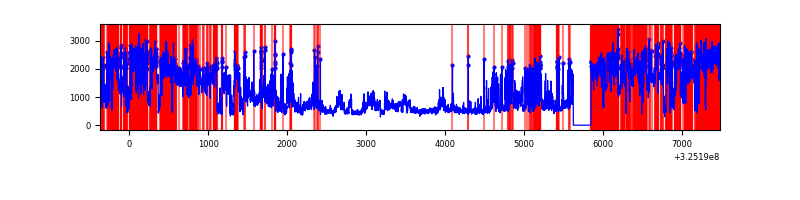 |
Top three noisy pixels from each quadrant. If the there are fewer than three noisy pixels in the level2.evt file, extra rows are filled as -1
| Pixel properties | Quadrant properties | ||||||
|---|---|---|---|---|---|---|---|
| Quadrant | DetID | PixID | Counts | Sigma | Mean | Median | Sigma |
| A | 4 | 2 | 30858 | 161.93 | 914 | 894 | 185.0 |
| A | 13 | 254 | 12584 | 63.17 | 914 | 894 | 185.0 |
| A | 3 | 137 | 8378 | 40.44 | 914 | 894 | 185.0 |
| B | 4 | 80 | 149011 | 857.58 | 902 | 875 | 172.7 |
| B | 3 | 64 | 39810 | 225.4 | 902 | 875 | 172.7 |
| B | 0 | 190 | 28852 | 161.96 | 902 | 875 | 172.7 |
| C | 14 | 238 | 137618 | 682.21 | 863 | 868 | 200.5 |
| C | 10 | 91 | 41118 | 200.8 | 863 | 868 | 200.5 |
| C | 2 | 16 | 30658 | 148.62 | 863 | 868 | 200.5 |
| D | 1 | 52 | 5860492 | 28796.41 | 843 | 817 | 203.5 |
| D | 7 | 238 | 413194 | 2026.56 | 843 | 817 | 203.5 |
| D | 8 | 195 | 161288 | 788.61 | 843 | 817 | 203.5 |
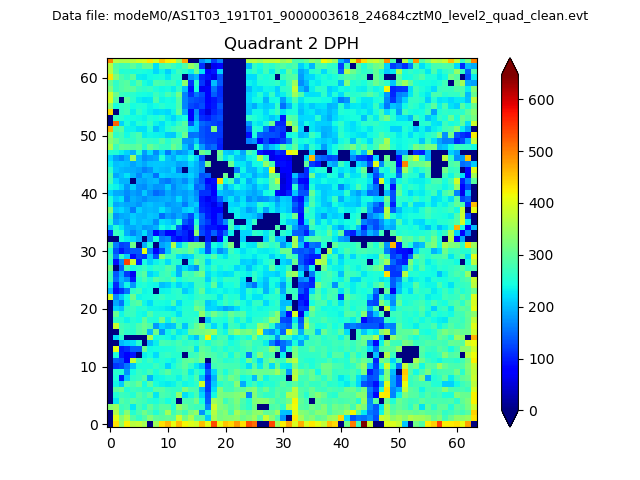
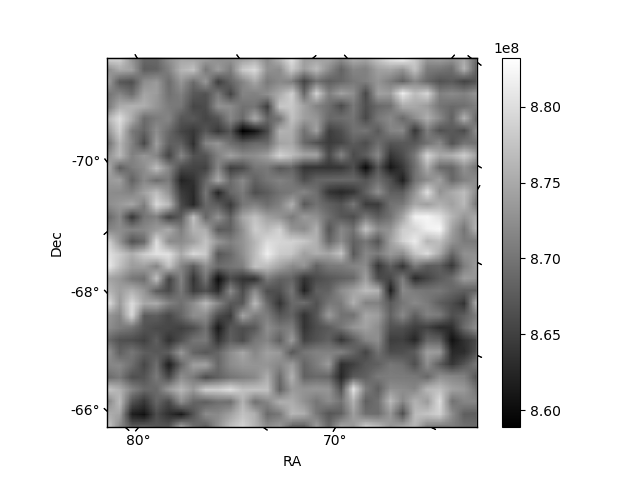
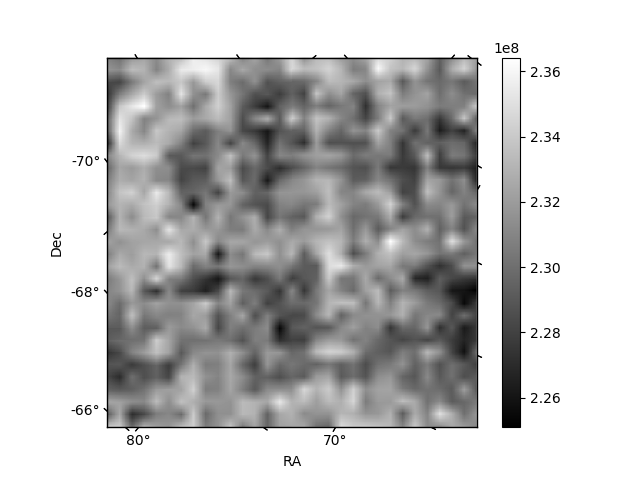
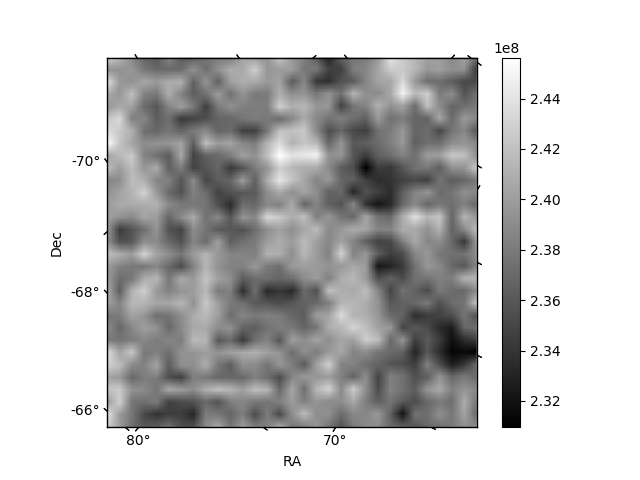
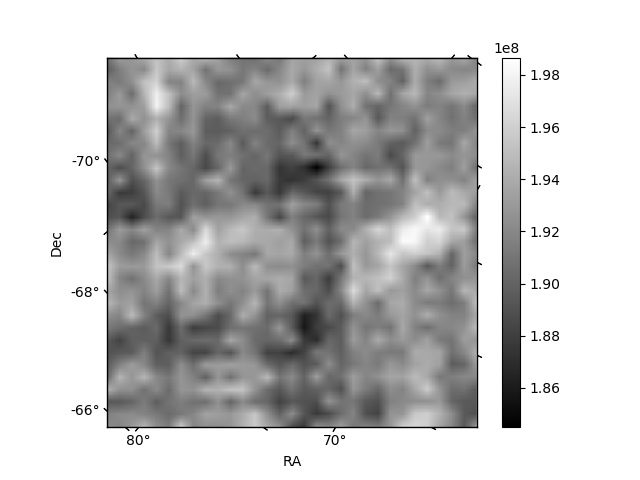
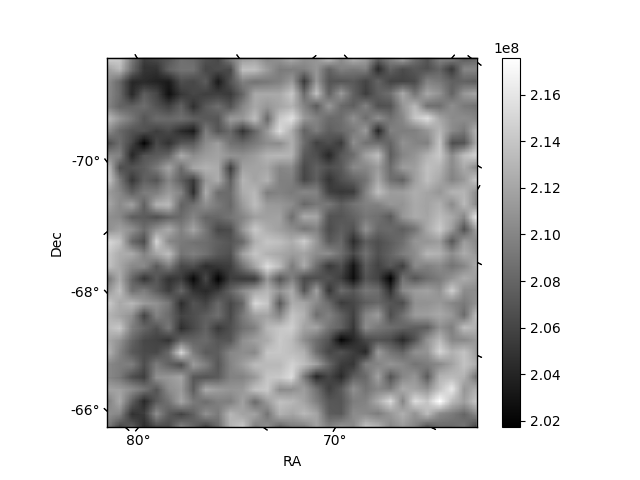
Histogram calculated using DETX and DETY for each event in the final _common_clean file
| Quadrant A | 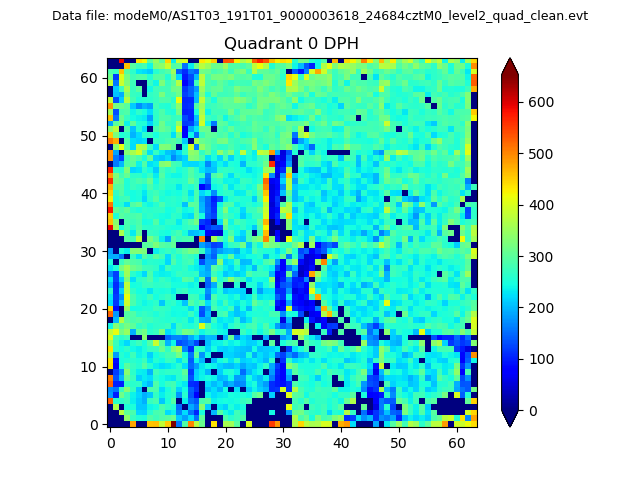 |
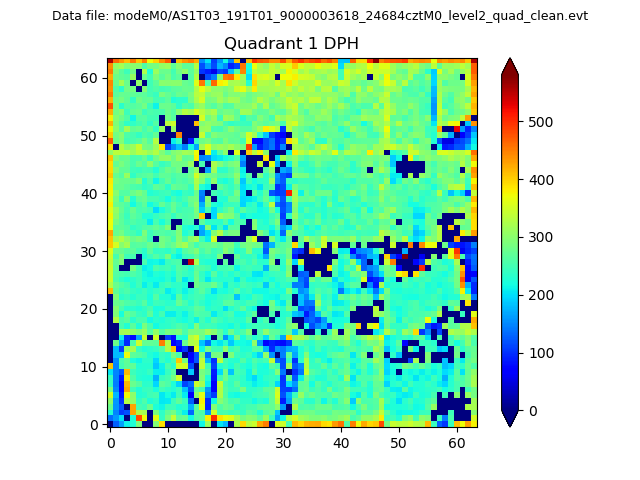 |
Quadrant B |
|---|---|---|---|
| Quadrant D | 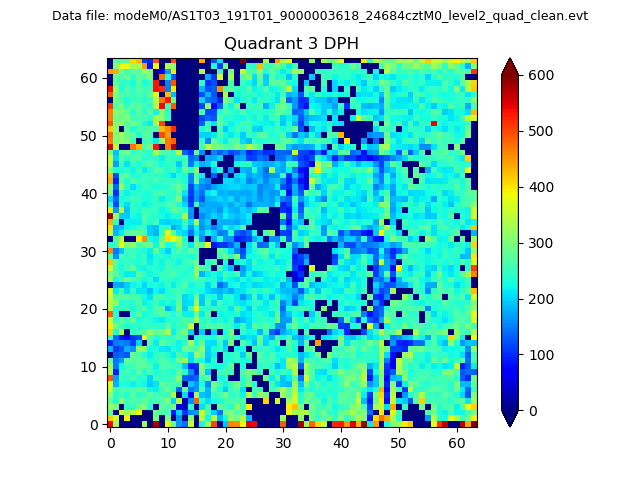 |
 |
Quadrant C |
| Plot type | Count rate plots | Images |
|---|---|---|
| Comparison with Poisson distribution Blue bars denote a histogram of data divided into 1 sec bins. Red curve is a Poisson curve with rate = median count rate of data. |
 |
 |
| Quadrant-wise count rates Data is divided into 100 sec bins |
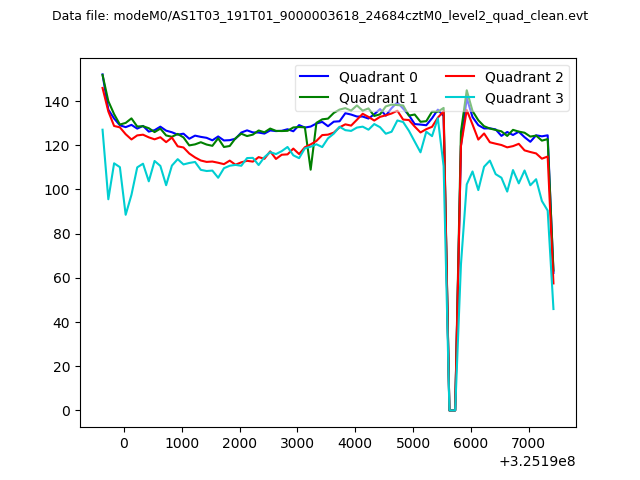 |
|
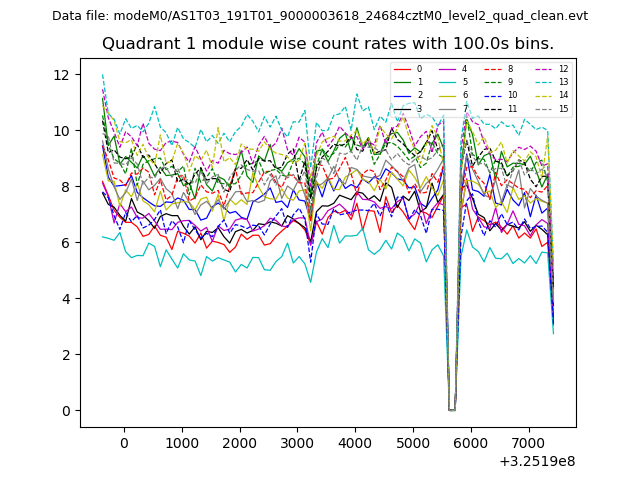
| Module-wise count rates for Quadrant A Data is divided into 100 sec bins |
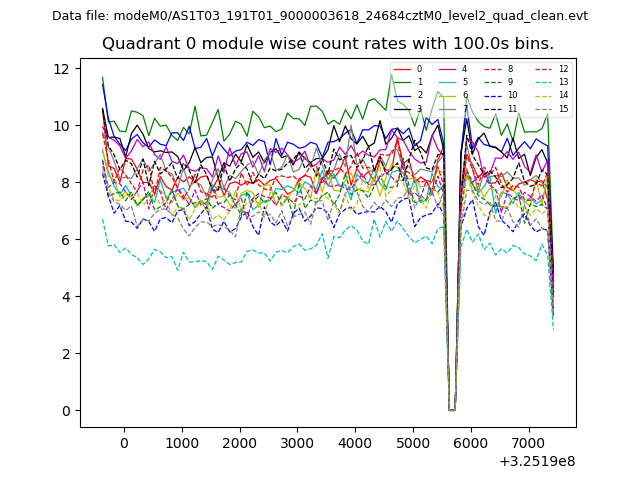 |
 |
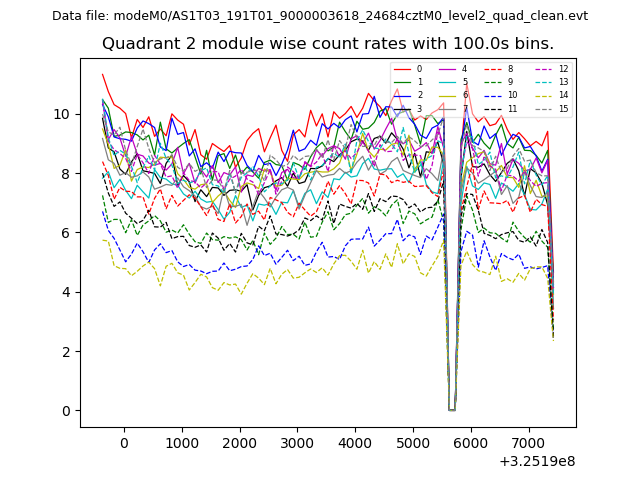
| Module-wise count rates for Quadrant B Data is divided into 100 sec bins |
 |
 |
| Module-wise count rates for Quadrant C Data is divided into 100 sec bins |
 |
 |
| Module-wise count rates for Quadrant D Data is divided into 100 sec bins |
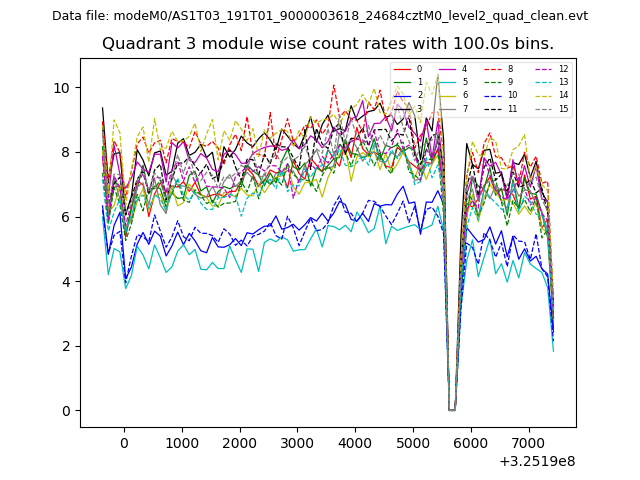 |
 |
| Parameter | Plot |
|---|---|
| CZT HV Monitor | 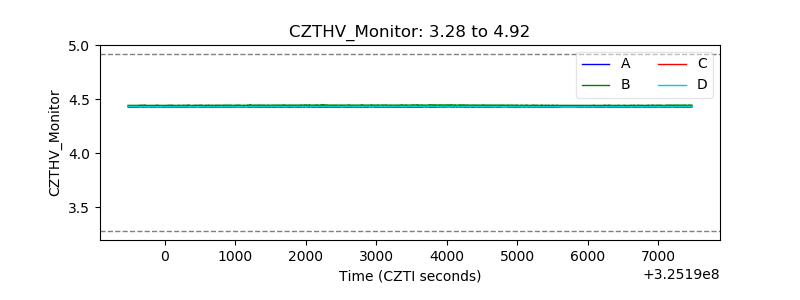 |
| D_VDD | 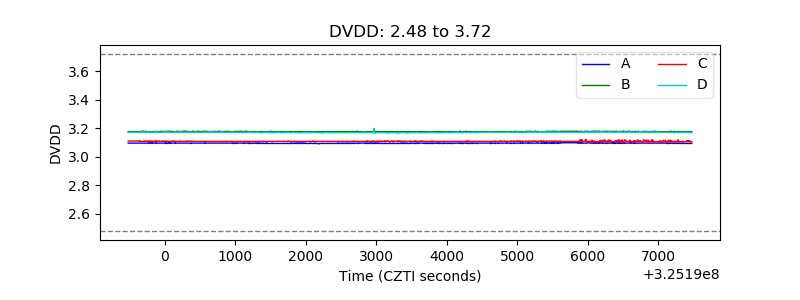 |
| Temperature 1 | 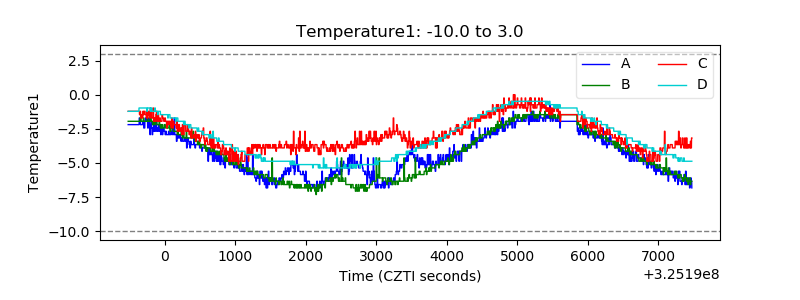 |
| Veto HV Monitor | 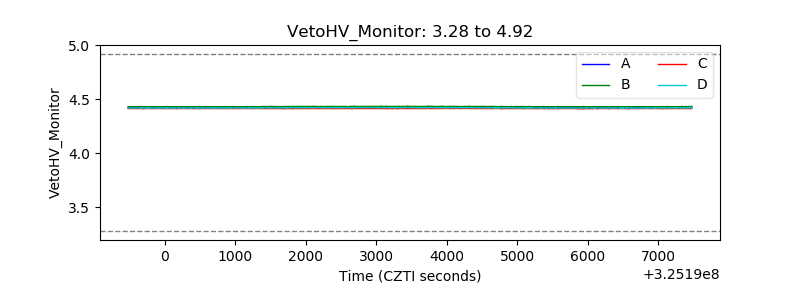 |
| Veto LLD | 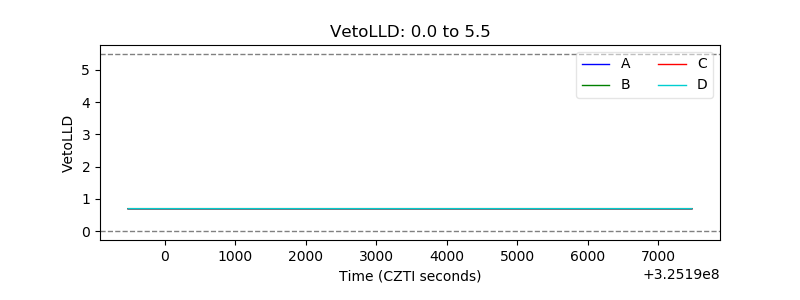 |
| Alpha Counter | 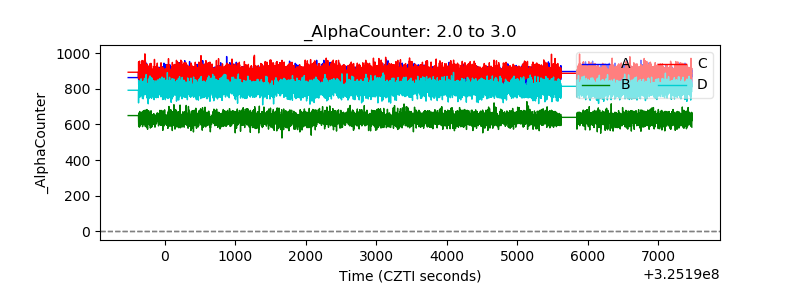 |
| _CPM_Rate | 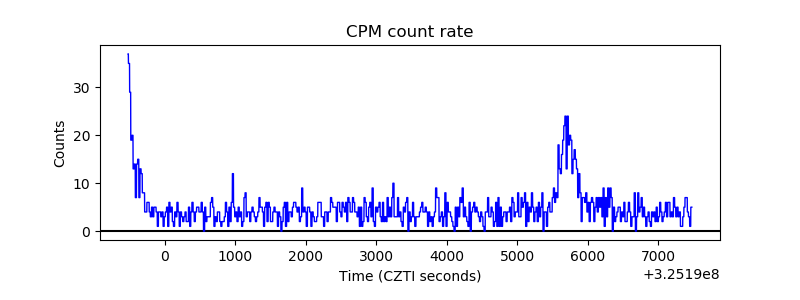 |
| CZT Counter | 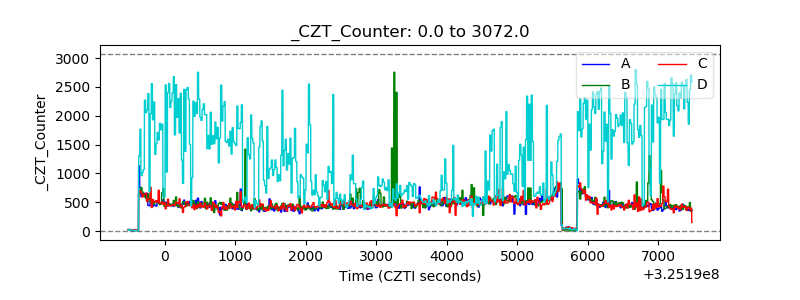 |
| +2.5 Volts monitor |  |
| +5 Volts monitor | 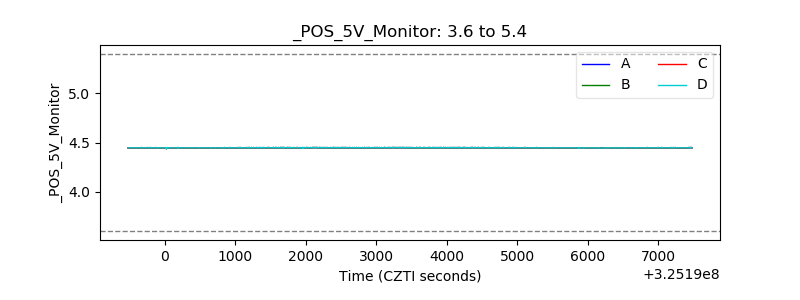 |
| _ROLL_ROT | 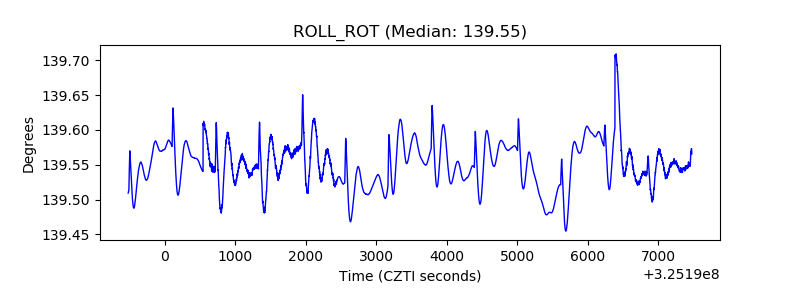 |
| _Roll_DEC | 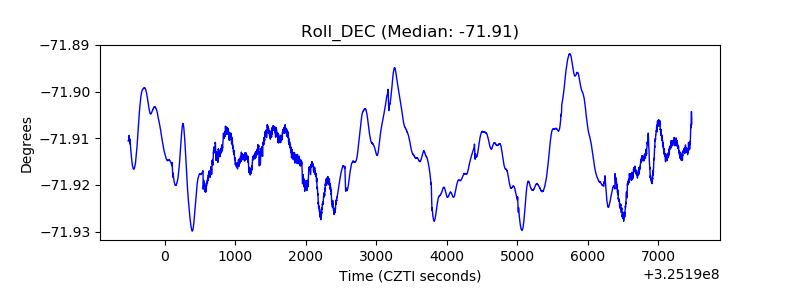 |
| _Roll_RA | 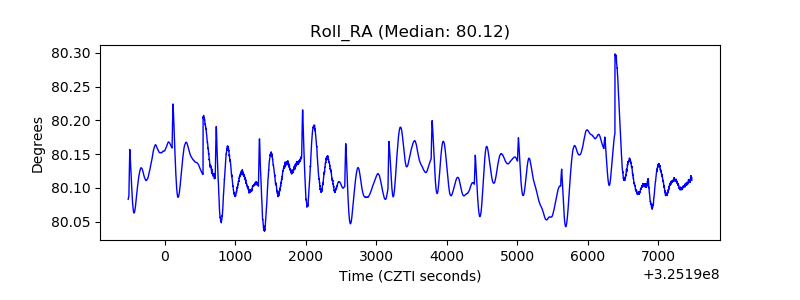 |
| Veto Counter | 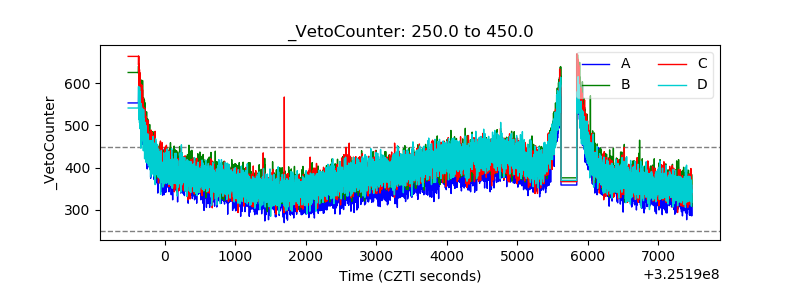 |