| Param | Original file | Final file |
|---|---|---|
| Filename | modeM0/AS1T03_191T01_9000003618_24687cztM0_level2.evt | modeM0/AS1T03_191T01_9000003618_24687cztM0_level2_quad_clean.evt |
| Size (bytes) | 998,461,440 | 240,903,360 |
| Size | 952.2 MB | 229.7 MB |
| Events in quadrant A | 5,968,295 | 1,650,945 |
| Events in quadrant B | 6,086,240 | 1,663,723 |
| Events in quadrant C | 6,469,799 | 1,565,450 |
| Events in quadrant D | 10,835,628 | 1,518,522 |
| Mode M9 | |||
|---|---|---|---|
| Quadrant | BADHDUFLAG | Total packets | Discarded packets |
| A | 0 | 16 | 0 |
| B | 0 | 16 | 0 |
| C | 0 | 16 | 0 |
| D | 0 | 16 | 0 |
| Mode M0 | |||
|---|---|---|---|
| Quadrant | BADHDUFLAG | Total packets | Discarded packets |
| A | 0 | 26415 | 3 |
| B | 0 | 26617 | 3 |
| C | 0 | 27584 | 3 |
| D | 0 | 41134 | 3 |
| Mode SS | |||
|---|---|---|---|
| Quadrant | BADHDUFLAG | Total packets | Discarded packets |
| A | 0 | 264 | 0 |
| B | 0 | 264 | 0 |
| C | 0 | 264 | 0 |
| D | 0 | 264 | 0 |
| Quadrant | Total seconds | Saturated seconds | Saturation percentage |
|---|---|---|---|
| A | 13007 | 85 | 0.653494% |
| B | 13007 | 118 | 0.907204% |
| C | 13007 | 203 | 1.560698% |
| D | 13008 | 536 | 4.120541% |
Noise dominated data is calculated using 1-second bins in cleaned event files. If a bin has >2000 counts, and if more than 50% of those come from <1% of pixels, then it is considered to be noise-dominated and hence unusable.
| Quadrant | # 1 sec bins | Bins with >0 counts | Bins with >2000 counts | High rate bins dominated by noise | Noise dominated (total time) | Noise dominated (detector-on time) | Marked lightcurve |
|---|---|---|---|---|---|---|---|
| A | 14532 | 13007 | 1 | 1 | 0.01% | 0.01% |  |
| B | 14532 | 13007 | 7 | 7 | 0.05% | 0.05% | 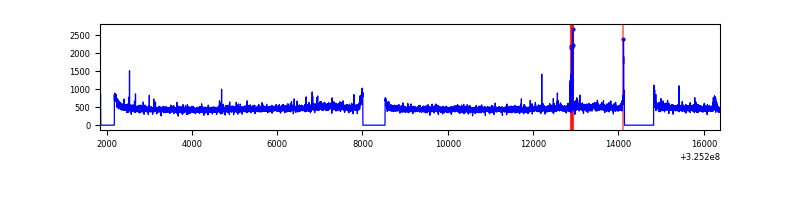 |
| C | 14532 | 13007 | 38 | 38 | 0.26% | 0.29% | 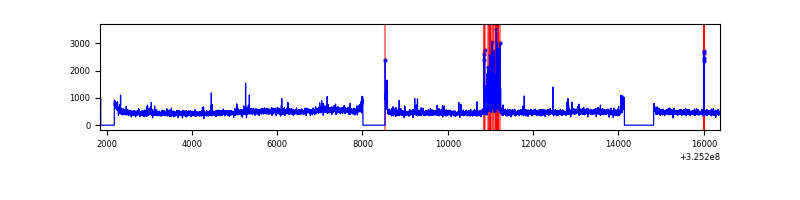 |
| D | 14533 | 13008 | 369 | 369 | 2.54% | 2.84% | 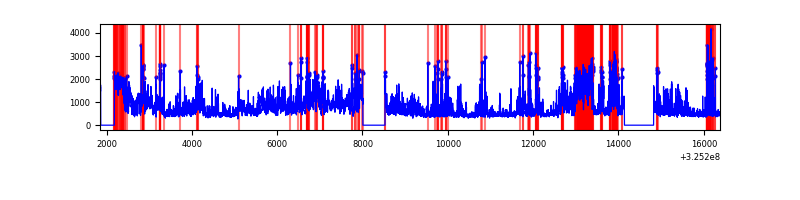 |
Top three noisy pixels from each quadrant. If the there are fewer than three noisy pixels in the level2.evt file, extra rows are filled as -1
| Pixel properties | Quadrant properties | ||||||
|---|---|---|---|---|---|---|---|
| Quadrant | DetID | PixID | Counts | Sigma | Mean | Median | Sigma |
| A | 13 | 254 | 19162 | 57.16 | 1542 | 1506 | 308.9 |
| A | 3 | 137 | 14507 | 42.09 | 1542 | 1506 | 308.9 |
| A | 0 | 226 | 13060 | 37.4 | 1542 | 1506 | 308.9 |
| B | 12 | 111 | 36060 | 119.24 | 1530 | 1491 | 289.9 |
| B | 4 | 80 | 34576 | 114.12 | 1530 | 1491 | 289.9 |
| B | 11 | 111 | 32267 | 106.16 | 1530 | 1491 | 289.9 |
| C | 6 | 96 | 281165 | 824.83 | 1464 | 1471 | 339.1 |
| C | 14 | 238 | 236437 | 692.92 | 1464 | 1471 | 339.1 |
| C | 2 | 16 | 101624 | 295.36 | 1464 | 1471 | 339.1 |
| D | 1 | 52 | 4209421 | 11814.91 | 1473 | 1428 | 356.2 |
| D | 7 | 238 | 740187 | 2074.24 | 1473 | 1428 | 356.2 |
| D | 8 | 195 | 185176 | 515.91 | 1473 | 1428 | 356.2 |
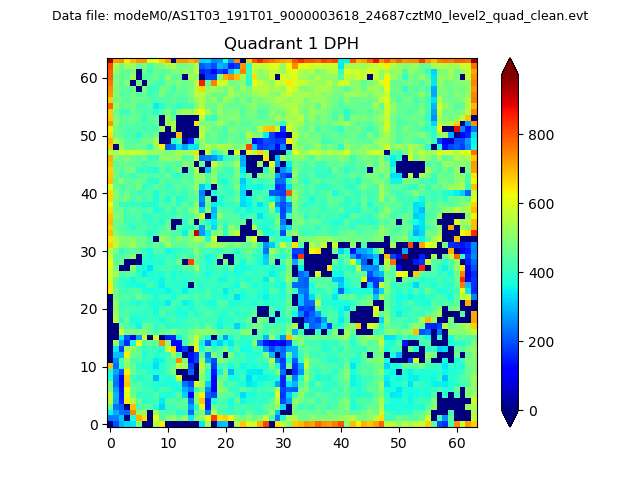
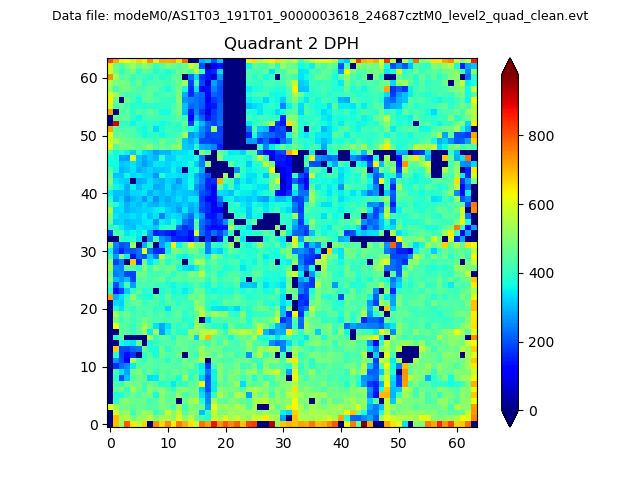
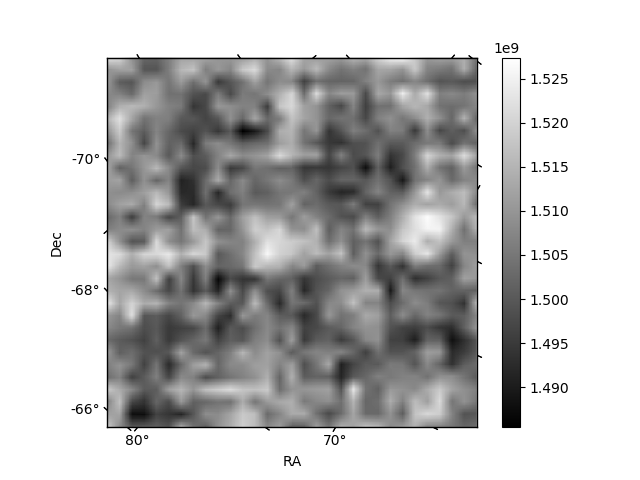
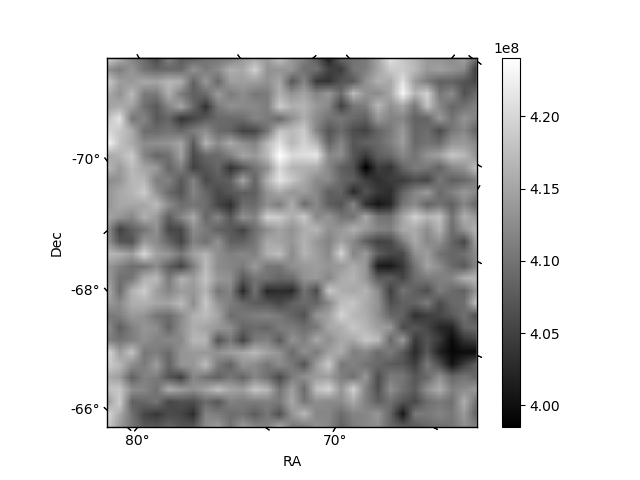
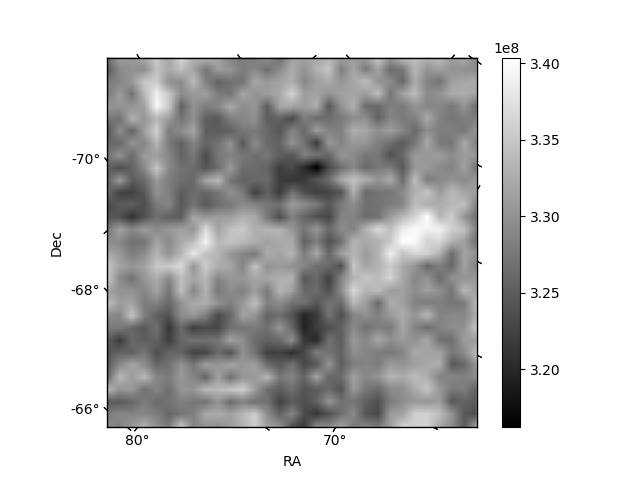
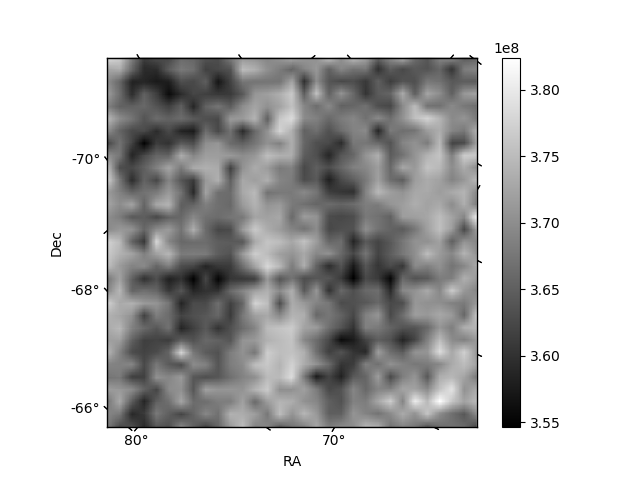
Histogram calculated using DETX and DETY for each event in the final _common_clean file
| Quadrant A | 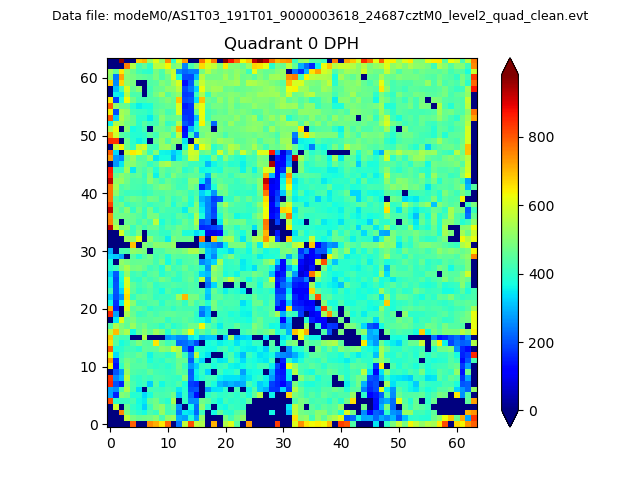 |
 |
Quadrant B |
|---|---|---|---|
| Quadrant D | 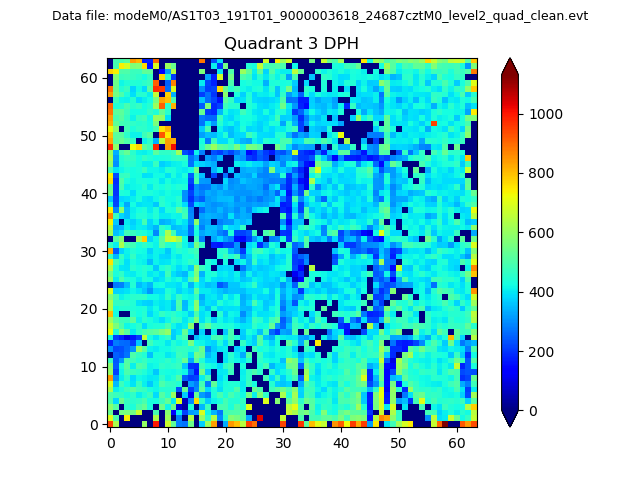 |
 |
Quadrant C |
| Plot type | Count rate plots | Images |
|---|---|---|
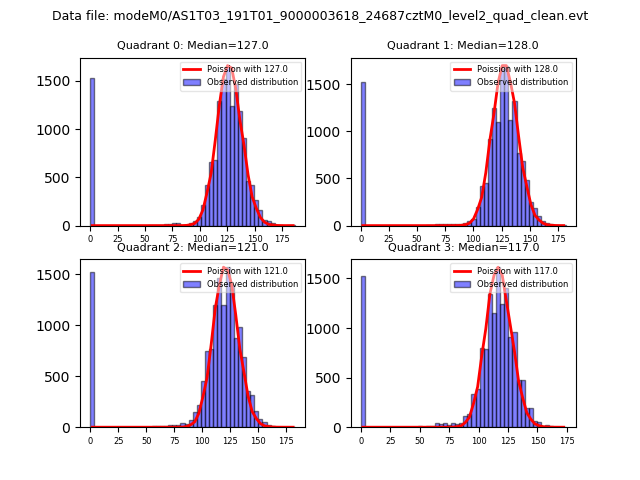
| Comparison with Poisson distribution Blue bars denote a histogram of data divided into 1 sec bins. Red curve is a Poisson curve with rate = median count rate of data. |
 |
 |
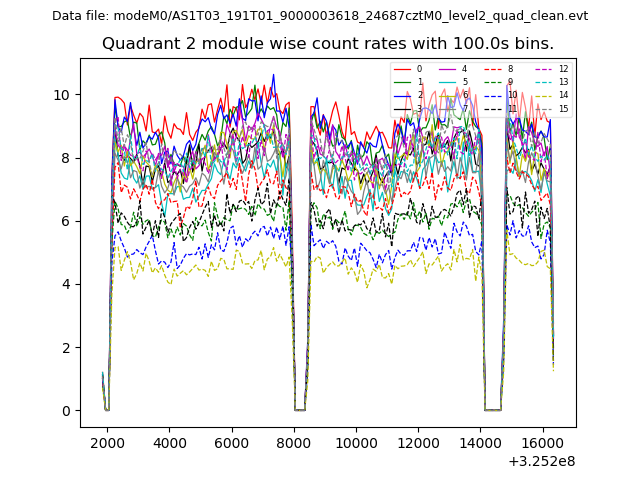
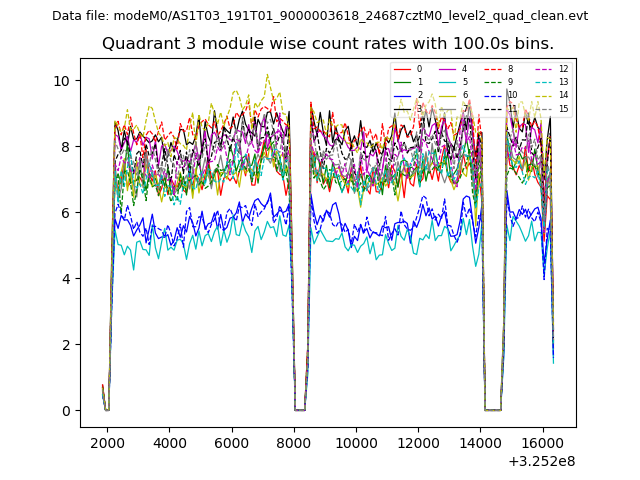
| Quadrant-wise count rates Data is divided into 100 sec bins |
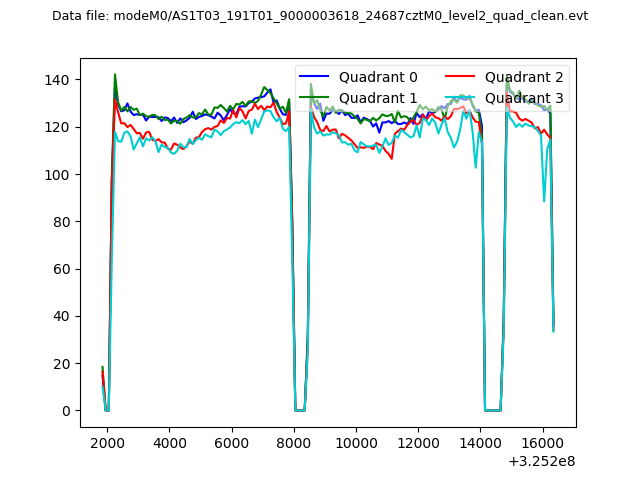 |
|
| Module-wise count rates for Quadrant A Data is divided into 100 sec bins |
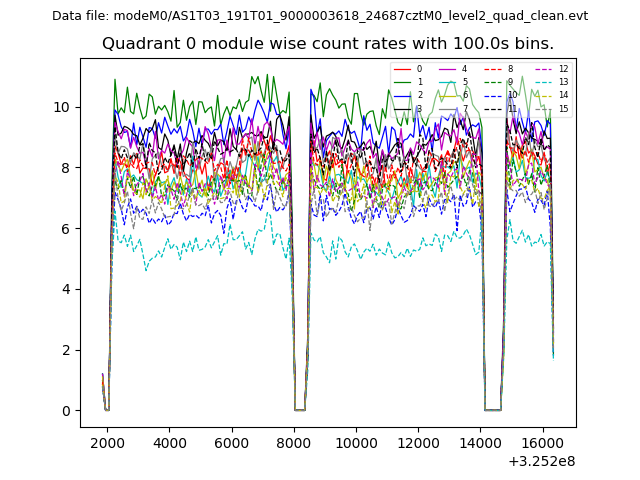 |
 |
| Module-wise count rates for Quadrant B Data is divided into 100 sec bins |
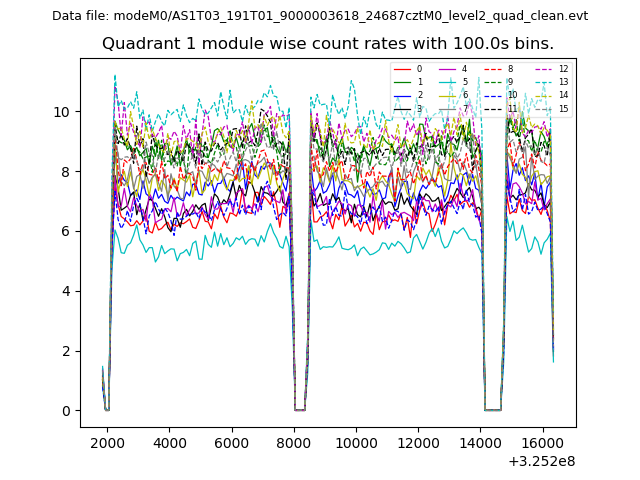 |
 |
| Module-wise count rates for Quadrant C Data is divided into 100 sec bins |
 |
 |
| Module-wise count rates for Quadrant D Data is divided into 100 sec bins |
 |
 |
| Parameter | Plot |
|---|---|
| CZT HV Monitor | 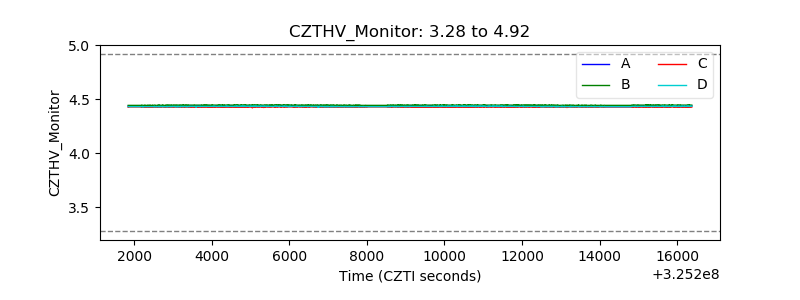 |
| D_VDD |  |
| Temperature 1 | 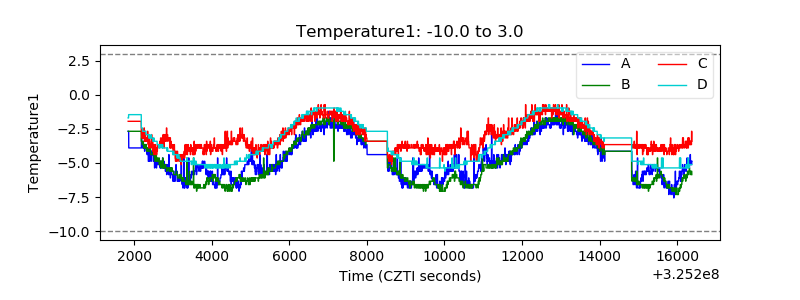 |
| Veto HV Monitor | 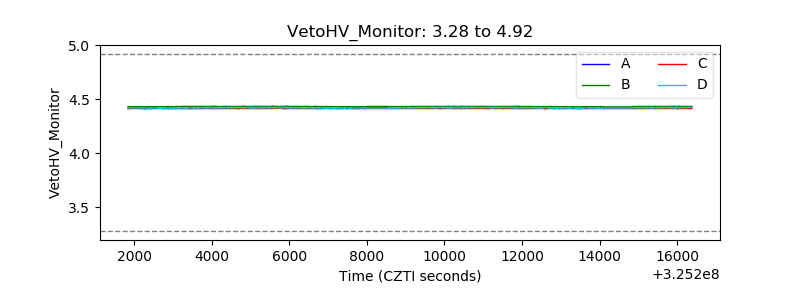 |
| Veto LLD | 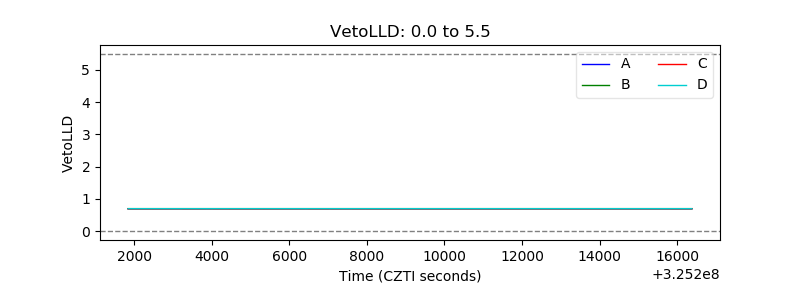 |
| Alpha Counter | 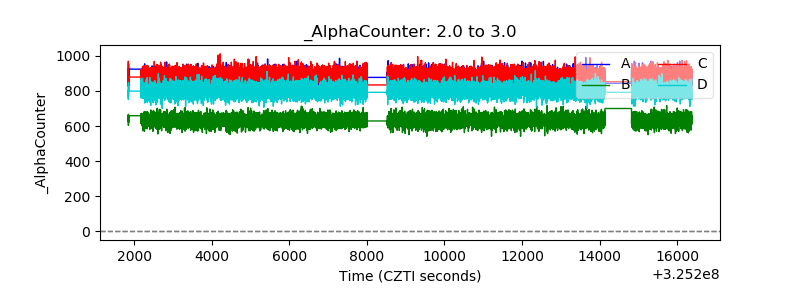 |
| _CPM_Rate | 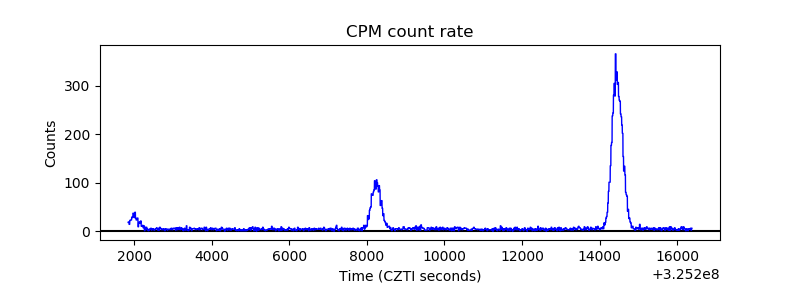 |
| CZT Counter | 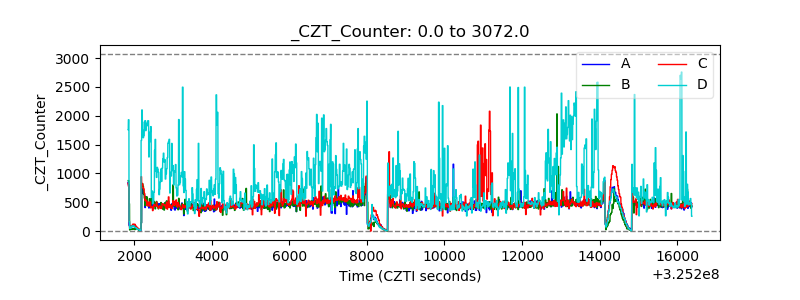 |
| +2.5 Volts monitor |  |
| +5 Volts monitor |  |
| _ROLL_ROT | 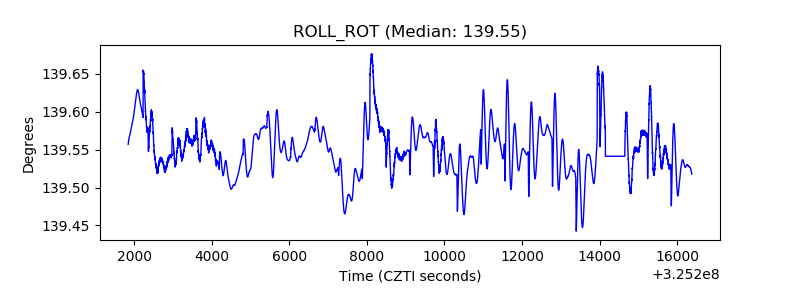 |
| _Roll_DEC | 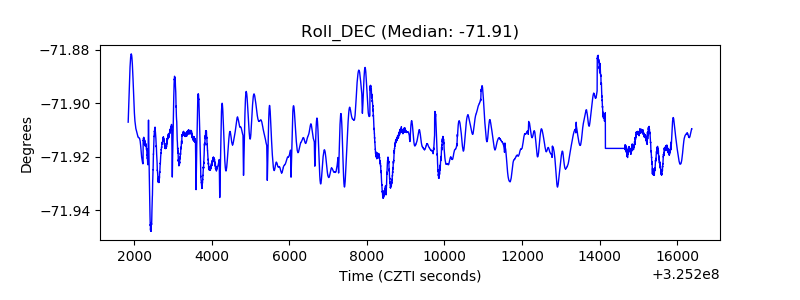 |
| _Roll_RA | 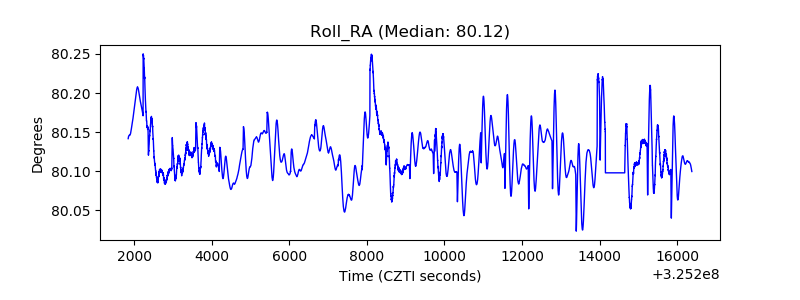 |
| Veto Counter | 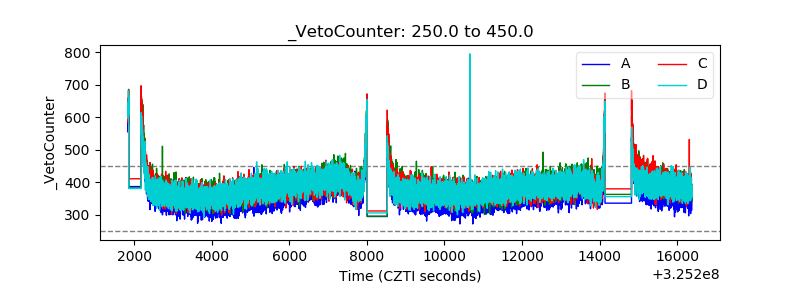 |