| Param | Original file | Final file |
|---|---|---|
| Filename | modeM0/AS1T03_191T01_9000003618_24688cztM0_level2.evt | modeM0/AS1T03_191T01_9000003618_24688cztM0_level2_quad_clean.evt |
| Size (bytes) | 510,292,800 | 133,992,000 |
| Size | 486.7 MB | 127.8 MB |
| Events in quadrant A | 3,278,404 | 916,238 |
| Events in quadrant B | 3,401,886 | 925,138 |
| Events in quadrant C | 3,361,713 | 874,054 |
| Events in quadrant D | 4,932,077 | 850,361 |
| Mode M9 | |||
|---|---|---|---|
| Quadrant | BADHDUFLAG | Total packets | Discarded packets |
| A | 0 | 12 | 0 |
| B | 0 | 13 | 0 |
| C | 0 | 13 | 0 |
| D | 0 | 13 | 0 |
| Mode M0 | |||
|---|---|---|---|
| Quadrant | BADHDUFLAG | Total packets | Discarded packets |
| A | 0 | 14340 | 2 |
| B | 0 | 14638 | 3 |
| C | 0 | 14469 | 2 |
| D | 0 | 19398 | 2 |
| Mode SS | |||
|---|---|---|---|
| Quadrant | BADHDUFLAG | Total packets | Discarded packets |
| A | 0 | 144 | 0 |
| B | 0 | 144 | 0 |
| C | 0 | 144 | 0 |
| D | 0 | 144 | 0 |
| Quadrant | Total seconds | Saturated seconds | Saturation percentage |
|---|---|---|---|
| A | 7073 | 36 | 0.508978% |
| B | 7072 | 60 | 0.848416% |
| C | 7072 | 95 | 1.343326% |
| D | 7072 | 237 | 3.351244% |
Noise dominated data is calculated using 1-second bins in cleaned event files. If a bin has >2000 counts, and if more than 50% of those come from <1% of pixels, then it is considered to be noise-dominated and hence unusable.
| Quadrant | # 1 sec bins | Bins with >0 counts | Bins with >2000 counts | High rate bins dominated by noise | Noise dominated (total time) | Noise dominated (detector-on time) | Marked lightcurve |
|---|---|---|---|---|---|---|---|
| A | 7893 | 7073 | 0 | 0 | 0.00% | 0.00% | 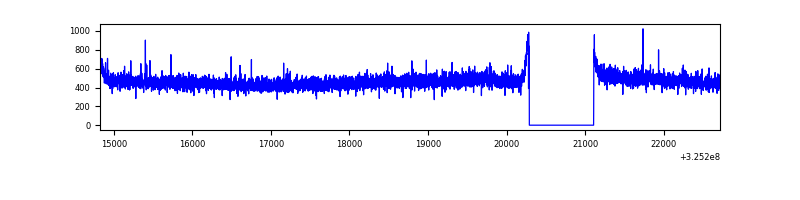 |
| B | 7892 | 7072 | 0 | 0 | 0.00% | 0.00% | 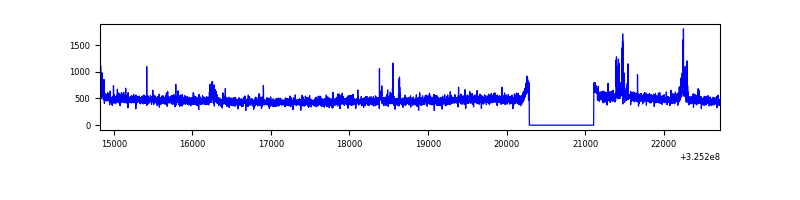 |
| C | 7892 | 7072 | 5 | 5 | 0.06% | 0.07% | 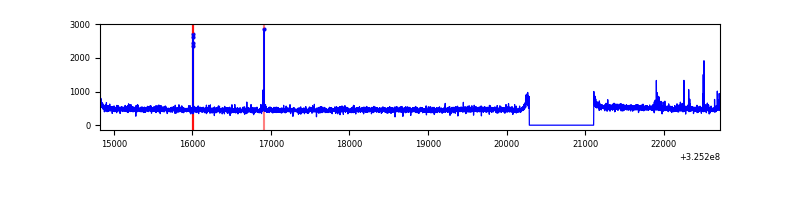 |
| D | 7892 | 7072 | 179 | 179 | 2.27% | 2.53% | 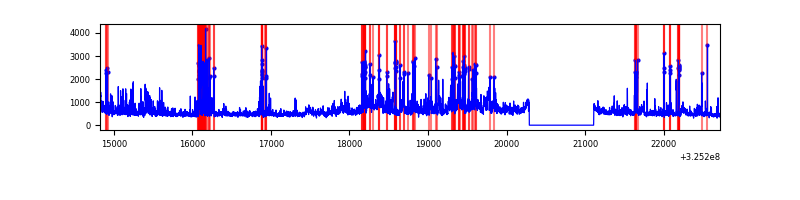 |
Top three noisy pixels from each quadrant. If the there are fewer than three noisy pixels in the level2.evt file, extra rows are filled as -1
| Pixel properties | Quadrant properties | ||||||
|---|---|---|---|---|---|---|---|
| Quadrant | DetID | PixID | Counts | Sigma | Mean | Median | Sigma |
| A | 13 | 254 | 10802 | 58.48 | 848 | 831 | 170.5 |
| A | 3 | 137 | 7709 | 40.34 | 848 | 831 | 170.5 |
| A | 0 | 226 | 7272 | 37.78 | 848 | 831 | 170.5 |
| B | 0 | 189 | 78792 | 483.56 | 844 | 822 | 161.2 |
| B | 12 | 111 | 19562 | 116.22 | 844 | 822 | 161.2 |
| B | 11 | 111 | 17767 | 105.09 | 844 | 822 | 161.2 |
| C | 14 | 238 | 131117 | 684.9 | 813 | 817 | 190.2 |
| C | 2 | 16 | 35669 | 183.19 | 813 | 817 | 190.2 |
| C | 6 | 96 | 17711 | 88.8 | 813 | 817 | 190.2 |
| D | 1 | 52 | 1121275 | 5685.81 | 817 | 793 | 197.1 |
| D | 7 | 238 | 501865 | 2542.66 | 817 | 793 | 197.1 |
| D | 8 | 195 | 153813 | 776.49 | 817 | 793 | 197.1 |
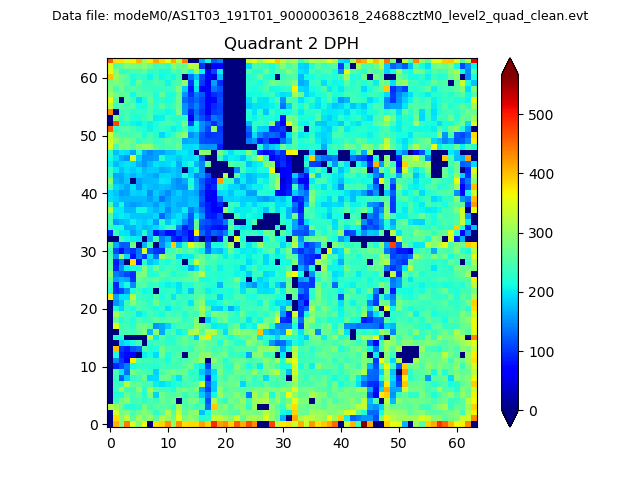
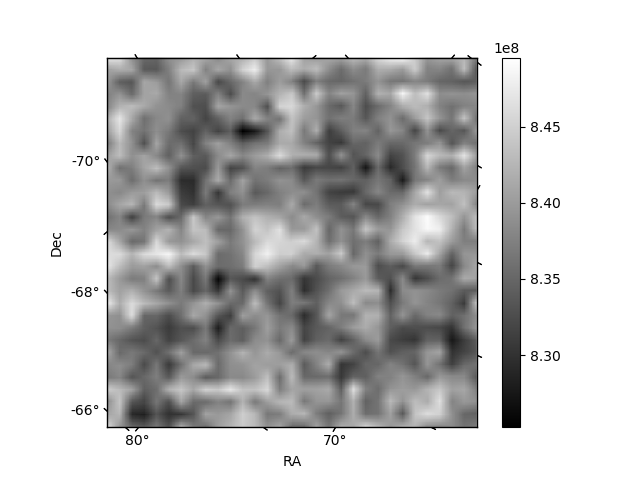
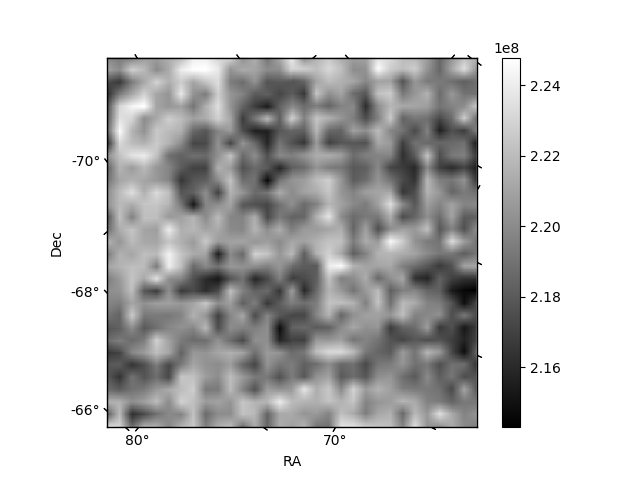
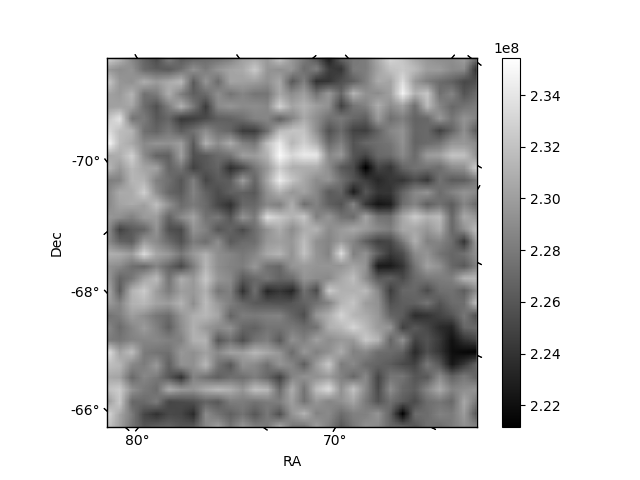
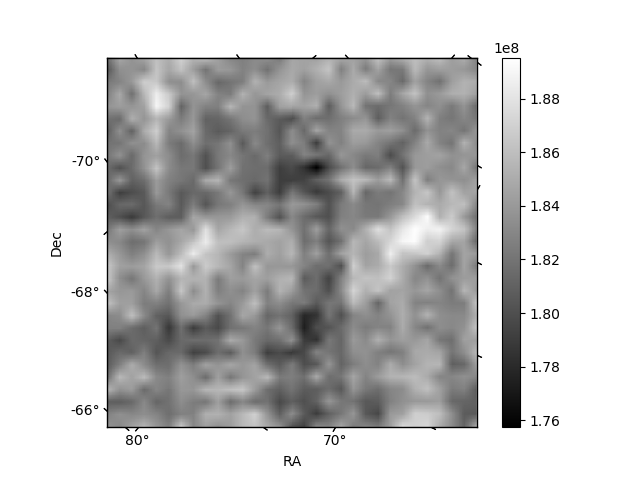
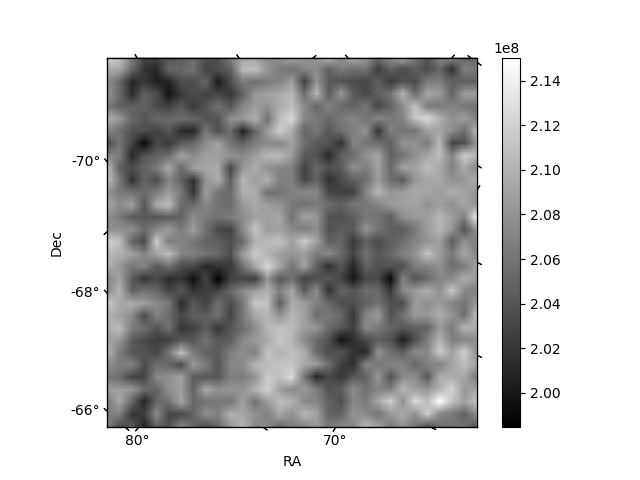
Histogram calculated using DETX and DETY for each event in the final _common_clean file
| Quadrant A | 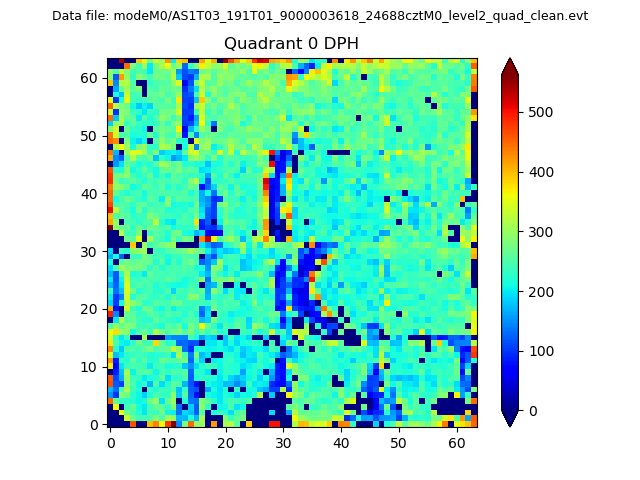 |
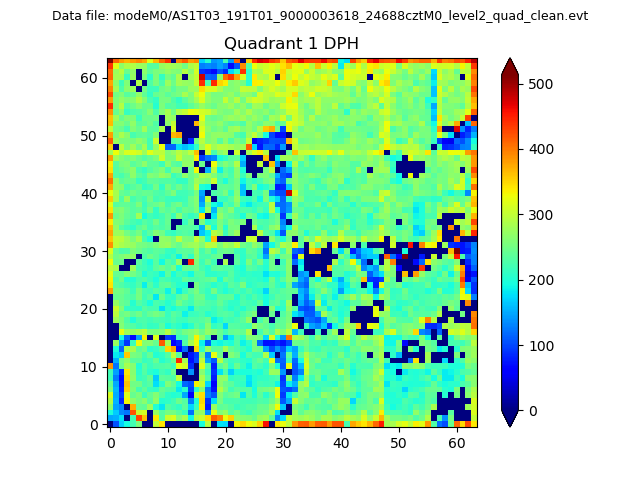 |
Quadrant B |
|---|---|---|---|
| Quadrant D | 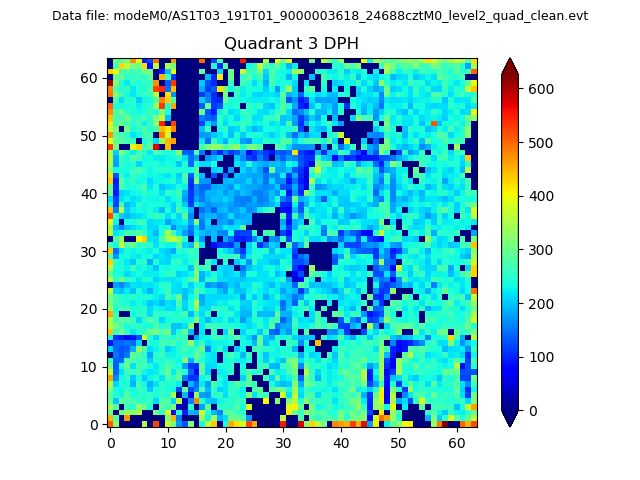 |
 |
Quadrant C |
| Plot type | Count rate plots | Images |
|---|---|---|
| Comparison with Poisson distribution Blue bars denote a histogram of data divided into 1 sec bins. Red curve is a Poisson curve with rate = median count rate of data. |
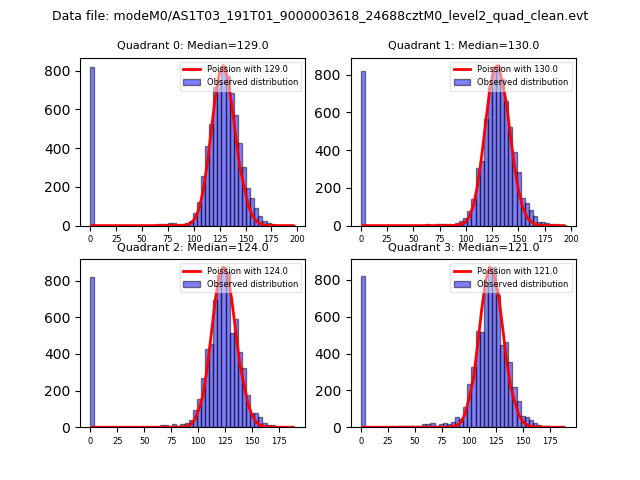 |
 |
| Quadrant-wise count rates Data is divided into 100 sec bins |
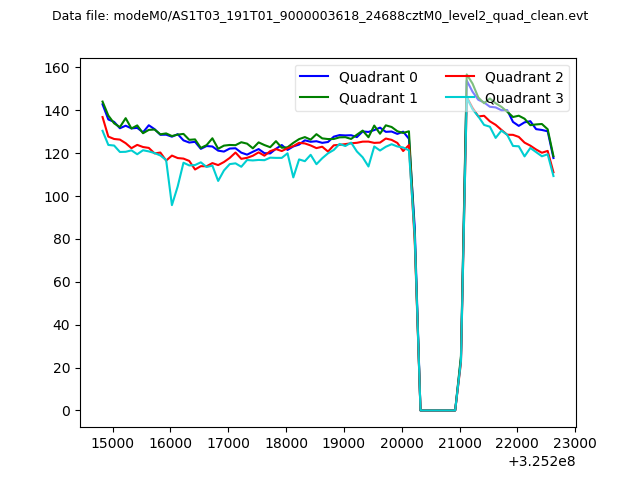 |
|
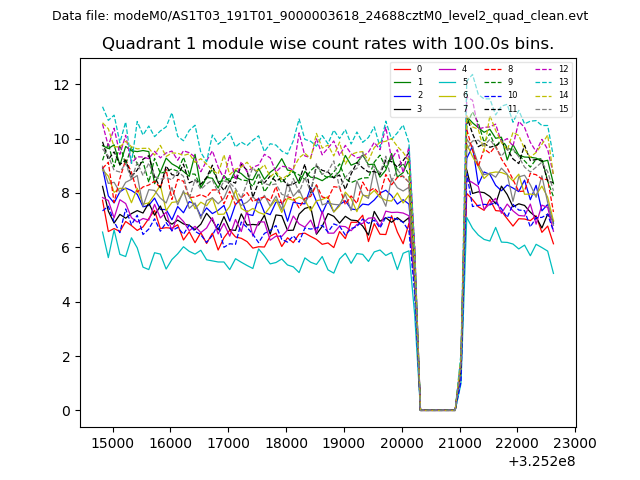
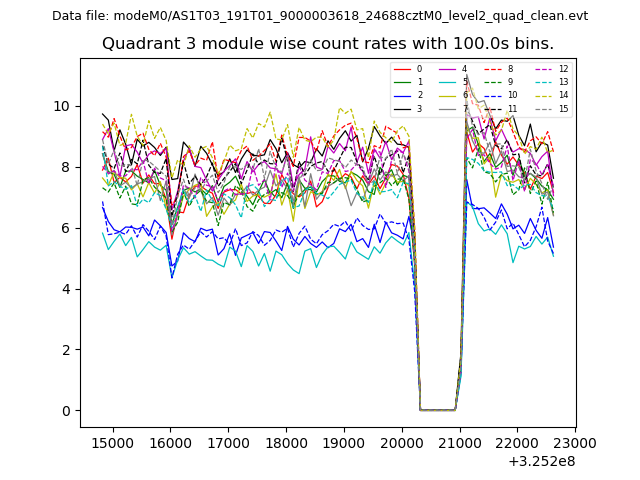
| Module-wise count rates for Quadrant A Data is divided into 100 sec bins |
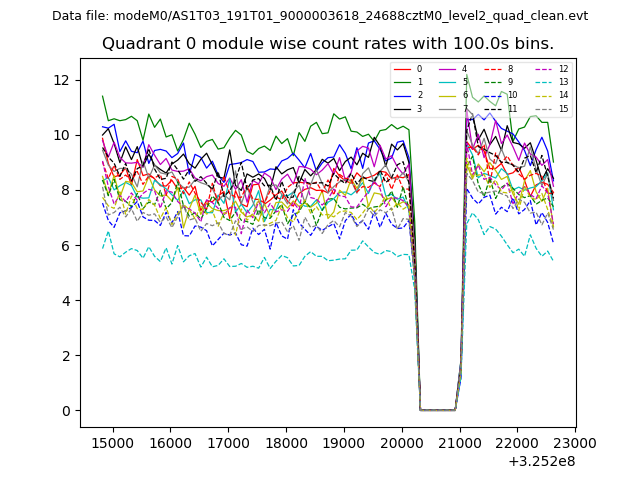 |
 |
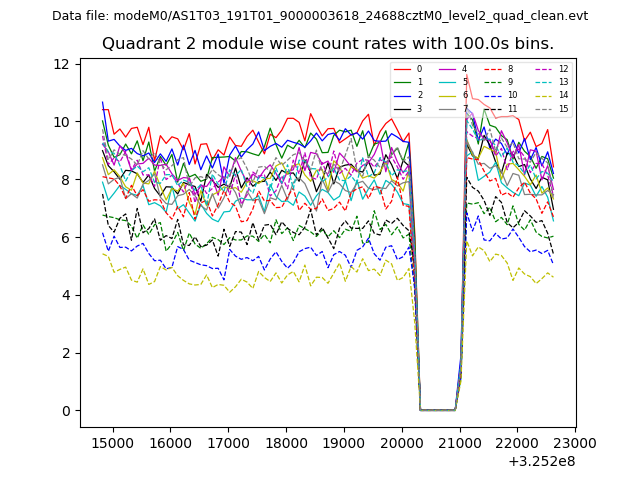
| Module-wise count rates for Quadrant B Data is divided into 100 sec bins |
 |
 |
| Module-wise count rates for Quadrant C Data is divided into 100 sec bins |
 |
 |
| Module-wise count rates for Quadrant D Data is divided into 100 sec bins |
 |
 |
| Parameter | Plot |
|---|---|
| CZT HV Monitor | 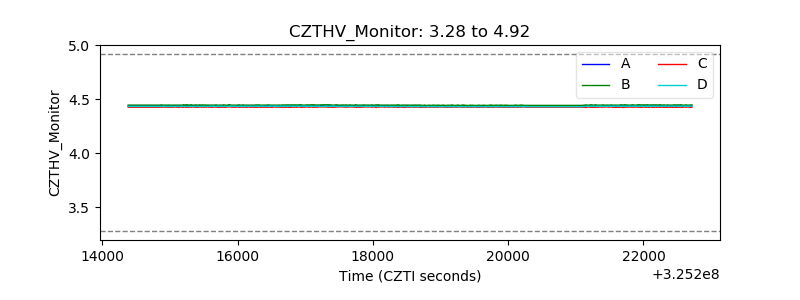 |
| D_VDD | 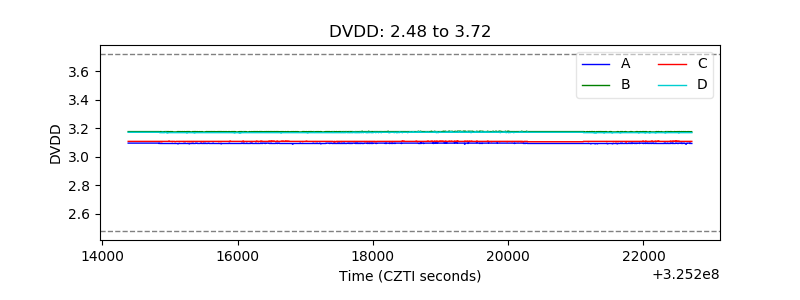 |
| Temperature 1 | 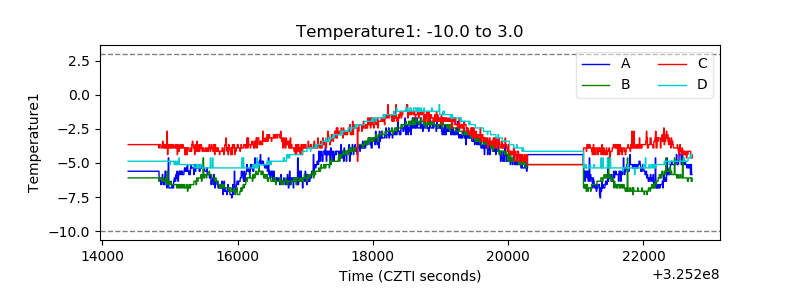 |
| Veto HV Monitor | 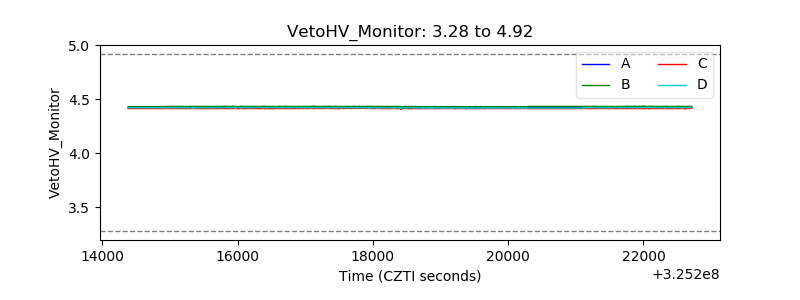 |
| Veto LLD | 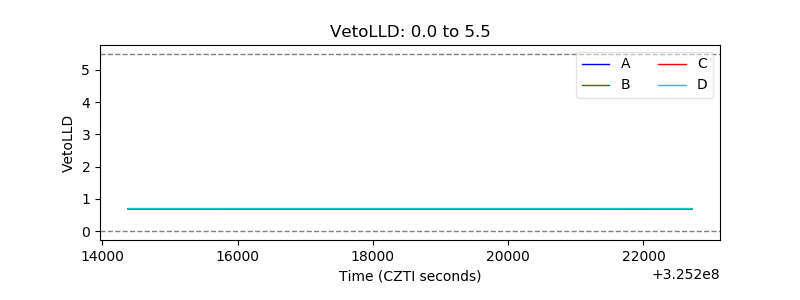 |
| Alpha Counter | 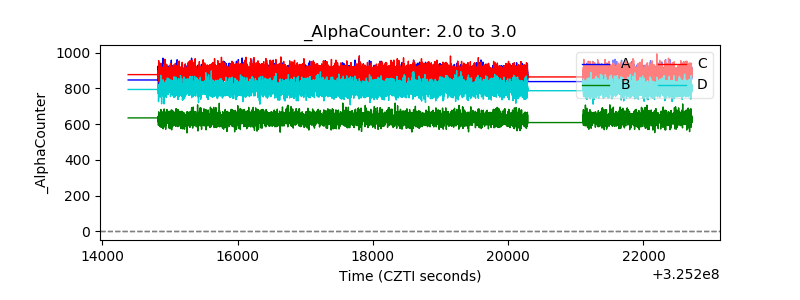 |
| _CPM_Rate | 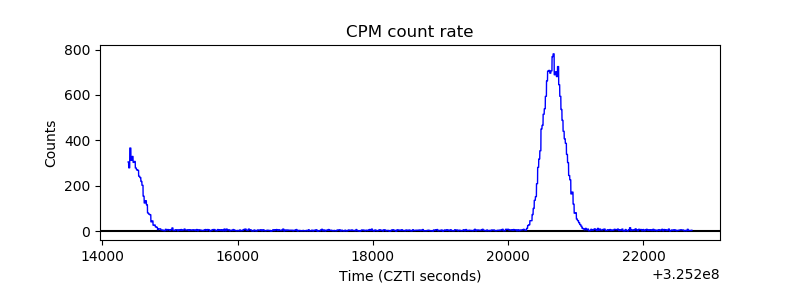 |
| CZT Counter | 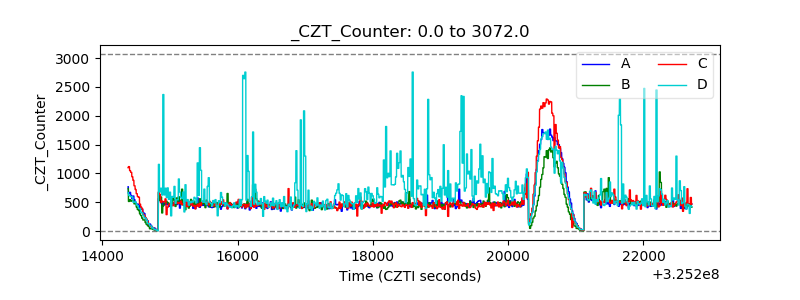 |
| +2.5 Volts monitor |  |
| +5 Volts monitor | 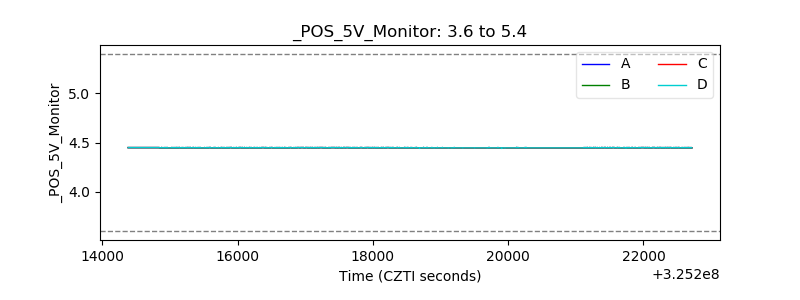 |
| _ROLL_ROT | 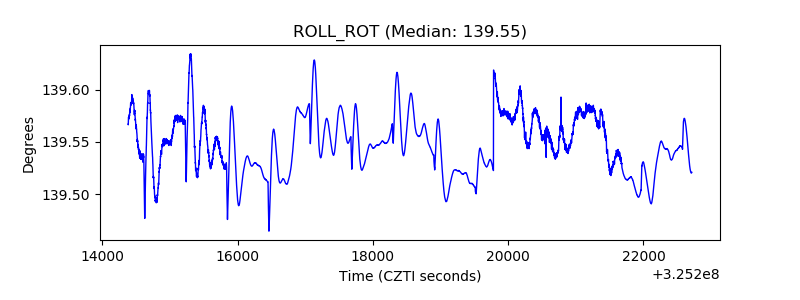 |
| _Roll_DEC | 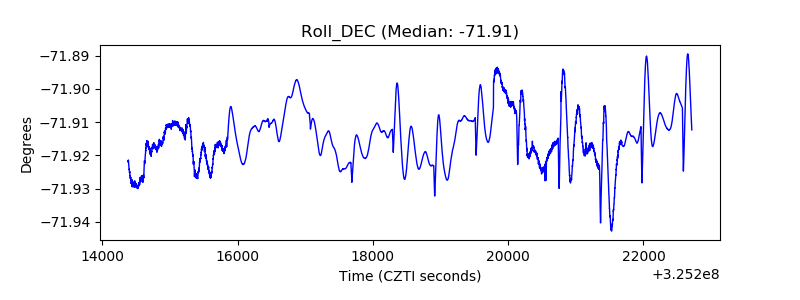 |
| _Roll_RA | 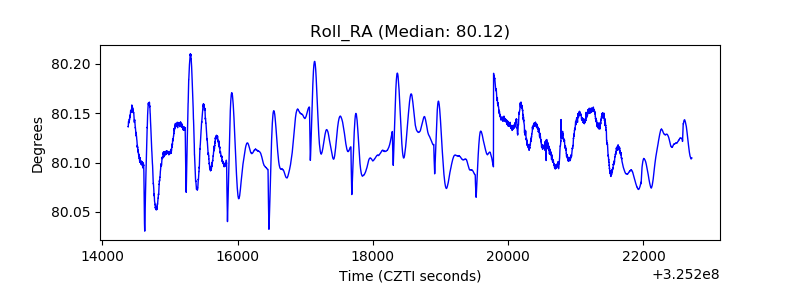 |
| Veto Counter | 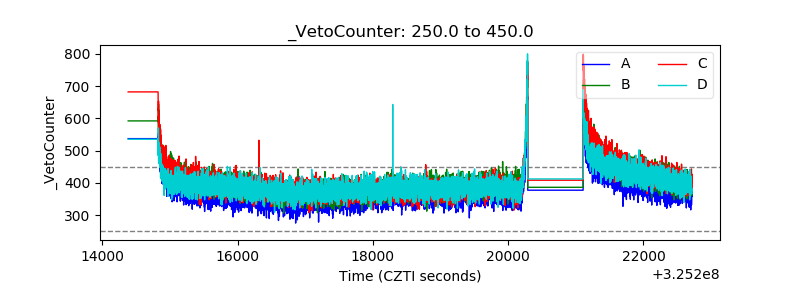 |