| Param | Original file | Final file |
|---|---|---|
| Filename | modeM0/AS1T03_191T01_9000003618_24692cztM0_level2.evt | modeM0/AS1T03_191T01_9000003618_24692cztM0_level2_quad_clean.evt |
| Size (bytes) | 557,830,080 | 140,892,480 |
| Size | 532.0 MB | 134.4 MB |
| Events in quadrant A | 3,309,775 | 984,811 |
| Events in quadrant B | 3,358,382 | 995,500 |
| Events in quadrant C | 4,392,612 | 936,089 |
| Events in quadrant D | 5,405,555 | 910,286 |
| Mode M9 | |||
|---|---|---|---|
| Quadrant | BADHDUFLAG | Total packets | Discarded packets |
| A | 0 | 12 | 0 |
| B | 0 | 12 | 0 |
| C | 0 | 12 | 0 |
| D | 0 | 12 | 0 |
| Mode M0 | |||
|---|---|---|---|
| Quadrant | BADHDUFLAG | Total packets | Discarded packets |
| A | 0 | 13946 | 1 |
| B | 0 | 14080 | 1 |
| C | 0 | 17400 | 1 |
| D | 0 | 20416 | 1 |
| Mode SS | |||
|---|---|---|---|
| Quadrant | BADHDUFLAG | Total packets | Discarded packets |
| A | 0 | 128 | 0 |
| B | 0 | 128 | 0 |
| C | 0 | 128 | 0 |
| D | 0 | 128 | 0 |
| Quadrant | Total seconds | Saturated seconds | Saturation percentage |
|---|---|---|---|
| A | 6316 | 52 | 0.823306% |
| B | 6316 | 67 | 1.060798% |
| C | 6316 | 210 | 3.324889% |
| D | 6316 | 385 | 6.095630% |
Noise dominated data is calculated using 1-second bins in cleaned event files. If a bin has >2000 counts, and if more than 50% of those come from <1% of pixels, then it is considered to be noise-dominated and hence unusable.
| Quadrant | # 1 sec bins | Bins with >0 counts | Bins with >2000 counts | High rate bins dominated by noise | Noise dominated (total time) | Noise dominated (detector-on time) | Marked lightcurve |
|---|---|---|---|---|---|---|---|
| A | 7541 | 6316 | 5 | 5 | 0.07% | 0.08% | 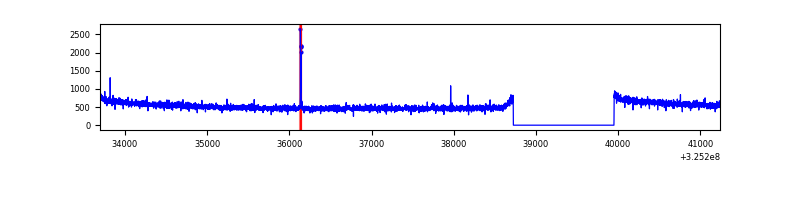 |
| B | 7541 | 6316 | 8 | 8 | 0.11% | 0.13% | 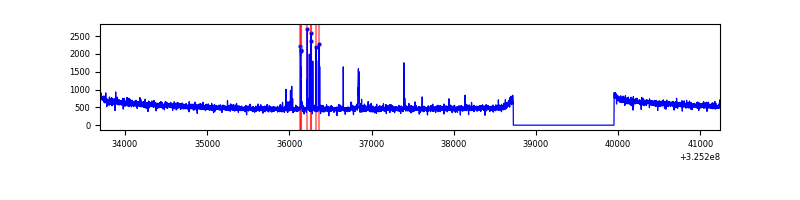 |
| C | 7541 | 6316 | 34 | 34 | 0.45% | 0.54% | 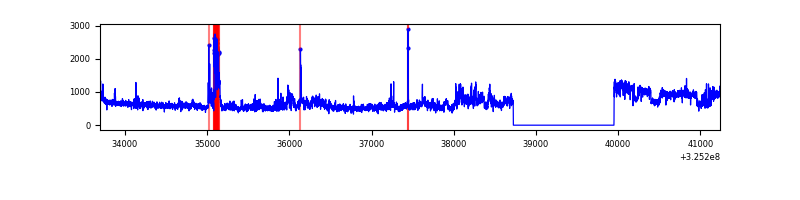 |
| D | 7541 | 6316 | 297 | 297 | 3.94% | 4.70% | 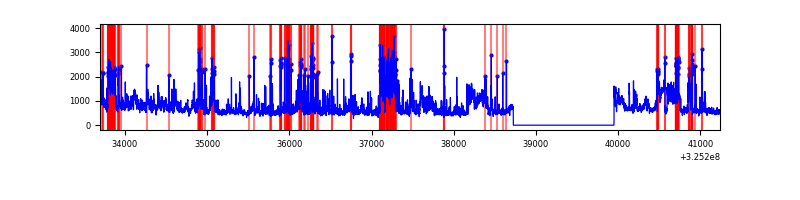 |
Top three noisy pixels from each quadrant. If the there are fewer than three noisy pixels in the level2.evt file, extra rows are filled as -1
| Pixel properties | Quadrant properties | ||||||
|---|---|---|---|---|---|---|---|
| Quadrant | DetID | PixID | Counts | Sigma | Mean | Median | Sigma |
| A | 13 | 254 | 10338 | 56.04 | 857 | 843 | 169.4 |
| A | 0 | 226 | 7698 | 40.46 | 857 | 843 | 169.4 |
| A | 3 | 137 | 7003 | 36.35 | 857 | 843 | 169.4 |
| B | 4 | 80 | 42203 | 266.54 | 843 | 824 | 155.2 |
| B | 0 | 190 | 19351 | 119.34 | 843 | 824 | 155.2 |
| B | 12 | 111 | 18340 | 112.83 | 843 | 824 | 155.2 |
| C | 7 | 247 | 944079 | 5049.26 | 818 | 824 | 186.8 |
| C | 14 | 238 | 134275 | 714.37 | 818 | 824 | 186.8 |
| C | 10 | 91 | 79385 | 420.54 | 818 | 824 | 186.8 |
| D | 1 | 52 | 2037910 | 10271.17 | 828 | 804 | 198.3 |
| D | 8 | 195 | 167188 | 838.91 | 828 | 804 | 198.3 |
| D | 10 | 199 | 31815 | 156.36 | 828 | 804 | 198.3 |
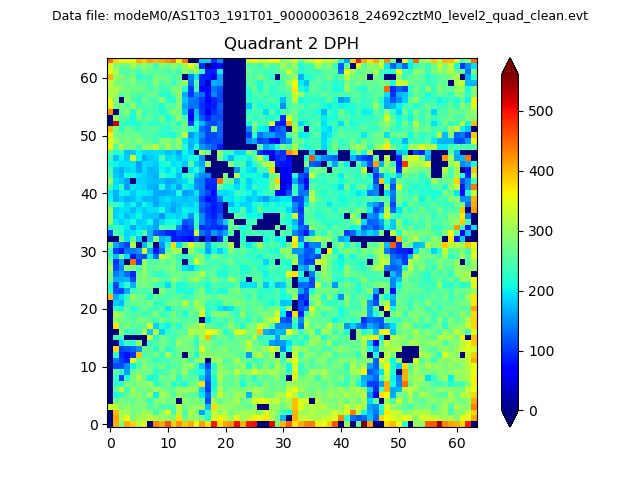
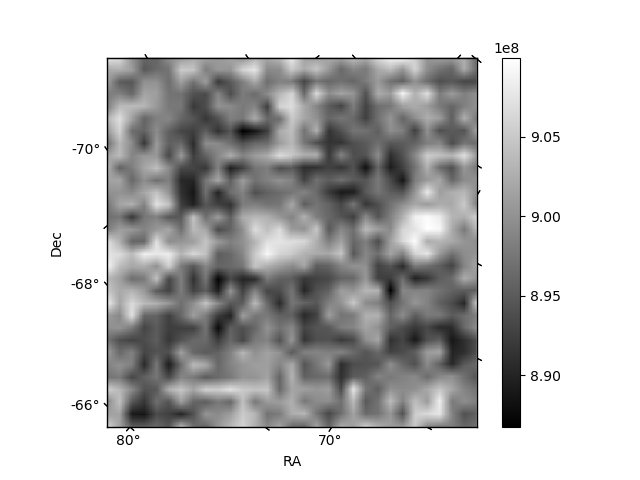
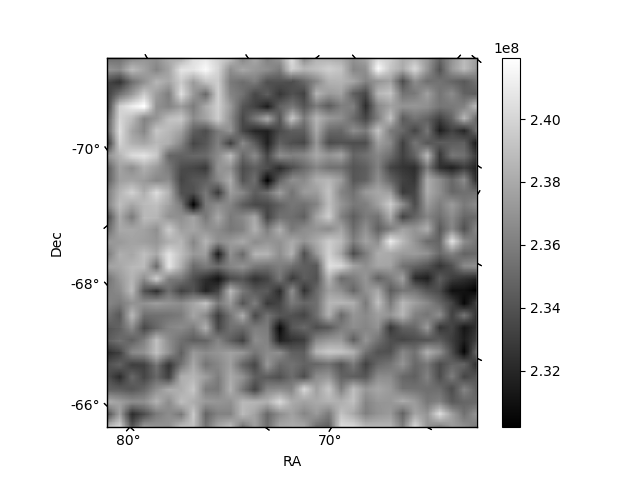
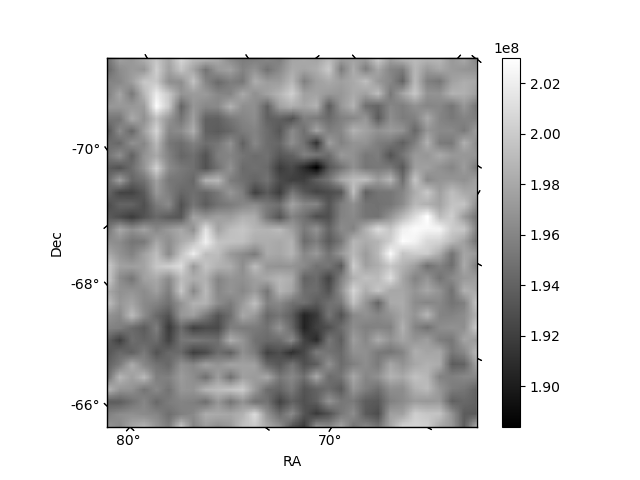
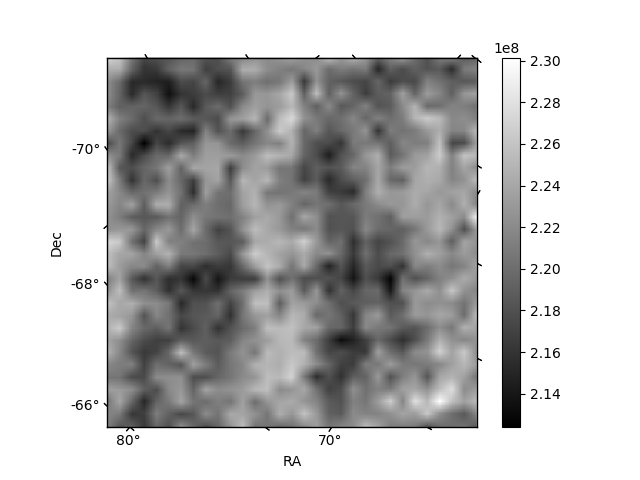
Histogram calculated using DETX and DETY for each event in the final _common_clean file
| Quadrant A | 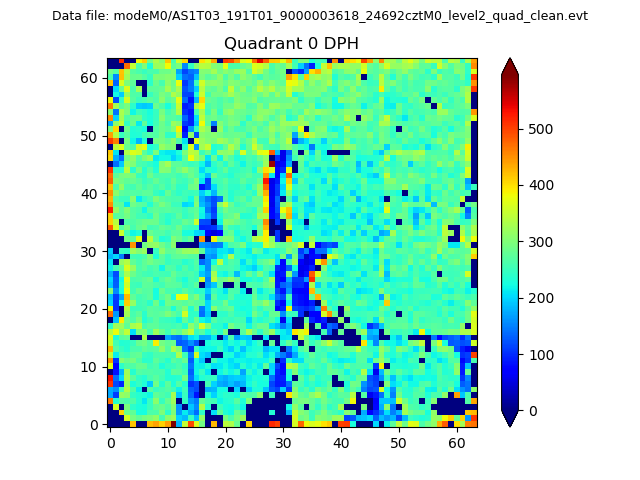 |
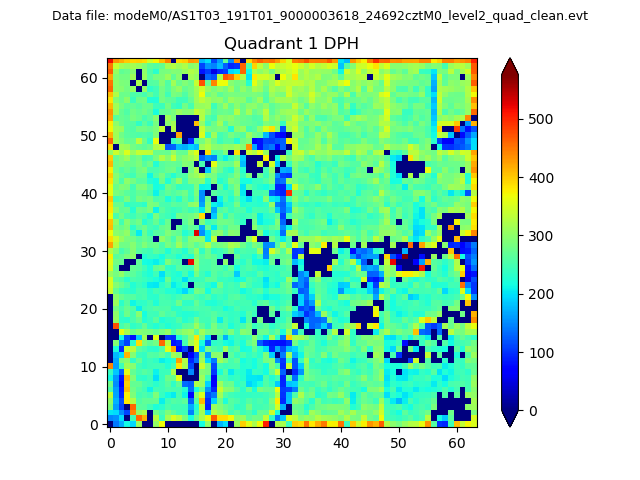 |
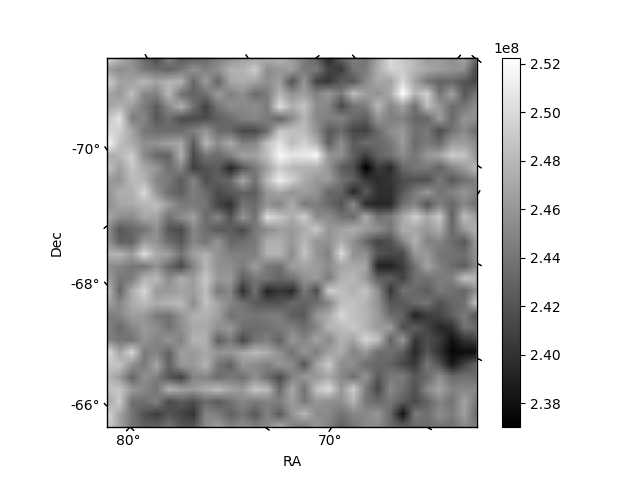
Quadrant B |
|---|---|---|---|
| Quadrant D | 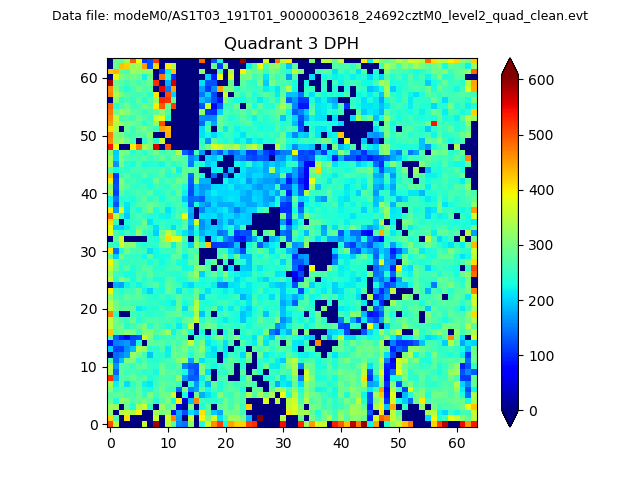 |
 |
Quadrant C |
| Plot type | Count rate plots | Images |
|---|---|---|
| Comparison with Poisson distribution Blue bars denote a histogram of data divided into 1 sec bins. Red curve is a Poisson curve with rate = median count rate of data. |
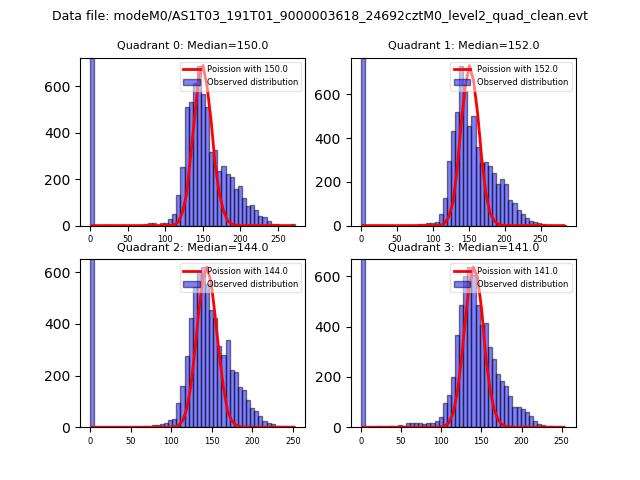 |
 |
| Quadrant-wise count rates Data is divided into 100 sec bins |
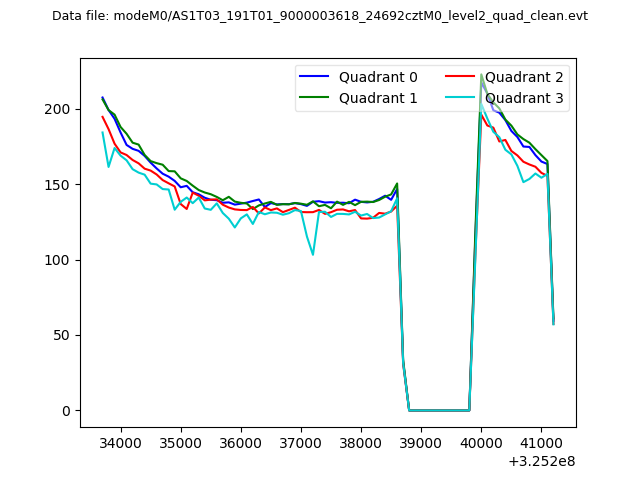 |
|
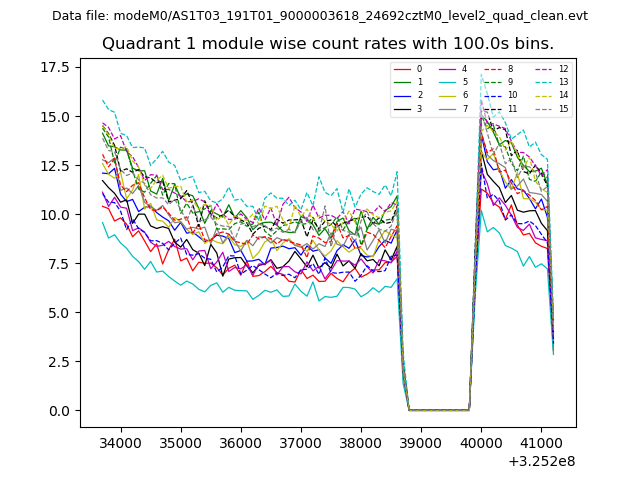
| Module-wise count rates for Quadrant A Data is divided into 100 sec bins |
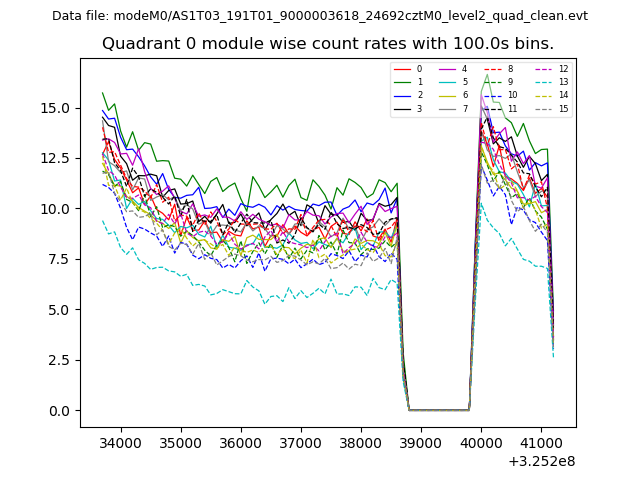 |
 |
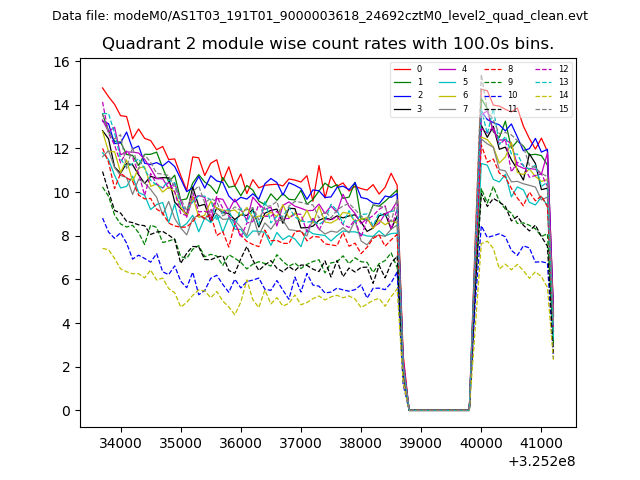
| Module-wise count rates for Quadrant B Data is divided into 100 sec bins |
 |
 |
| Module-wise count rates for Quadrant C Data is divided into 100 sec bins |
 |
 |
| Module-wise count rates for Quadrant D Data is divided into 100 sec bins |
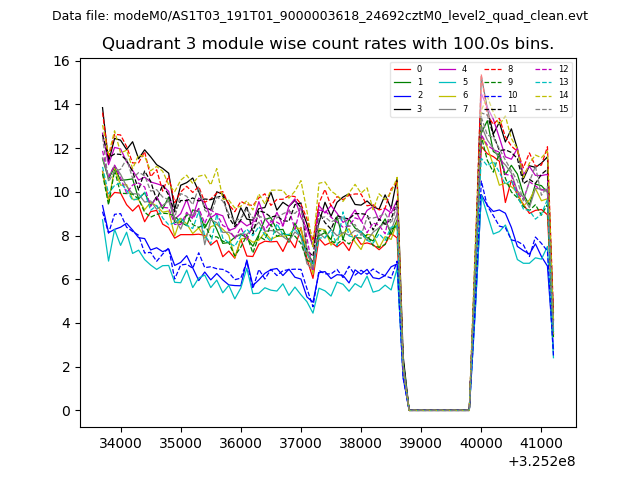 |
 |
| Parameter | Plot |
|---|---|
| CZT HV Monitor | 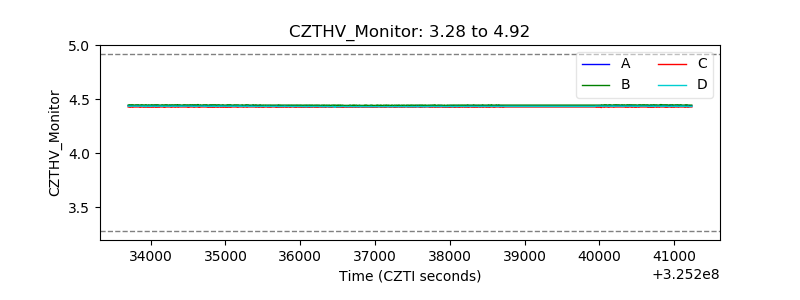 |
| D_VDD | 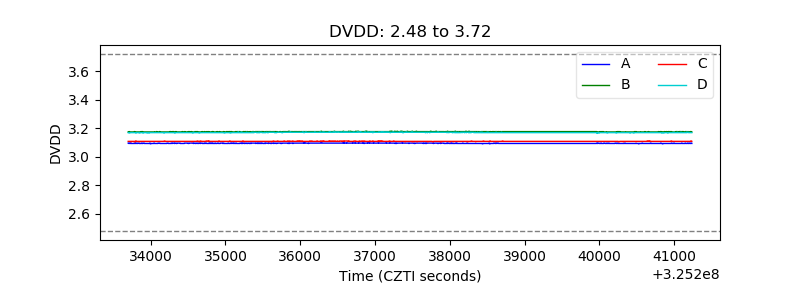 |
| Temperature 1 | 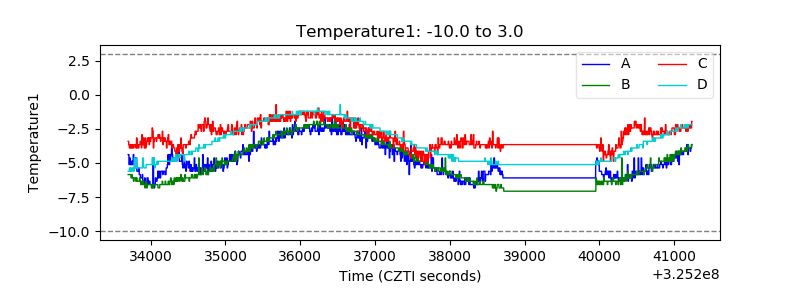 |
| Veto HV Monitor | 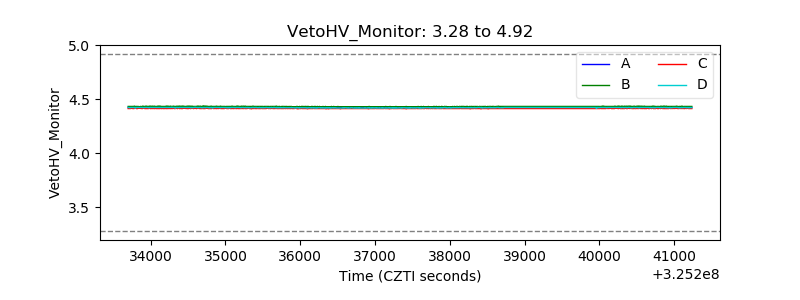 |
| Veto LLD | 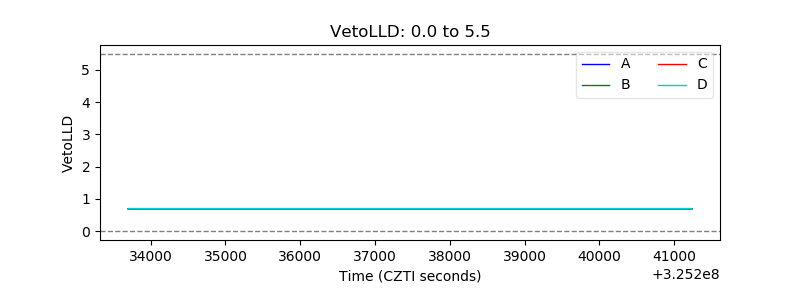 |
| Alpha Counter | 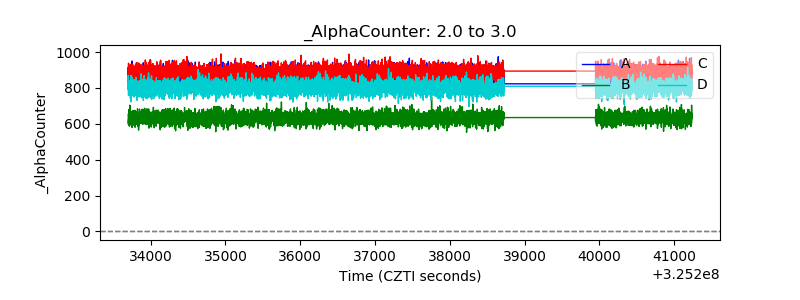 |
| _CPM_Rate | 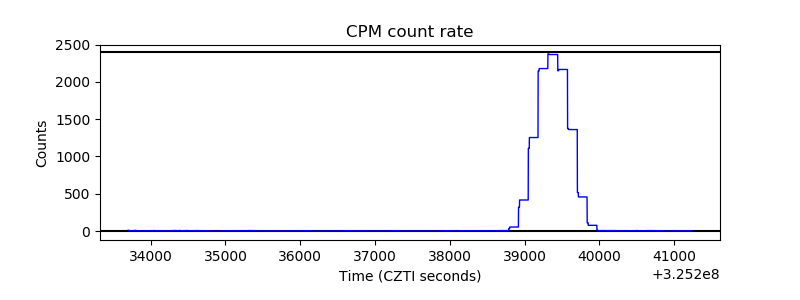 |
| CZT Counter | 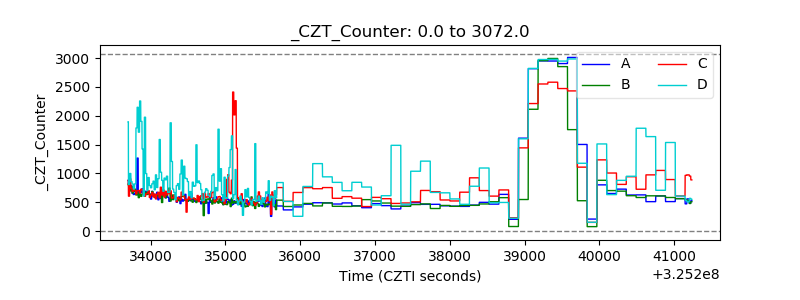 |
| +2.5 Volts monitor | 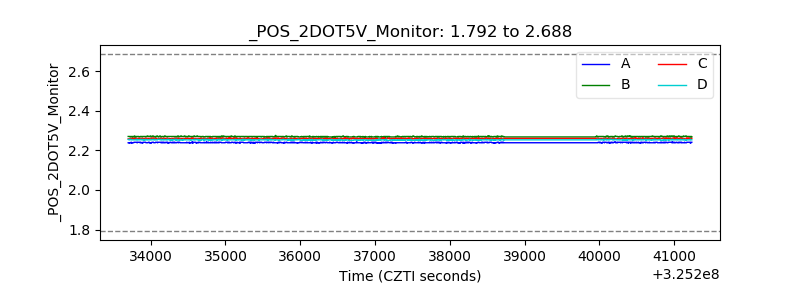 |
| +5 Volts monitor |  |
| _ROLL_ROT | 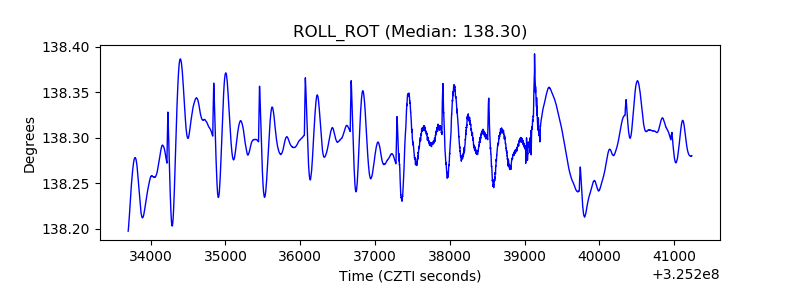 |
| _Roll_DEC | 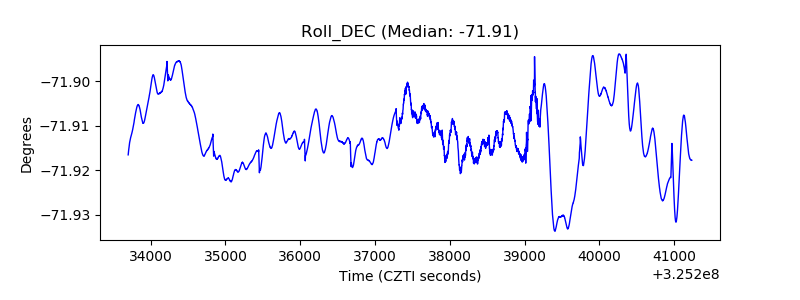 |
| _Roll_RA | 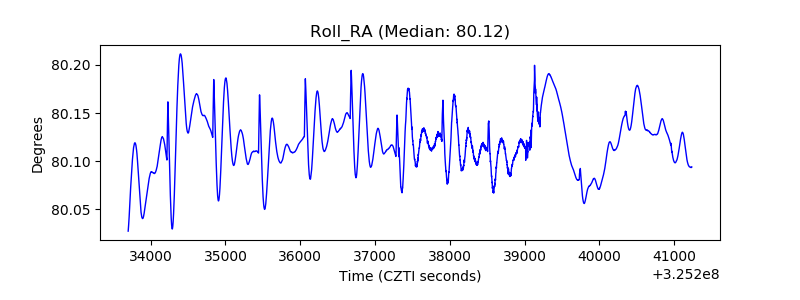 |
| Veto Counter | 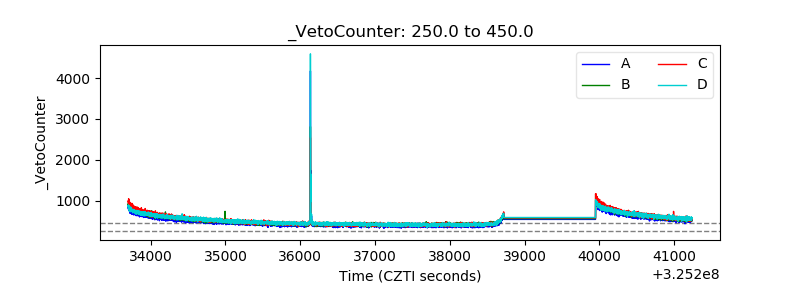 |