| Param | Original file | Final file |
|---|---|---|
| Filename | modeM0/AS1T03_191T01_9000003618_24693cztM0_level2.evt | modeM0/AS1T03_191T01_9000003618_24693cztM0_level2_quad_clean.evt |
| Size (bytes) | 585,642,240 | 149,353,920 |
| Size | 558.5 MB | 142.4 MB |
| Events in quadrant A | 3,456,943 | 1,052,085 |
| Events in quadrant B | 3,496,033 | 1,057,896 |
| Events in quadrant C | 5,246,857 | 985,471 |
| Events in quadrant D | 5,096,839 | 975,176 |
| Mode M9 | |||
|---|---|---|---|
| Quadrant | BADHDUFLAG | Total packets | Discarded packets |
| A | 0 | 13 | 0 |
| B | 0 | 13 | 0 |
| C | 0 | 13 | 0 |
| D | 0 | 13 | 0 |
| Mode M0 | |||
|---|---|---|---|
| Quadrant | BADHDUFLAG | Total packets | Discarded packets |
| A | 0 | 14424 | 2 |
| B | 0 | 14475 | 1 |
| C | 0 | 20018 | 1 |
| D | 0 | 19621 | 1 |
| Mode SS | |||
|---|---|---|---|
| Quadrant | BADHDUFLAG | Total packets | Discarded packets |
| A | 0 | 132 | 0 |
| B | 0 | 132 | 0 |
| C | 0 | 132 | 0 |
| D | 0 | 132 | 0 |
| Quadrant | Total seconds | Saturated seconds | Saturation percentage |
|---|---|---|---|
| A | 6499 | 44 | 0.677027% |
| B | 6500 | 33 | 0.507692% |
| C | 6500 | 171 | 2.630769% |
| D | 6500 | 263 | 4.046154% |
Noise dominated data is calculated using 1-second bins in cleaned event files. If a bin has >2000 counts, and if more than 50% of those come from <1% of pixels, then it is considered to be noise-dominated and hence unusable.
| Quadrant | # 1 sec bins | Bins with >0 counts | Bins with >2000 counts | High rate bins dominated by noise | Noise dominated (total time) | Noise dominated (detector-on time) | Marked lightcurve |
|---|---|---|---|---|---|---|---|
| A | 7809 | 6500 | 0 | 0 | 0.00% | 0.00% | 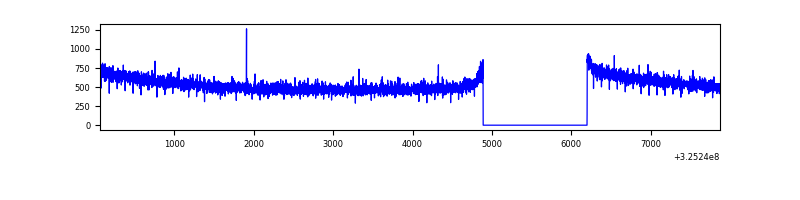 |
| B | 7810 | 6501 | 0 | 0 | 0.00% | 0.00% | 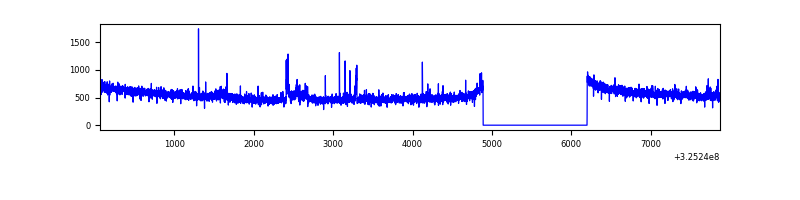 |
| C | 7810 | 6500 | 0 | 0 | 0.00% | 0.00% | 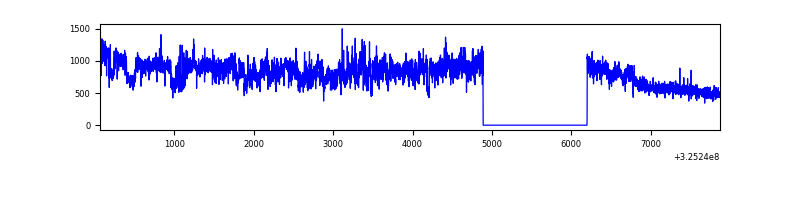 |
| D | 7810 | 6500 | 244 | 244 | 3.12% | 3.75% |  |
Top three noisy pixels from each quadrant. If the there are fewer than three noisy pixels in the level2.evt file, extra rows are filled as -1
| Pixel properties | Quadrant properties | ||||||
|---|---|---|---|---|---|---|---|
| Quadrant | DetID | PixID | Counts | Sigma | Mean | Median | Sigma |
| A | 13 | 254 | 10402 | 53.72 | 895 | 880 | 177.2 |
| A | 0 | 226 | 8024 | 40.3 | 895 | 880 | 177.2 |
| A | 3 | 137 | 7059 | 34.86 | 895 | 880 | 177.2 |
| B | 0 | 190 | 41323 | 253.55 | 872 | 854 | 159.6 |
| B | 0 | 189 | 24257 | 146.63 | 872 | 854 | 159.6 |
| B | 12 | 111 | 18388 | 109.86 | 872 | 854 | 159.6 |
| C | 7 | 247 | 1791256 | 9318.62 | 840 | 847 | 192.1 |
| C | 14 | 238 | 137547 | 711.49 | 840 | 847 | 192.1 |
| C | 2 | 16 | 18536 | 92.07 | 840 | 847 | 192.1 |
| D | 1 | 52 | 1484324 | 7207.71 | 862 | 838 | 205.8 |
| D | 8 | 195 | 284218 | 1376.84 | 862 | 838 | 205.8 |
| D | 12 | 233 | 24448 | 114.71 | 862 | 838 | 205.8 |
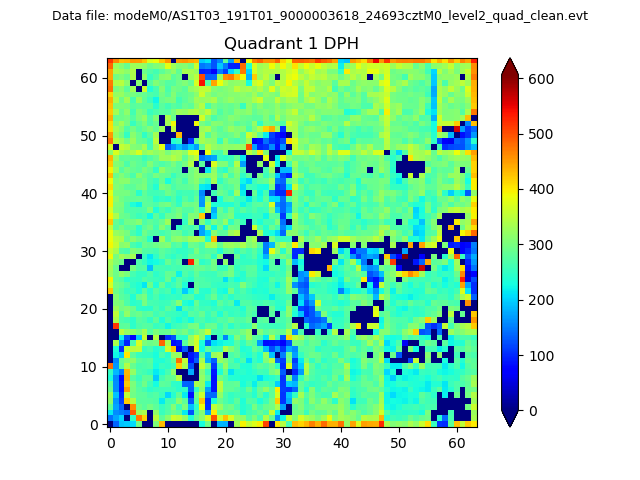
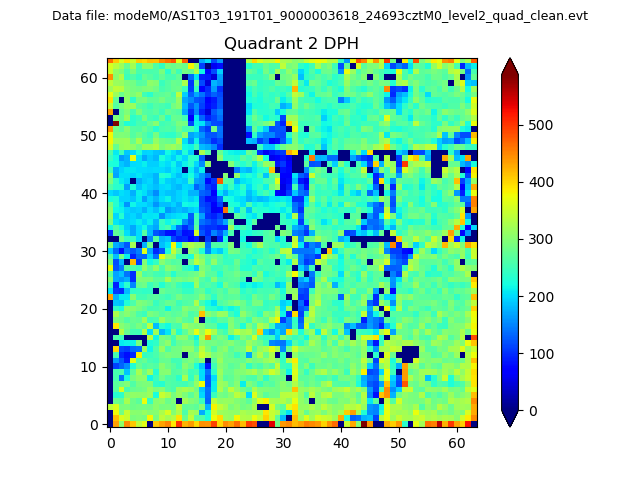
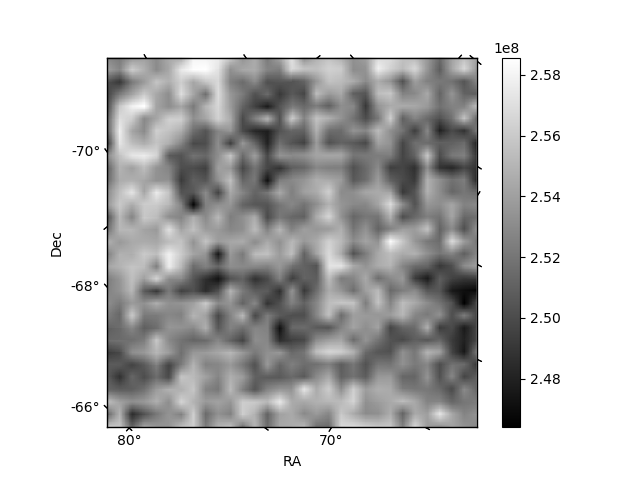
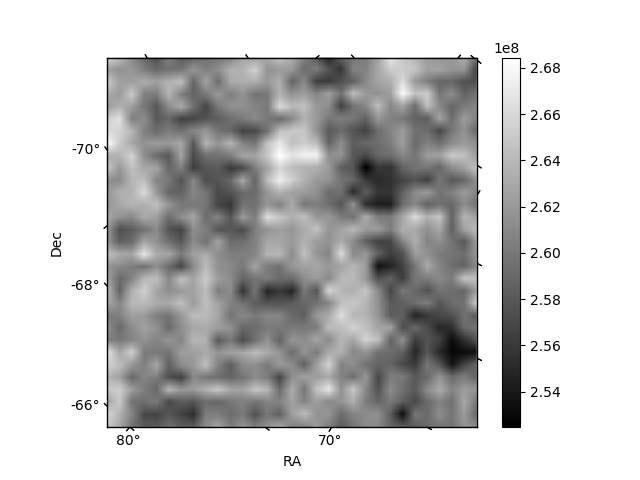
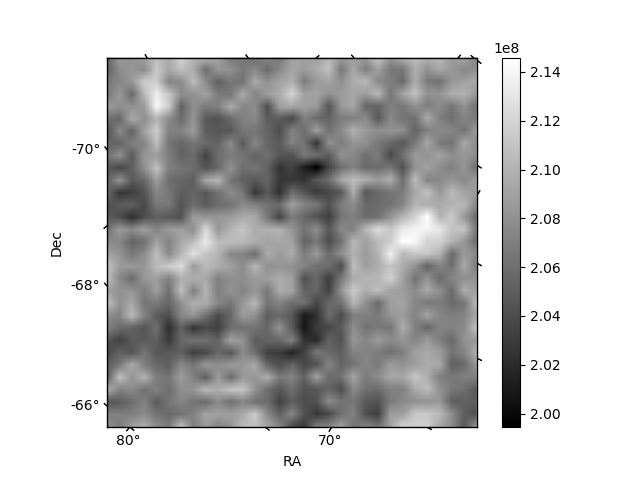
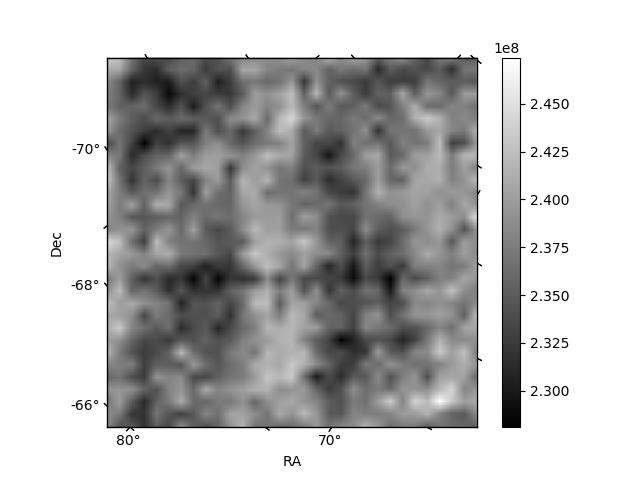
Histogram calculated using DETX and DETY for each event in the final _common_clean file
| Quadrant A | 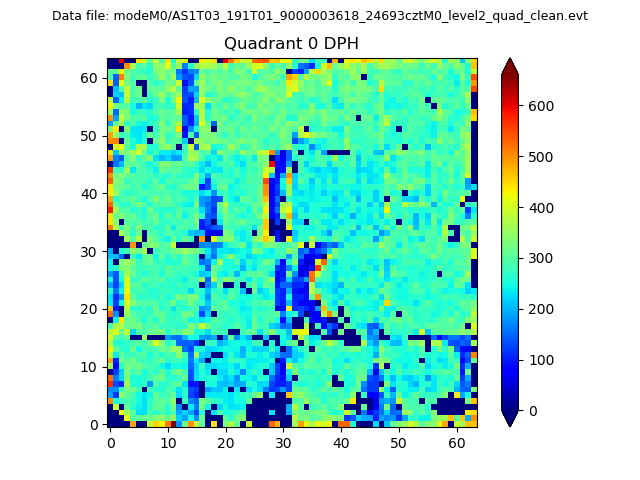 |
 |
Quadrant B |
|---|---|---|---|
| Quadrant D |  |
 |
Quadrant C |
| Plot type | Count rate plots | Images |
|---|---|---|
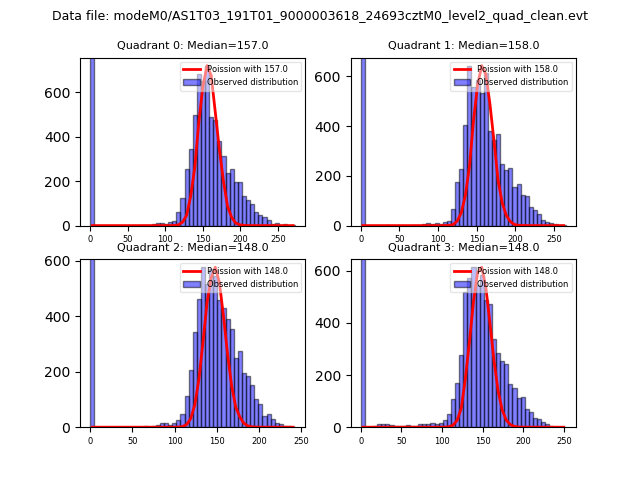
| Comparison with Poisson distribution Blue bars denote a histogram of data divided into 1 sec bins. Red curve is a Poisson curve with rate = median count rate of data. |
 |
 |
| Quadrant-wise count rates Data is divided into 100 sec bins |
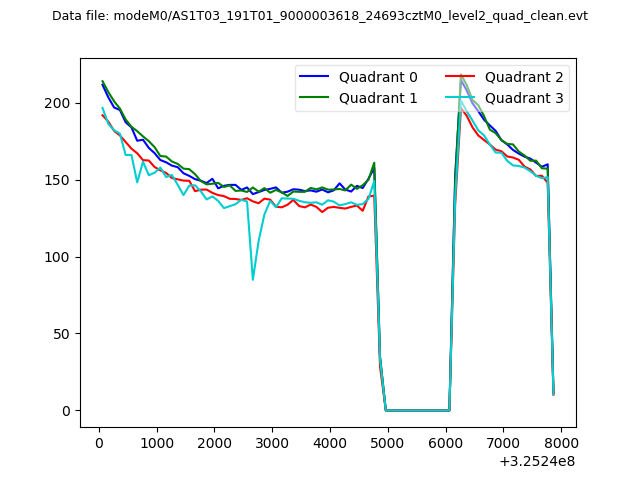 |
|
| Module-wise count rates for Quadrant A Data is divided into 100 sec bins |
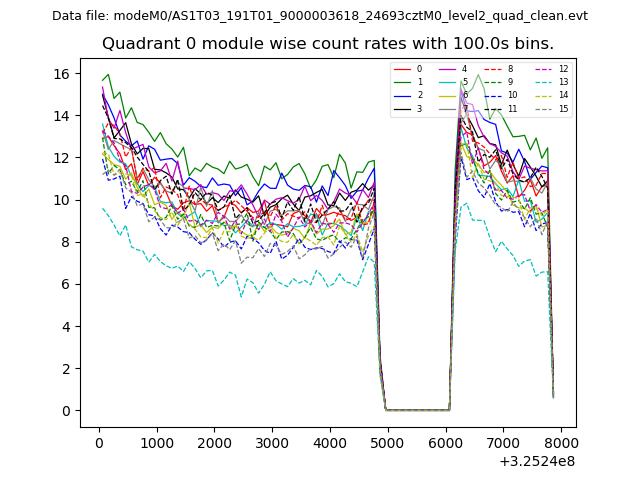 |
 |
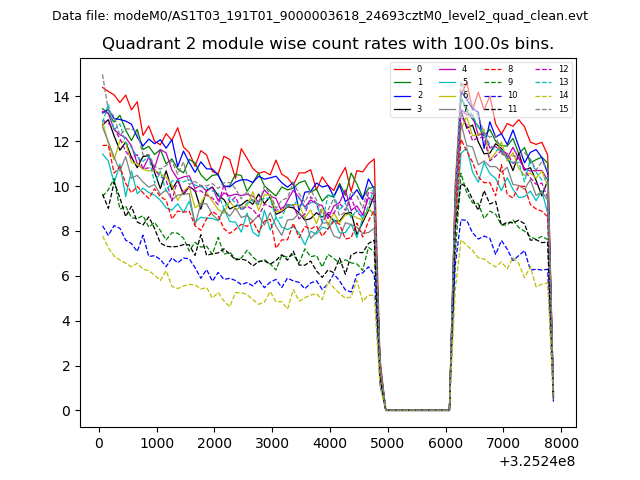
| Module-wise count rates for Quadrant B Data is divided into 100 sec bins |
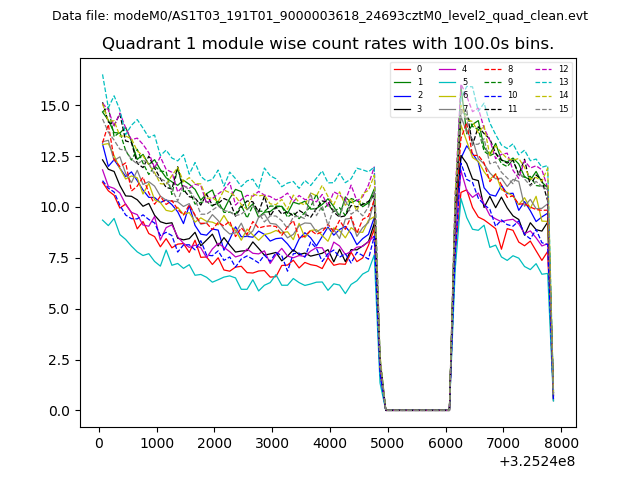 |
 |
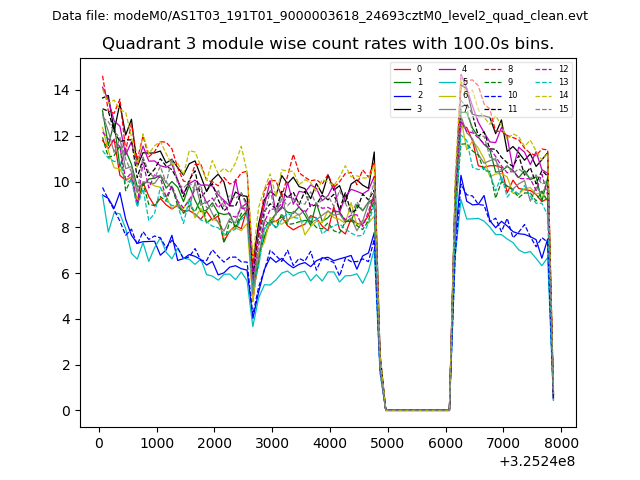
| Module-wise count rates for Quadrant C Data is divided into 100 sec bins |
 |
 |
| Module-wise count rates for Quadrant D Data is divided into 100 sec bins |
 |
 |
| Parameter | Plot |
|---|---|
| CZT HV Monitor | 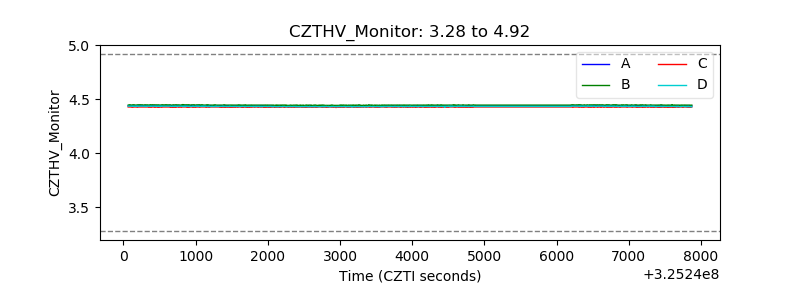 |
| D_VDD |  |
| Temperature 1 |  |
| Veto HV Monitor | 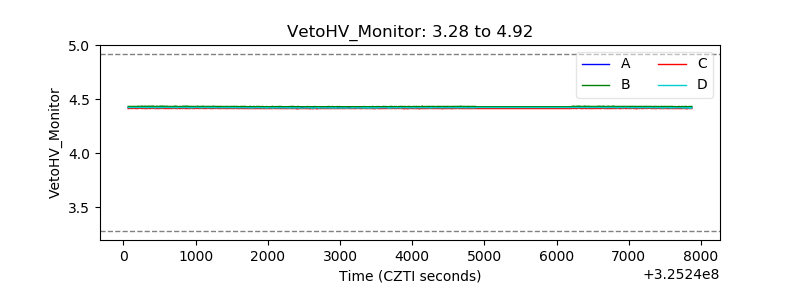 |
| Veto LLD | 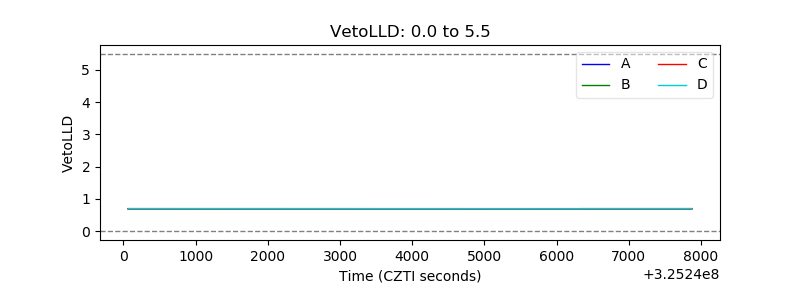 |
| Alpha Counter | 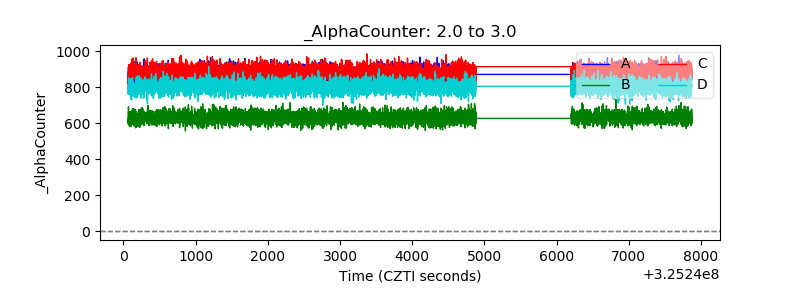 |
| _CPM_Rate | 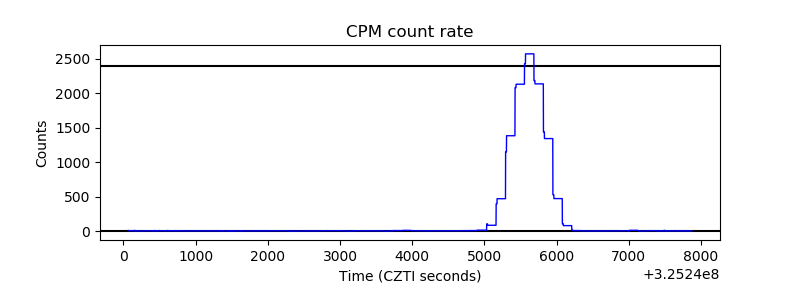 |
| CZT Counter | 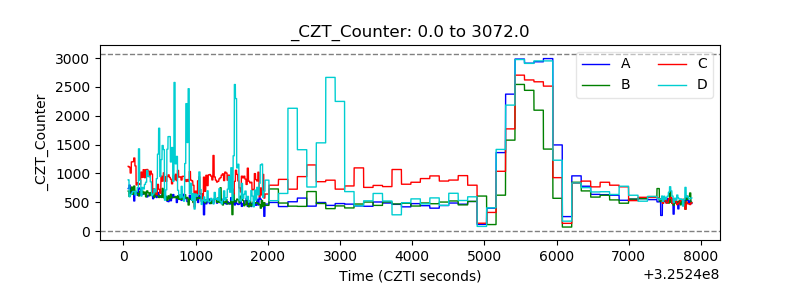 |
| +2.5 Volts monitor |  |
| +5 Volts monitor |  |
| _ROLL_ROT | 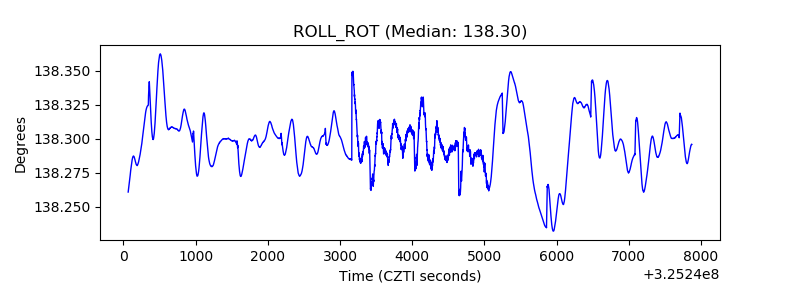 |
| _Roll_DEC | 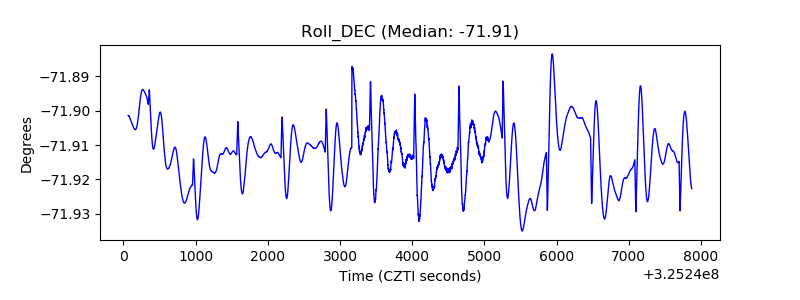 |
| _Roll_RA | 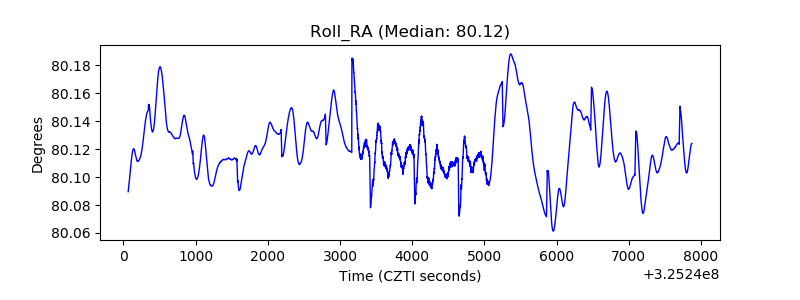 |
| Veto Counter | 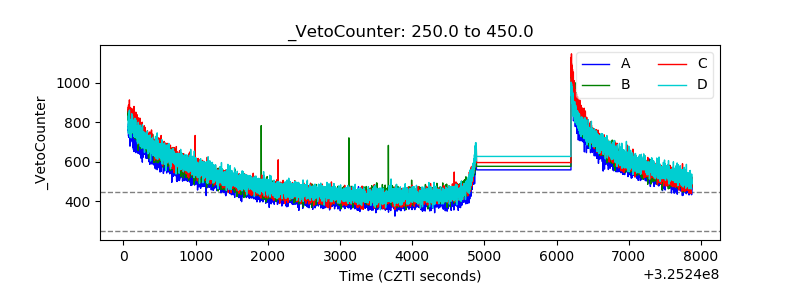 |