| Param | Original file | Final file |
|---|---|---|
| Filename | modeM0/AS1T03_191T01_9000003618_24694cztM0_level2.evt | modeM0/AS1T03_191T01_9000003618_24694cztM0_level2_quad_clean.evt |
| Size (bytes) | 550,641,600 | 139,265,280 |
| Size | 525.1 MB | 132.8 MB |
| Events in quadrant A | 3,262,036 | 992,850 |
| Events in quadrant B | 3,604,105 | 985,555 |
| Events in quadrant C | 3,448,988 | 935,064 |
| Events in quadrant D | 5,937,747 | 868,455 |
| Mode M9 | |||
|---|---|---|---|
| Quadrant | BADHDUFLAG | Total packets | Discarded packets |
| A | 0 | 13 | 0 |
| B | 0 | 13 | 0 |
| C | 0 | 13 | 0 |
| D | 0 | 13 | 0 |
| Mode M0 | |||
|---|---|---|---|
| Quadrant | BADHDUFLAG | Total packets | Discarded packets |
| A | 0 | 13550 | 1 |
| B | 0 | 14607 | 1 |
| C | 0 | 14267 | 1 |
| D | 0 | 21990 | 1 |
| Mode SS | |||
|---|---|---|---|
| Quadrant | BADHDUFLAG | Total packets | Discarded packets |
| A | 0 | 128 | 0 |
| B | 0 | 128 | 0 |
| C | 0 | 128 | 0 |
| D | 0 | 128 | 0 |
| Quadrant | Total seconds | Saturated seconds | Saturation percentage |
|---|---|---|---|
| A | 6242 | 74 | 1.185517% |
| B | 6242 | 95 | 1.521948% |
| C | 6243 | 103 | 1.649848% |
| D | 6243 | 904 | 14.480218% |
Noise dominated data is calculated using 1-second bins in cleaned event files. If a bin has >2000 counts, and if more than 50% of those come from <1% of pixels, then it is considered to be noise-dominated and hence unusable.
| Quadrant | # 1 sec bins | Bins with >0 counts | Bins with >2000 counts | High rate bins dominated by noise | Noise dominated (total time) | Noise dominated (detector-on time) | Marked lightcurve |
|---|---|---|---|---|---|---|---|
| A | 7557 | 6242 | 0 | 0 | 0.00% | 0.00% | 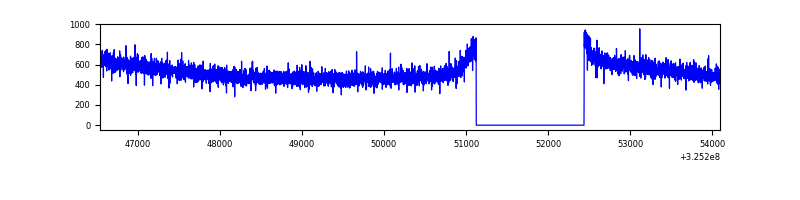 |
| B | 7557 | 6242 | 10 | 10 | 0.13% | 0.16% | 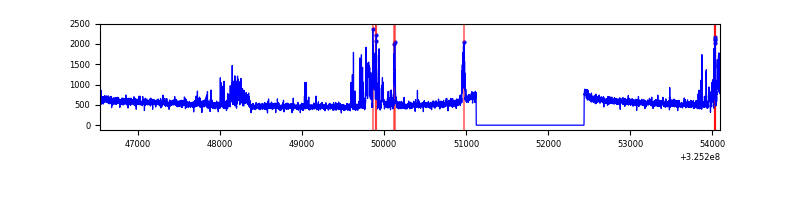 |
| C | 7558 | 6243 | 0 | 0 | 0.00% | 0.00% | 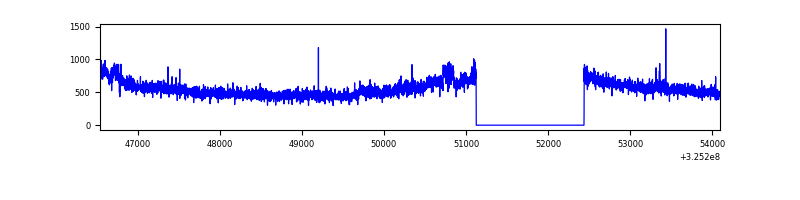 |
| D | 7557 | 6243 | 772 | 772 | 10.22% | 12.37% | 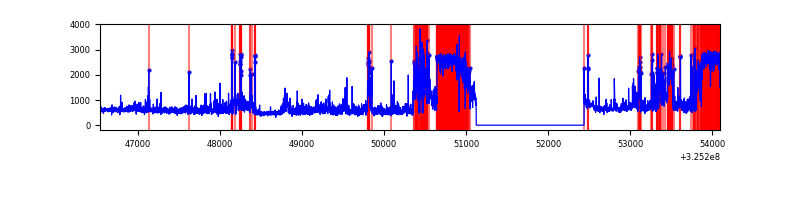 |
Top three noisy pixels from each quadrant. If the there are fewer than three noisy pixels in the level2.evt file, extra rows are filled as -1
| Pixel properties | Quadrant properties | ||||||
|---|---|---|---|---|---|---|---|
| Quadrant | DetID | PixID | Counts | Sigma | Mean | Median | Sigma |
| A | 13 | 254 | 10286 | 56.42 | 845 | 830 | 167.6 |
| A | 0 | 226 | 7454 | 39.53 | 845 | 830 | 167.6 |
| A | 3 | 137 | 6767 | 35.43 | 845 | 830 | 167.6 |
| B | 4 | 80 | 300996 | 1976.84 | 819 | 803 | 151.9 |
| B | 0 | 190 | 83579 | 545.1 | 819 | 803 | 151.9 |
| B | 0 | 189 | 23992 | 152.71 | 819 | 803 | 151.9 |
| C | 7 | 247 | 218126 | 1204.38 | 788 | 795 | 180.5 |
| C | 14 | 238 | 131042 | 721.79 | 788 | 795 | 180.5 |
| C | 4 | 175 | 11969 | 61.92 | 788 | 795 | 180.5 |
| D | 1 | 52 | 2387715 | 12924.28 | 769 | 748 | 184.7 |
| D | 8 | 195 | 519957 | 2811.27 | 769 | 748 | 184.7 |
| D | 12 | 233 | 37667 | 199.9 | 769 | 748 | 184.7 |
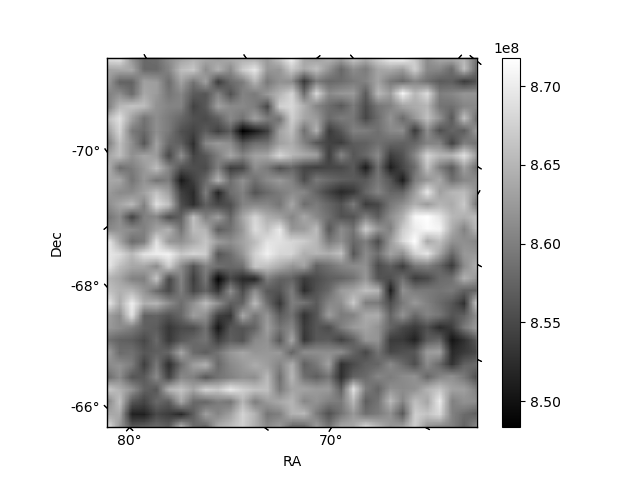
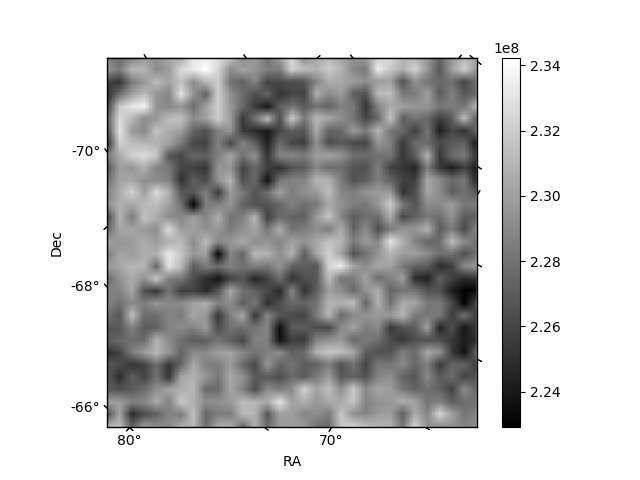
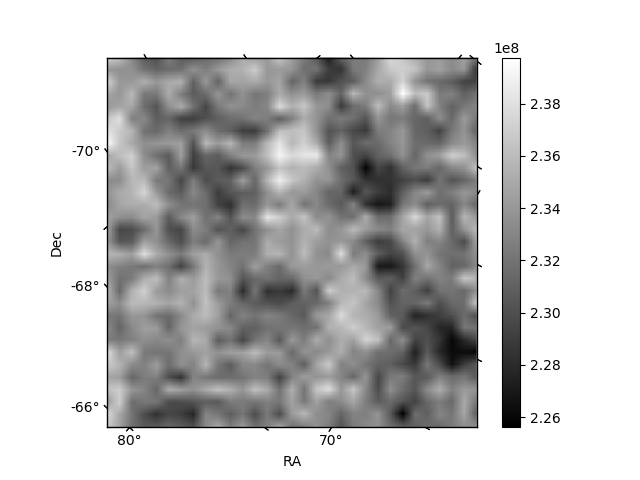
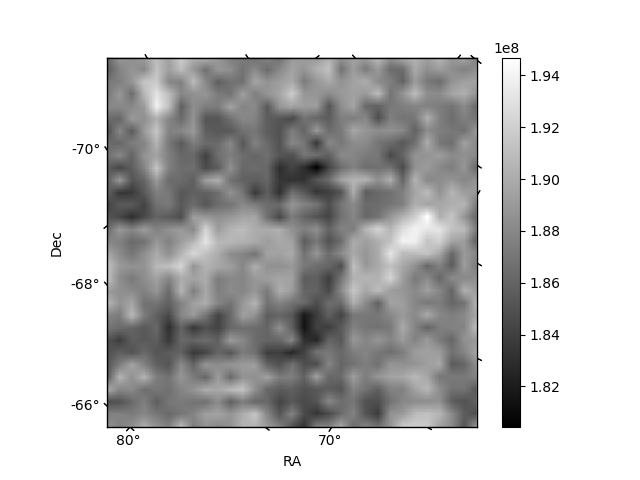
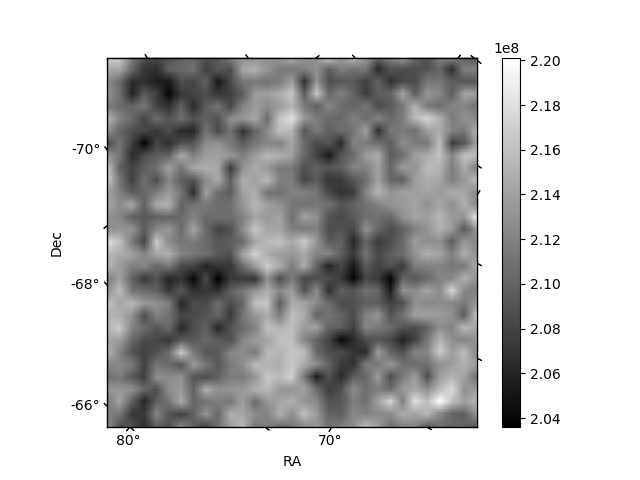
Histogram calculated using DETX and DETY for each event in the final _common_clean file
| Quadrant A | 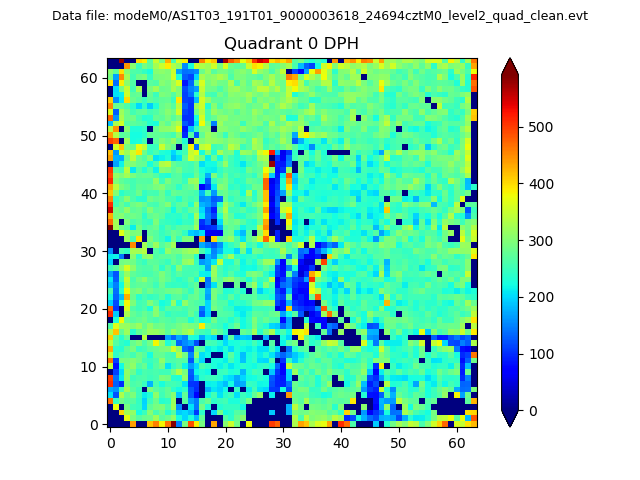 |
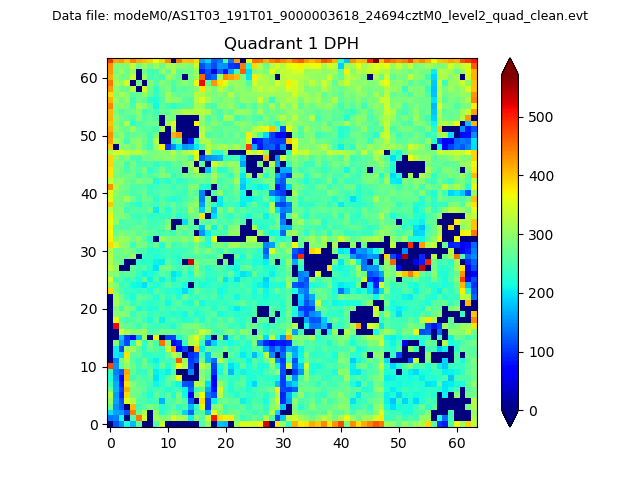 |
Quadrant B |
|---|---|---|---|
| Quadrant D | 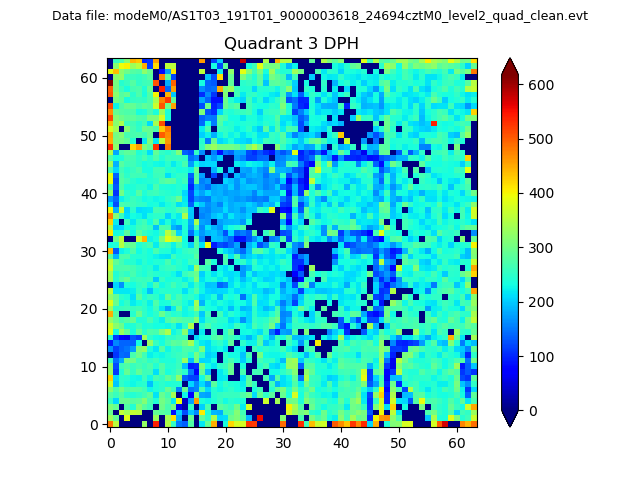 |
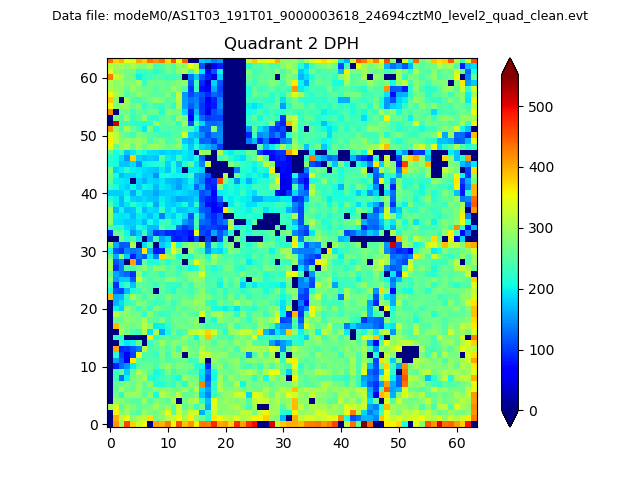 |
Quadrant C |
| Plot type | Count rate plots | Images |
|---|---|---|
| Comparison with Poisson distribution Blue bars denote a histogram of data divided into 1 sec bins. Red curve is a Poisson curve with rate = median count rate of data. |
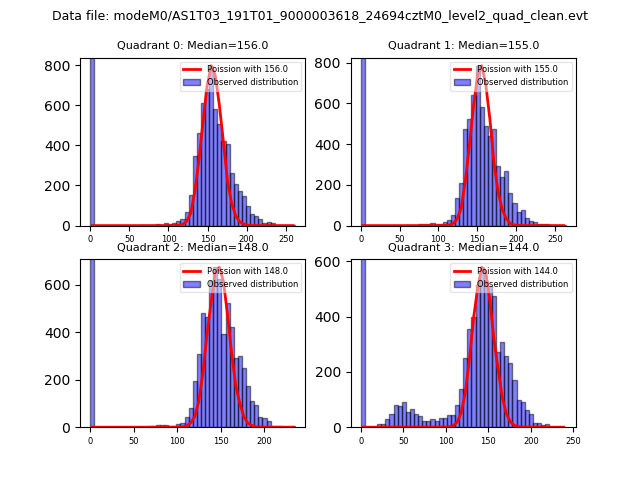 |
 |
| Quadrant-wise count rates Data is divided into 100 sec bins |
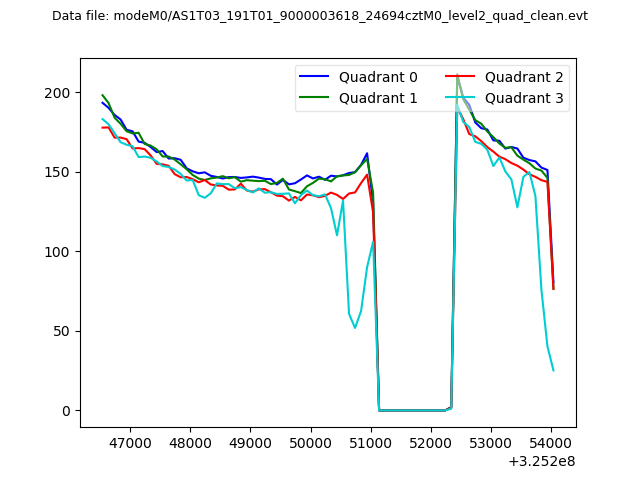 |
|
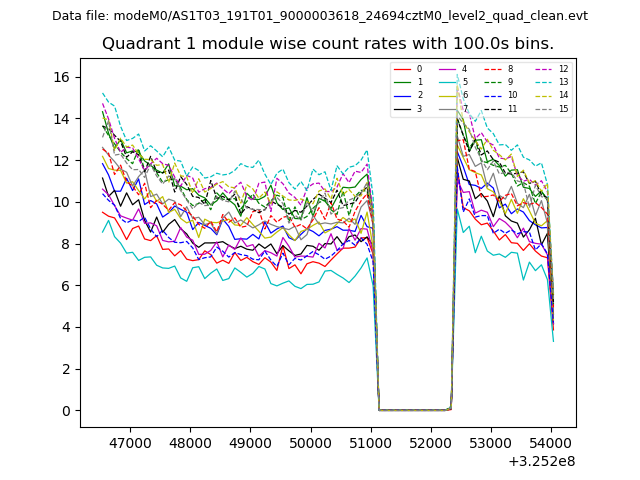
| Module-wise count rates for Quadrant A Data is divided into 100 sec bins |
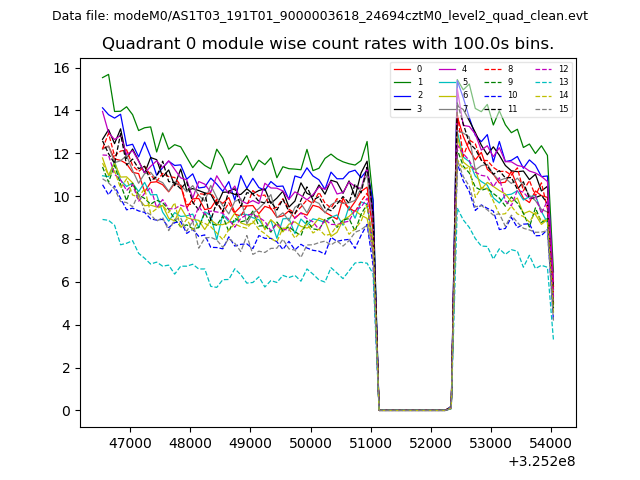 |
 |
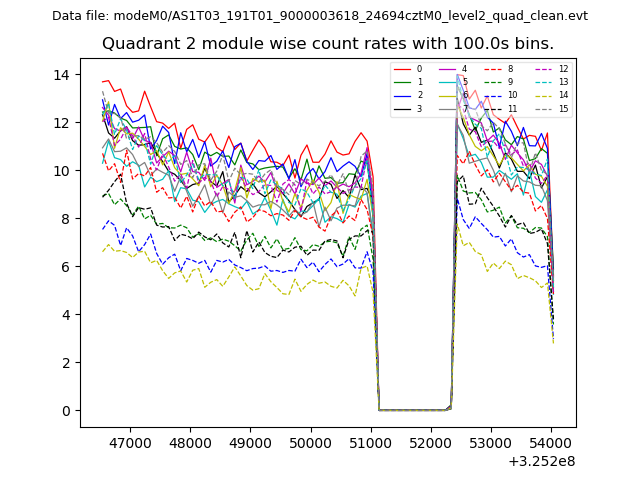
| Module-wise count rates for Quadrant B Data is divided into 100 sec bins |
 |
 |
| Module-wise count rates for Quadrant C Data is divided into 100 sec bins |
 |
 |
| Module-wise count rates for Quadrant D Data is divided into 100 sec bins |
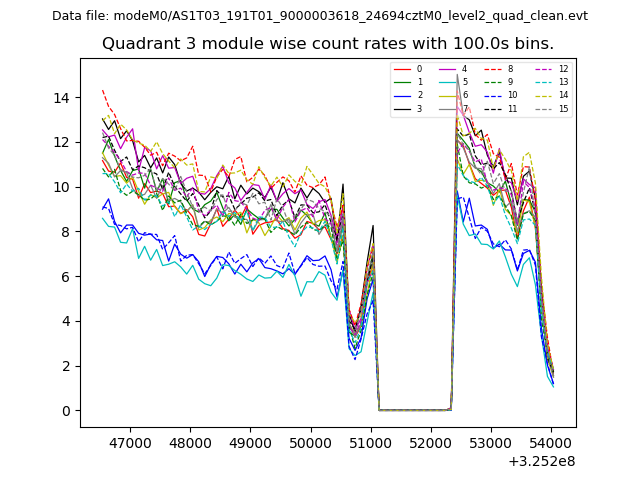 |
 |
| Parameter | Plot |
|---|---|
| CZT HV Monitor |  |
| D_VDD | 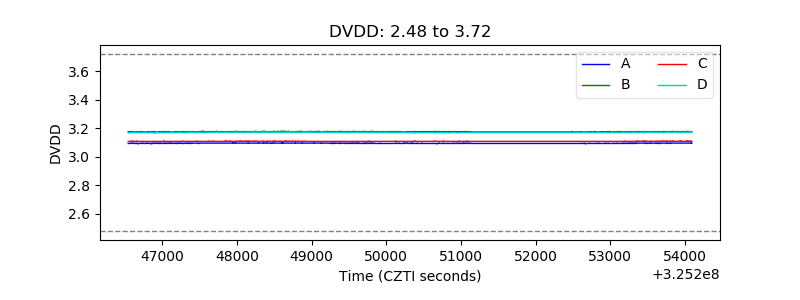 |
| Temperature 1 | 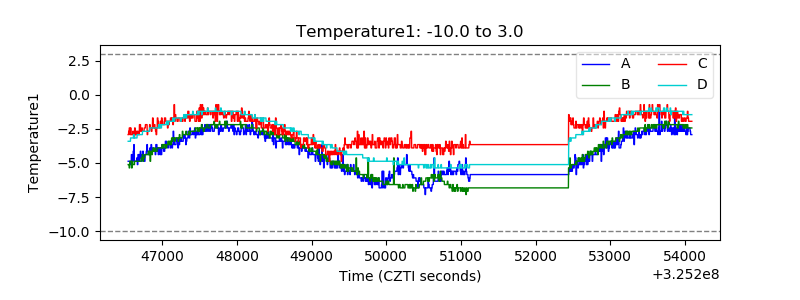 |
| Veto HV Monitor | 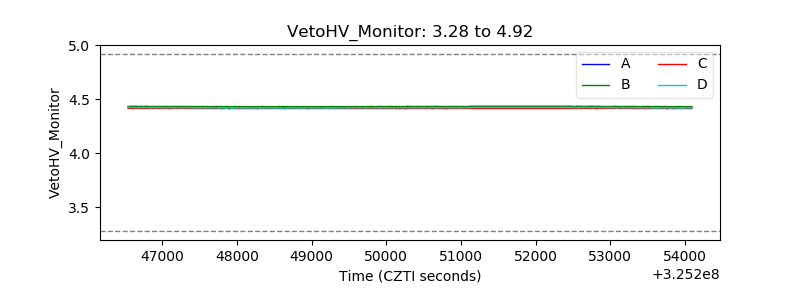 |
| Veto LLD |  |
| Alpha Counter | 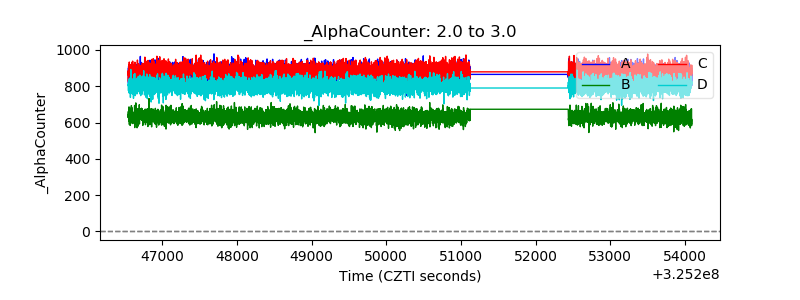 |
| _CPM_Rate | 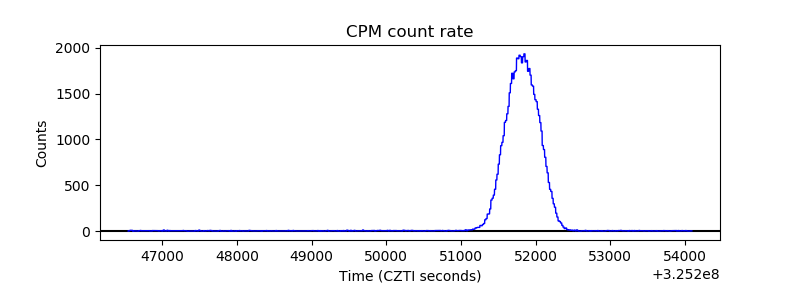 |
| CZT Counter | 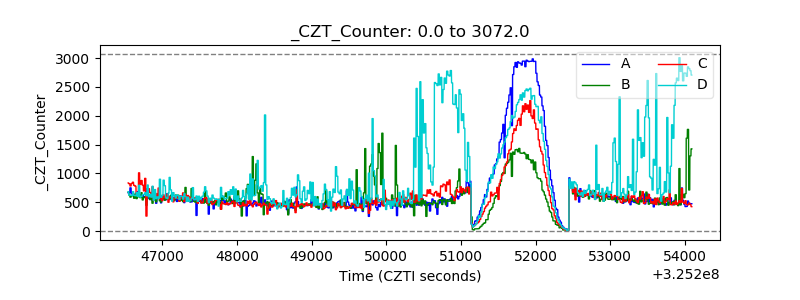 |
| +2.5 Volts monitor |  |
| +5 Volts monitor | 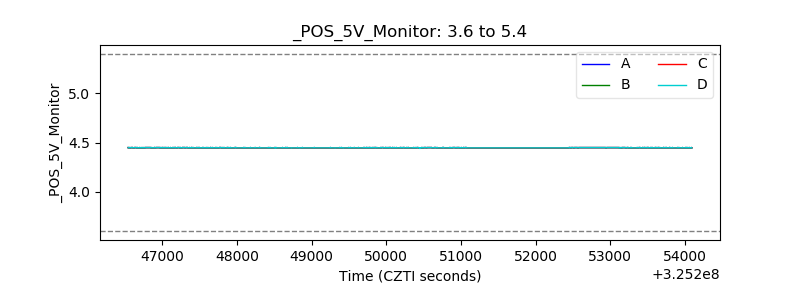 |
| _ROLL_ROT | 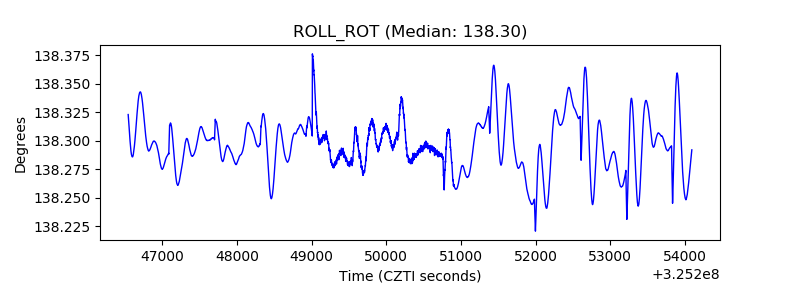 |
| _Roll_DEC | 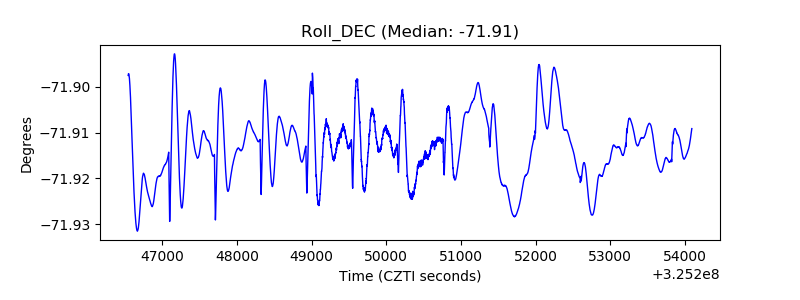 |
| _Roll_RA | 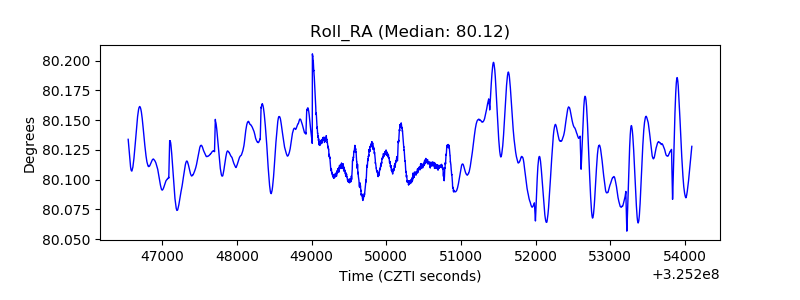 |
| Veto Counter | 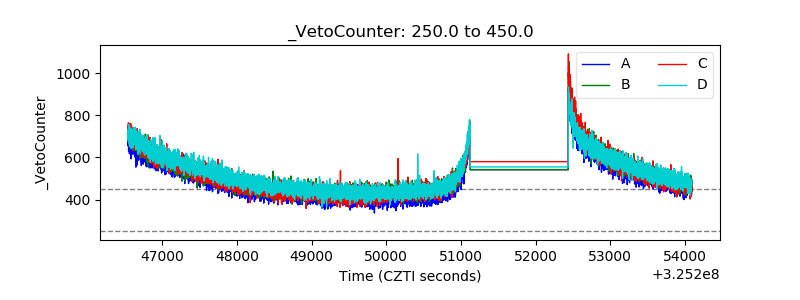 |