| Param | Original file | Final file |
|---|---|---|
| Filename | modeM0/AS1T03_191T01_9000003618_24696cztM0_level2.evt | modeM0/AS1T03_191T01_9000003618_24696cztM0_level2_quad_clean.evt |
| Size (bytes) | 507,352,320 | 130,754,880 |
| Size | 483.8 MB | 124.7 MB |
| Events in quadrant A | 3,099,640 | 908,531 |
| Events in quadrant B | 3,266,695 | 904,715 |
| Events in quadrant C | 3,644,042 | 852,427 |
| Events in quadrant D | 4,917,922 | 845,225 |
| Mode M9 | |||
|---|---|---|---|
| Quadrant | BADHDUFLAG | Total packets | Discarded packets |
| A | 0 | 10 | 0 |
| B | 0 | 10 | 0 |
| C | 0 | 10 | 0 |
| D | 0 | 10 | 0 |
| Mode M0 | |||
|---|---|---|---|
| Quadrant | BADHDUFLAG | Total packets | Discarded packets |
| A | 0 | 13272 | 1 |
| B | 0 | 13717 | 1 |
| C | 0 | 14809 | 1 |
| D | 0 | 18990 | 1 |
| Mode SS | |||
|---|---|---|---|
| Quadrant | BADHDUFLAG | Total packets | Discarded packets |
| A | 0 | 132 | 0 |
| B | 0 | 132 | 0 |
| C | 0 | 132 | 0 |
| D | 0 | 132 | 0 |
| Quadrant | Total seconds | Saturated seconds | Saturation percentage |
|---|---|---|---|
| A | 6441 | 53 | 0.822854% |
| B | 6442 | 94 | 1.459174% |
| C | 6442 | 93 | 1.443651% |
| D | 6442 | 117 | 1.816206% |
Noise dominated data is calculated using 1-second bins in cleaned event files. If a bin has >2000 counts, and if more than 50% of those come from <1% of pixels, then it is considered to be noise-dominated and hence unusable.
| Quadrant | # 1 sec bins | Bins with >0 counts | Bins with >2000 counts | High rate bins dominated by noise | Noise dominated (total time) | Noise dominated (detector-on time) | Marked lightcurve |
|---|---|---|---|---|---|---|---|
| A | 7456 | 6441 | 0 | 0 | 0.00% | 0.00% | 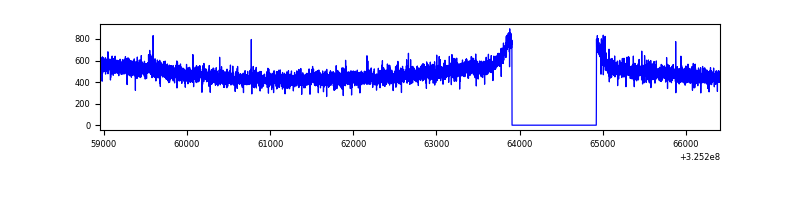 |
| B | 7457 | 6443 | 11 | 11 | 0.15% | 0.17% | 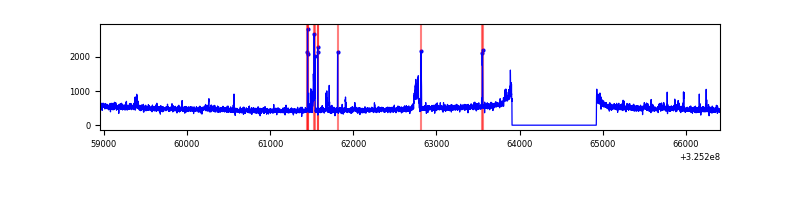 |
| C | 7457 | 6443 | 0 | 0 | 0.00% | 0.00% | 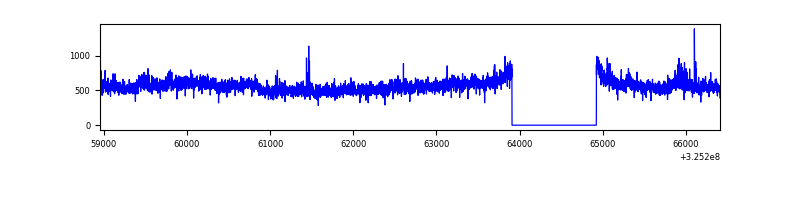 |
| D | 7457 | 6443 | 35 | 35 | 0.47% | 0.54% | 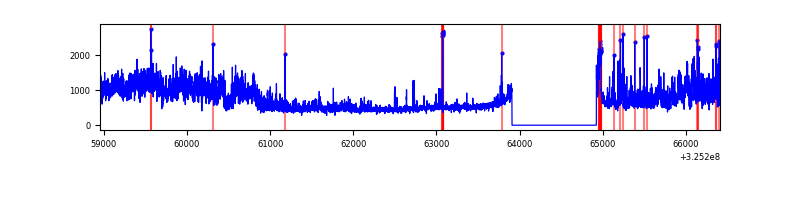 |
Top three noisy pixels from each quadrant. If the there are fewer than three noisy pixels in the level2.evt file, extra rows are filled as -1
| Pixel properties | Quadrant properties | ||||||
|---|---|---|---|---|---|---|---|
| Quadrant | DetID | PixID | Counts | Sigma | Mean | Median | Sigma |
| A | 13 | 254 | 11456 | 67.21 | 802 | 786 | 158.8 |
| A | 0 | 226 | 7090 | 39.71 | 802 | 786 | 158.8 |
| A | 3 | 137 | 6980 | 39.01 | 802 | 786 | 158.8 |
| B | 4 | 80 | 135579 | 908.78 | 788 | 772 | 148.3 |
| B | 0 | 190 | 25223 | 164.83 | 788 | 772 | 148.3 |
| B | 12 | 111 | 17514 | 112.86 | 788 | 772 | 148.3 |
| C | 7 | 247 | 551121 | 3188.85 | 749 | 754 | 172.6 |
| C | 14 | 238 | 123503 | 711.21 | 749 | 754 | 172.6 |
| C | 2 | 16 | 22785 | 127.65 | 749 | 754 | 172.6 |
| D | 8 | 195 | 1564416 | 8496.86 | 769 | 746 | 184.0 |
| D | 1 | 52 | 218159 | 1181.4 | 769 | 746 | 184.0 |
| D | 7 | 238 | 162853 | 880.87 | 769 | 746 | 184.0 |
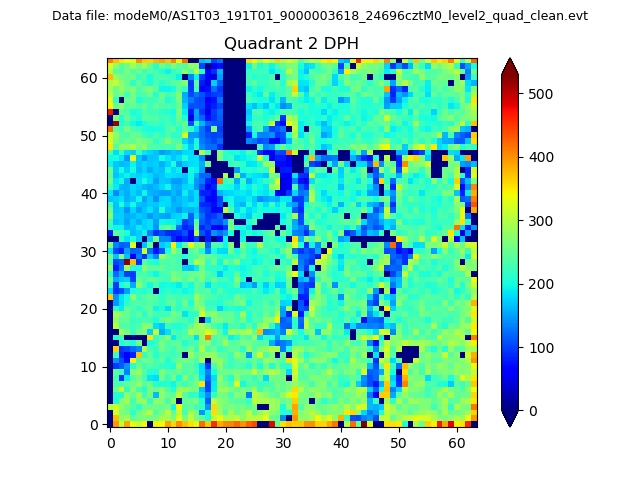
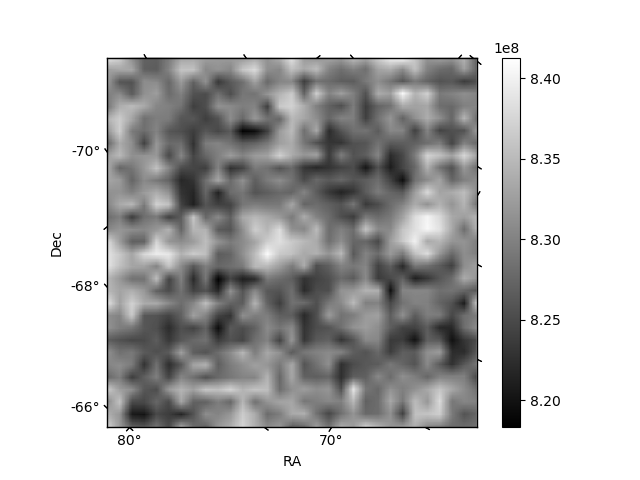
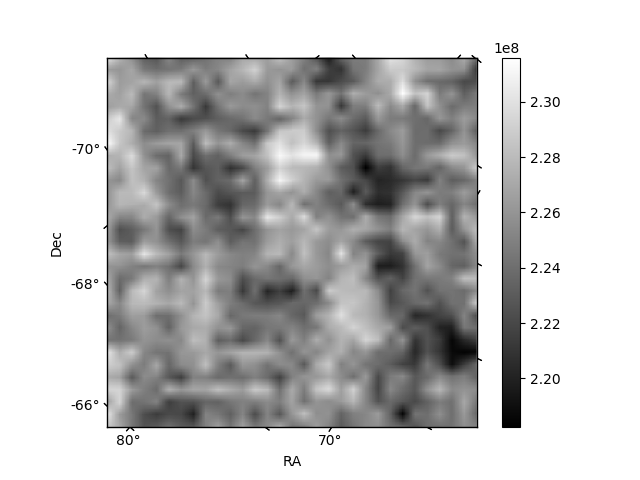
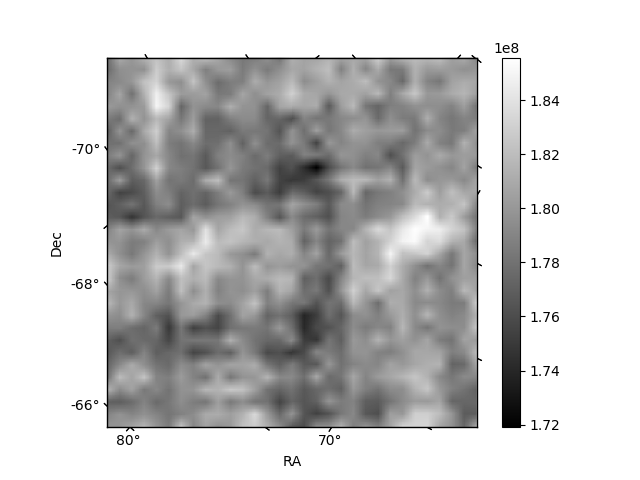
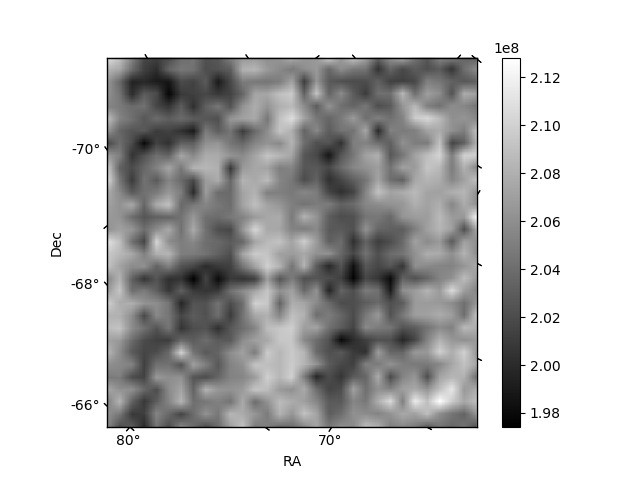
Histogram calculated using DETX and DETY for each event in the final _common_clean file
| Quadrant A | 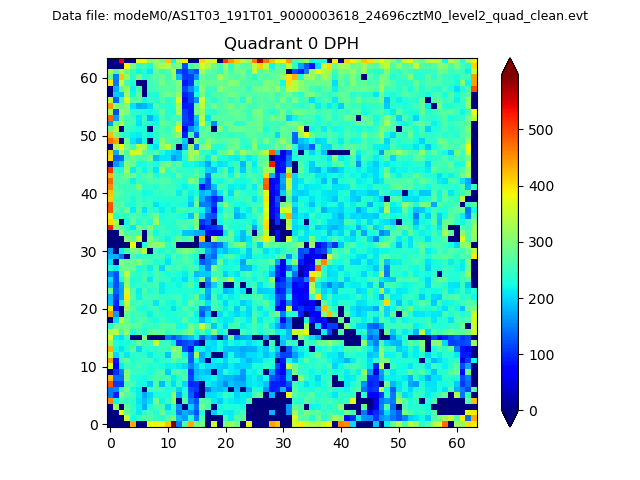 |
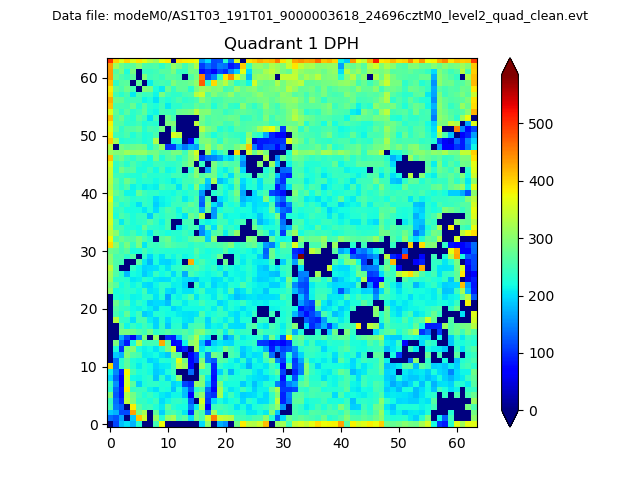 |
Quadrant B |
|---|---|---|---|
| Quadrant D | 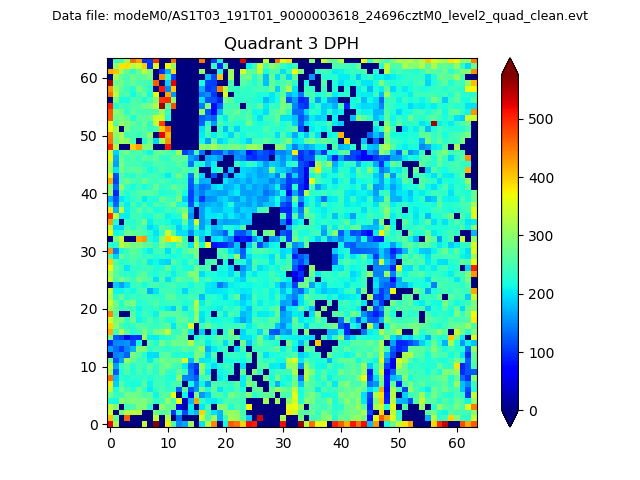 |
 |
Quadrant C |
| Plot type | Count rate plots | Images |
|---|---|---|
| Comparison with Poisson distribution Blue bars denote a histogram of data divided into 1 sec bins. Red curve is a Poisson curve with rate = median count rate of data. |
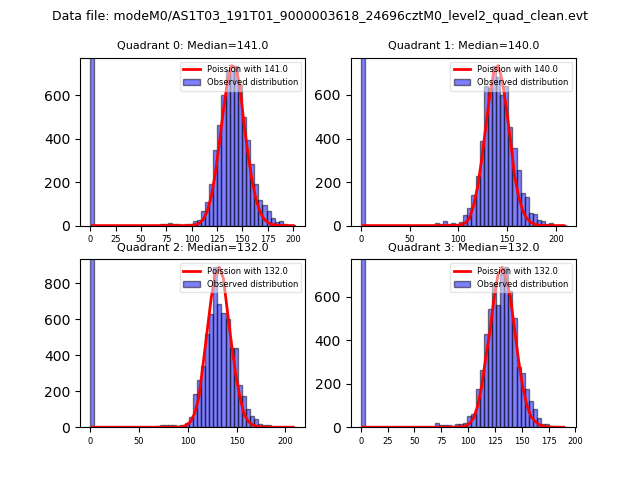 |
 |
| Quadrant-wise count rates Data is divided into 100 sec bins |
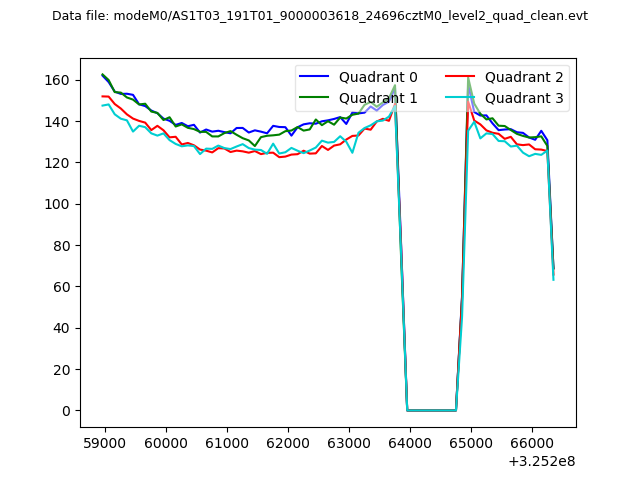 |
|
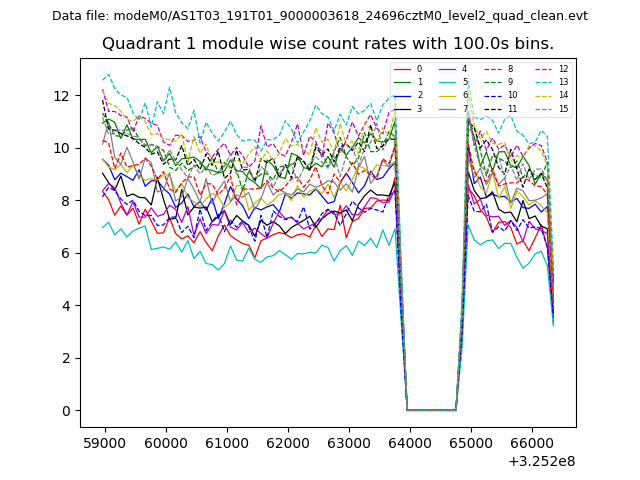
| Module-wise count rates for Quadrant A Data is divided into 100 sec bins |
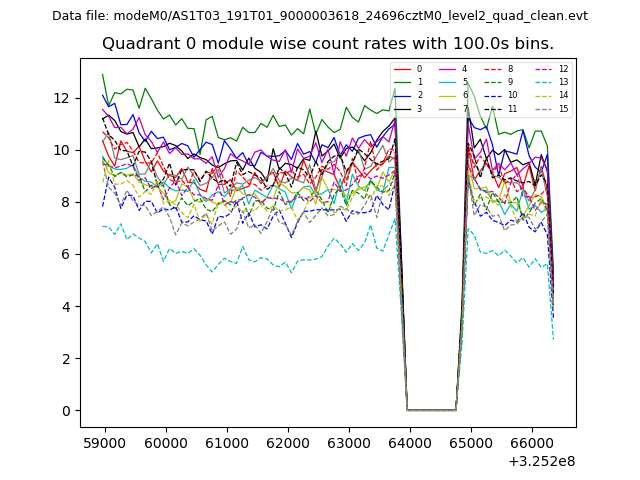 |
 |
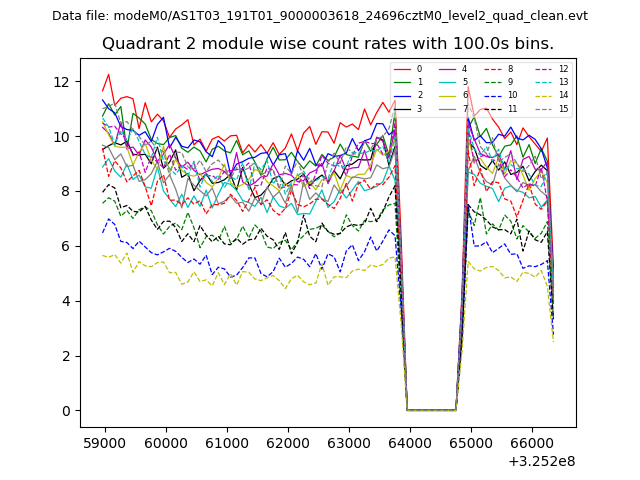
| Module-wise count rates for Quadrant B Data is divided into 100 sec bins |
 |
 |
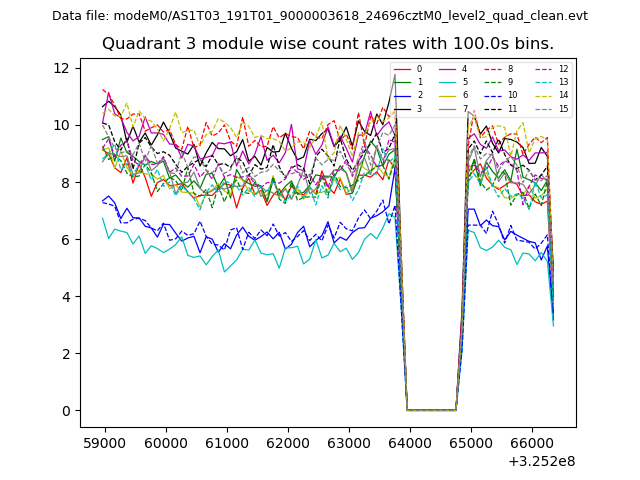
| Module-wise count rates for Quadrant C Data is divided into 100 sec bins |
 |
 |
| Module-wise count rates for Quadrant D Data is divided into 100 sec bins |
 |
 |
| Parameter | Plot |
|---|---|
| CZT HV Monitor | 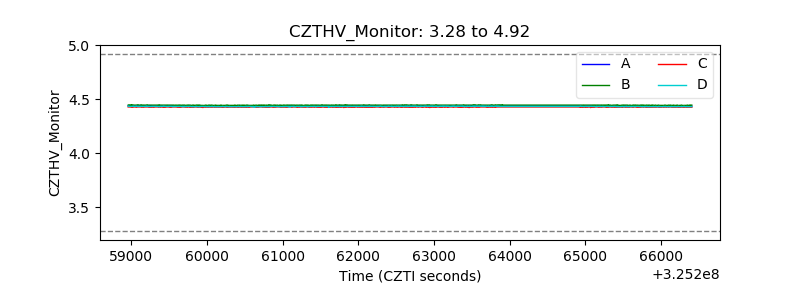 |
| D_VDD | 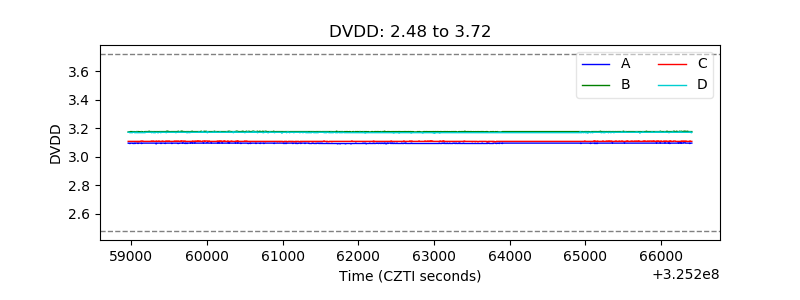 |
| Temperature 1 | 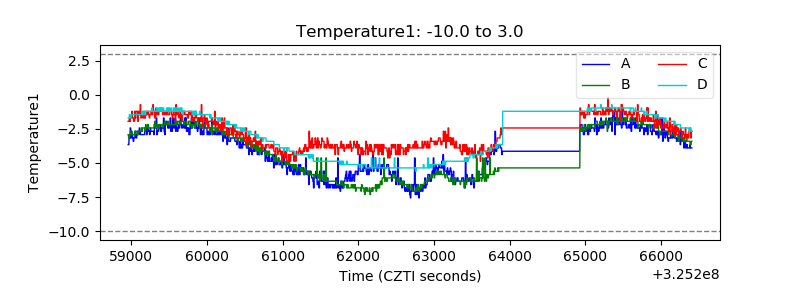 |
| Veto HV Monitor | 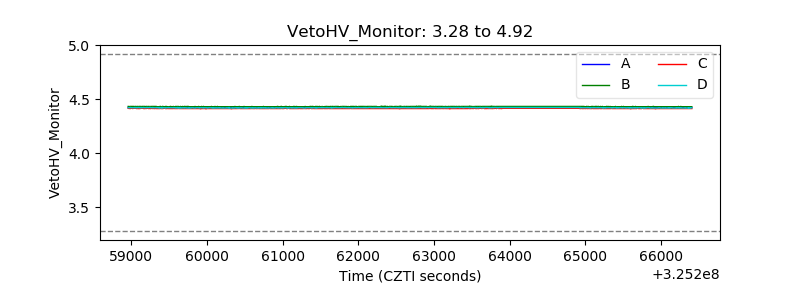 |
| Veto LLD | 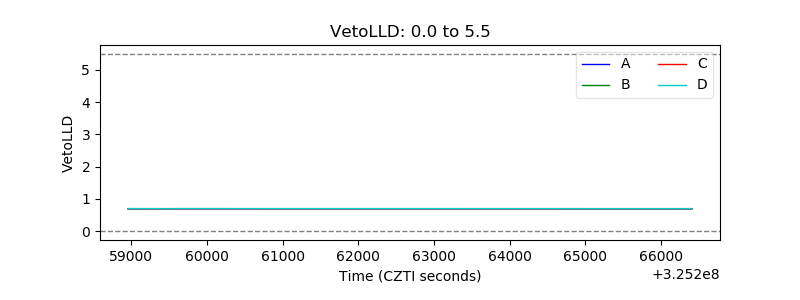 |
| Alpha Counter | 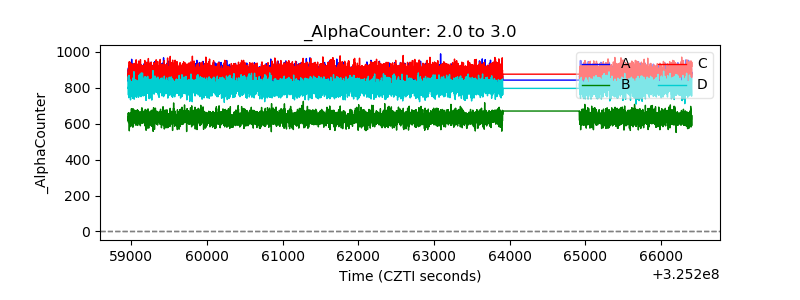 |
| _CPM_Rate | 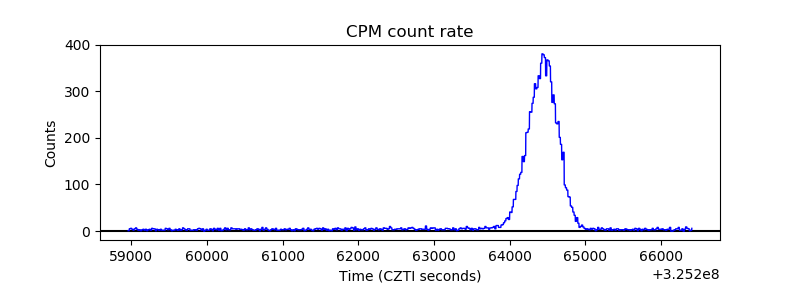 |
| CZT Counter | 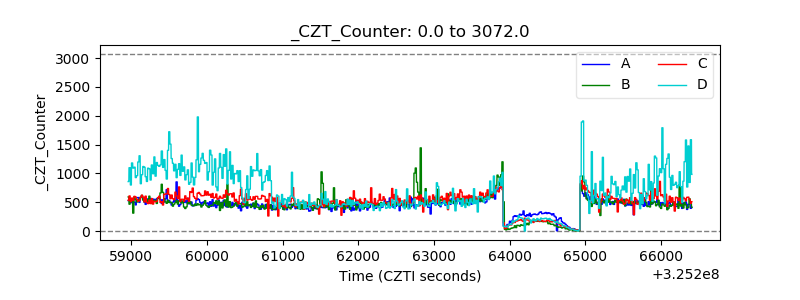 |
| +2.5 Volts monitor |  |
| +5 Volts monitor |  |
| _ROLL_ROT | 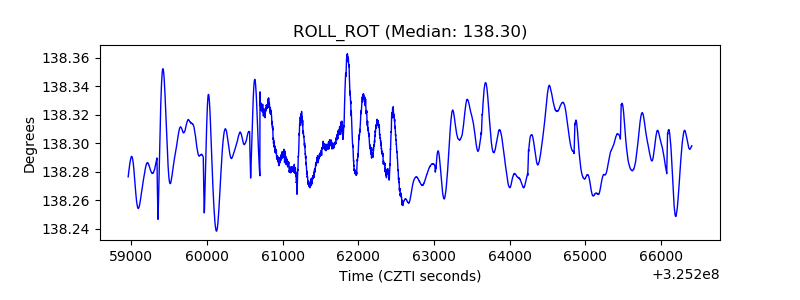 |
| _Roll_DEC | 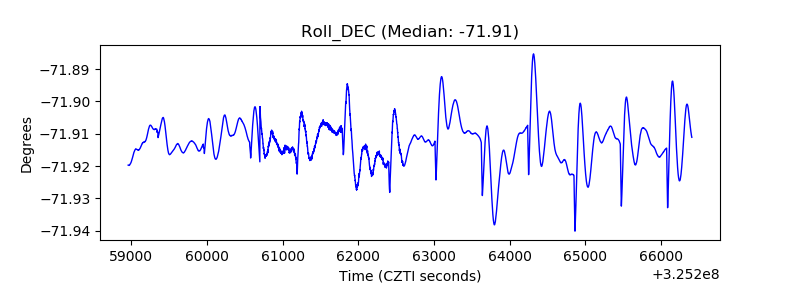 |
| _Roll_RA | 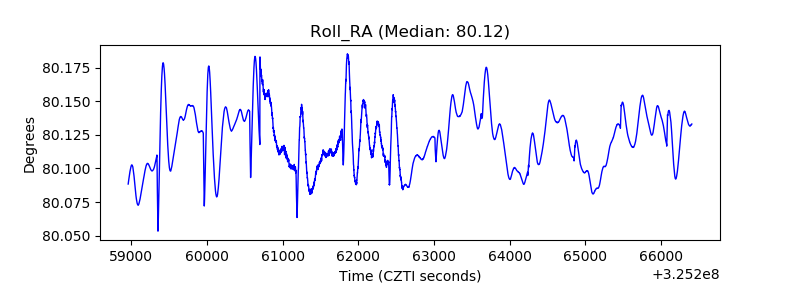 |
| Veto Counter | 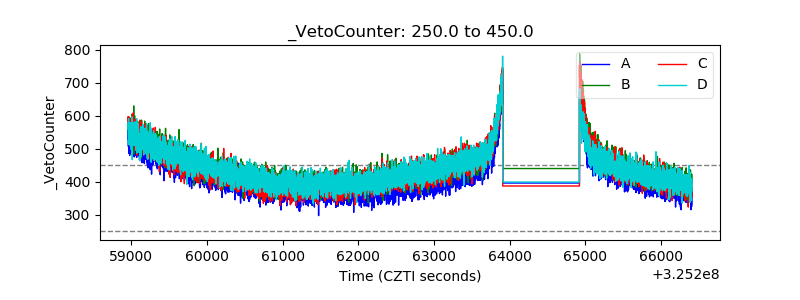 |