| Param | Original file | Final file |
|---|---|---|
| Filename | modeM0/AS1T03_191T01_9000003618_24697cztM0_level2.evt | modeM0/AS1T03_191T01_9000003618_24697cztM0_level2_quad_clean.evt |
| Size (bytes) | 568,445,760 | 134,377,920 |
| Size | 542.1 MB | 128.2 MB |
| Events in quadrant A | 3,257,399 | 929,112 |
| Events in quadrant B | 3,332,984 | 931,331 |
| Events in quadrant C | 4,201,326 | 876,019 |
| Events in quadrant D | 5,954,879 | 851,365 |
| Mode M9 | |||
|---|---|---|---|
| Quadrant | BADHDUFLAG | Total packets | Discarded packets |
| A | 0 | 7 | 0 |
| B | 0 | 7 | 0 |
| C | 0 | 7 | 0 |
| D | 0 | 7 | 0 |
| Mode M0 | |||
|---|---|---|---|
| Quadrant | BADHDUFLAG | Total packets | Discarded packets |
| A | 0 | 14195 | 2 |
| B | 0 | 14368 | 2 |
| C | 0 | 17086 | 2 |
| D | 0 | 22620 | 2 |
| Mode SS | |||
|---|---|---|---|
| Quadrant | BADHDUFLAG | Total packets | Discarded packets |
| A | 0 | 142 | 0 |
| B | 0 | 142 | 0 |
| C | 0 | 142 | 0 |
| D | 0 | 142 | 0 |
| Quadrant | Total seconds | Saturated seconds | Saturation percentage |
|---|---|---|---|
| A | 6921 | 65 | 0.939171% |
| B | 6922 | 73 | 1.054608% |
| C | 6921 | 132 | 1.907239% |
| D | 6921 | 462 | 6.675336% |
Noise dominated data is calculated using 1-second bins in cleaned event files. If a bin has >2000 counts, and if more than 50% of those come from <1% of pixels, then it is considered to be noise-dominated and hence unusable.
| Quadrant | # 1 sec bins | Bins with >0 counts | Bins with >2000 counts | High rate bins dominated by noise | Noise dominated (total time) | Noise dominated (detector-on time) | Marked lightcurve |
|---|---|---|---|---|---|---|---|
| A | 7566 | 6921 | 0 | 0 | 0.00% | 0.00% | 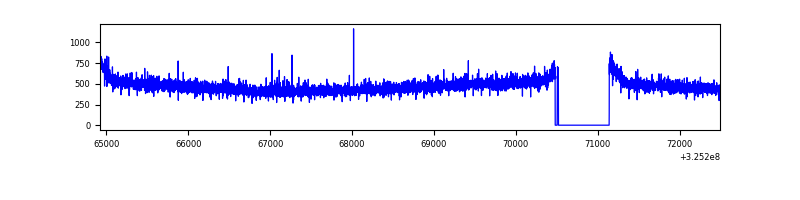 |
| B | 7567 | 6923 | 0 | 0 | 0.00% | 0.00% | 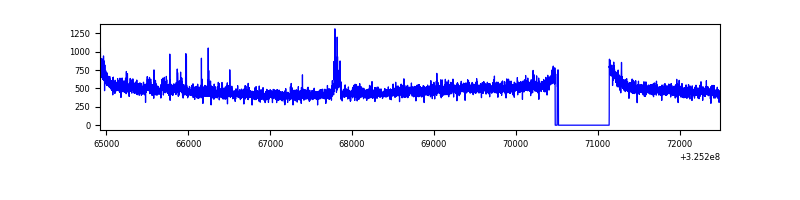 |
| C | 7566 | 6922 | 1 | 1 | 0.01% | 0.01% | 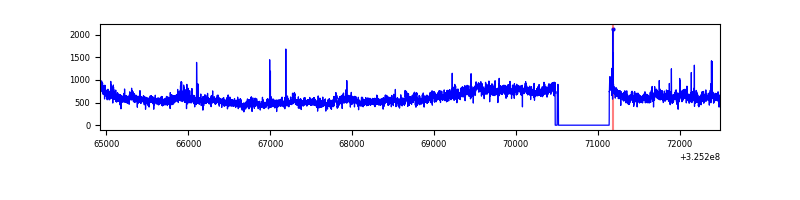 |
| D | 7566 | 6922 | 191 | 191 | 2.52% | 2.76% | 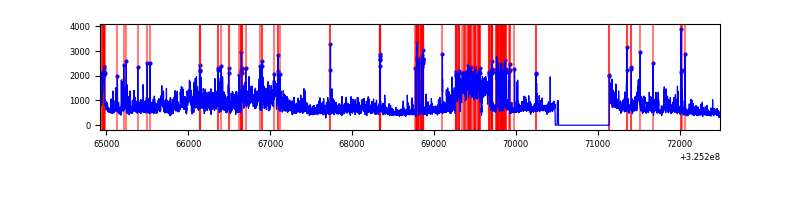 |
Top three noisy pixels from each quadrant. If the there are fewer than three noisy pixels in the level2.evt file, extra rows are filled as -1
| Pixel properties | Quadrant properties | ||||||
|---|---|---|---|---|---|---|---|
| Quadrant | DetID | PixID | Counts | Sigma | Mean | Median | Sigma |
| A | 13 | 254 | 12025 | 66.78 | 842 | 826 | 167.7 |
| A | 10 | 255 | 8696 | 46.93 | 842 | 826 | 167.7 |
| A | 3 | 137 | 7653 | 40.71 | 842 | 826 | 167.7 |
| B | 0 | 190 | 26588 | 166.36 | 829 | 809 | 155.0 |
| B | 4 | 80 | 24044 | 149.94 | 829 | 809 | 155.0 |
| B | 0 | 189 | 19618 | 121.38 | 829 | 809 | 155.0 |
| C | 7 | 247 | 763053 | 4178.39 | 792 | 796 | 182.4 |
| C | 10 | 91 | 133904 | 729.64 | 792 | 796 | 182.4 |
| C | 14 | 238 | 127902 | 696.74 | 792 | 796 | 182.4 |
| D | 8 | 195 | 1314405 | 6743.54 | 799 | 775 | 194.8 |
| D | 1 | 52 | 1047868 | 5375.27 | 799 | 775 | 194.8 |
| D | 7 | 238 | 436708 | 2237.87 | 799 | 775 | 194.8 |
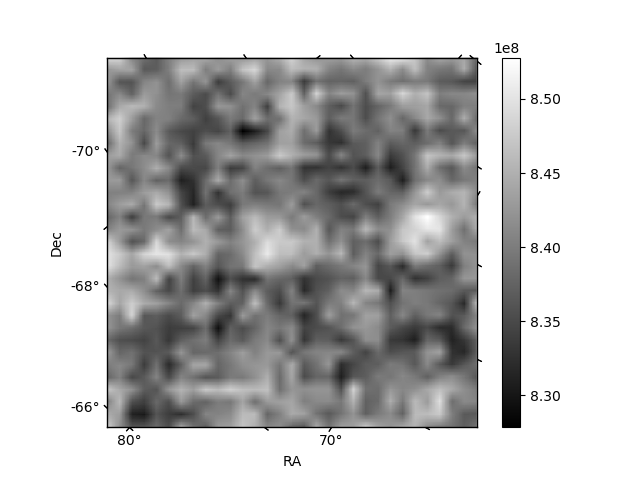
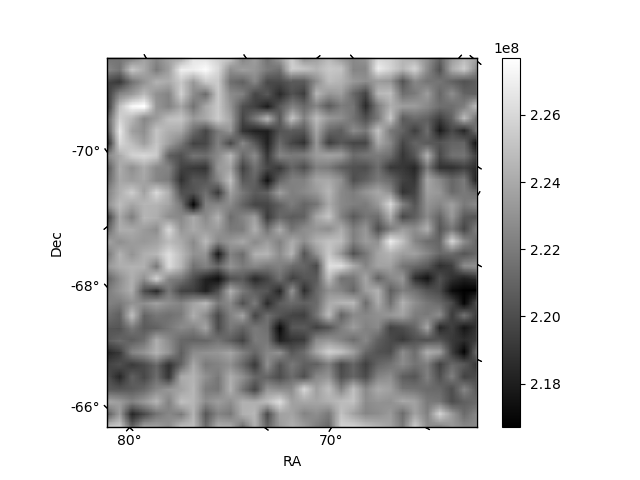
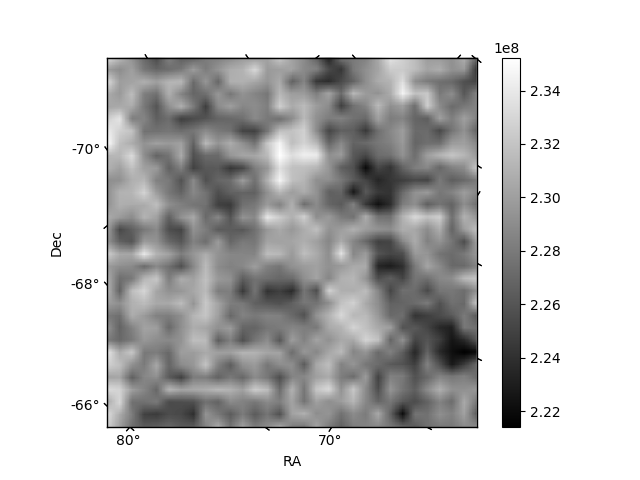
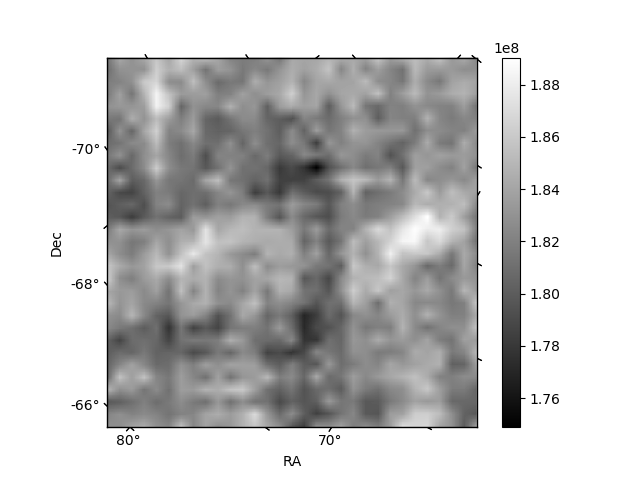
Histogram calculated using DETX and DETY for each event in the final _common_clean file
| Quadrant A |  |
 |
Quadrant B |
|---|---|---|---|
| Quadrant D |  |
 |
Quadrant C |
| Plot type | Count rate plots | Images |
|---|---|---|
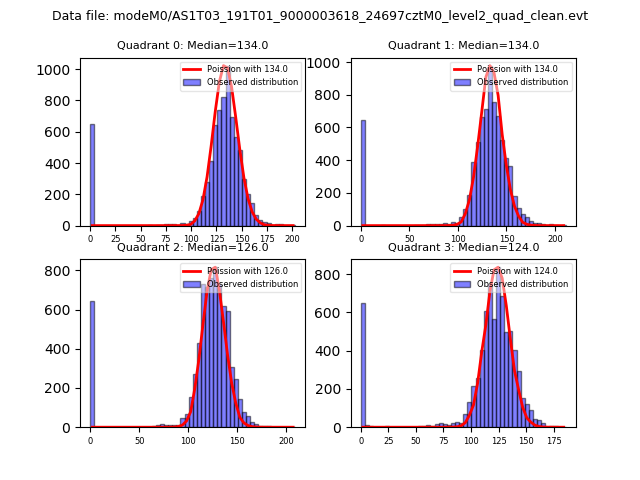
| Comparison with Poisson distribution Blue bars denote a histogram of data divided into 1 sec bins. Red curve is a Poisson curve with rate = median count rate of data. |
 |
 |
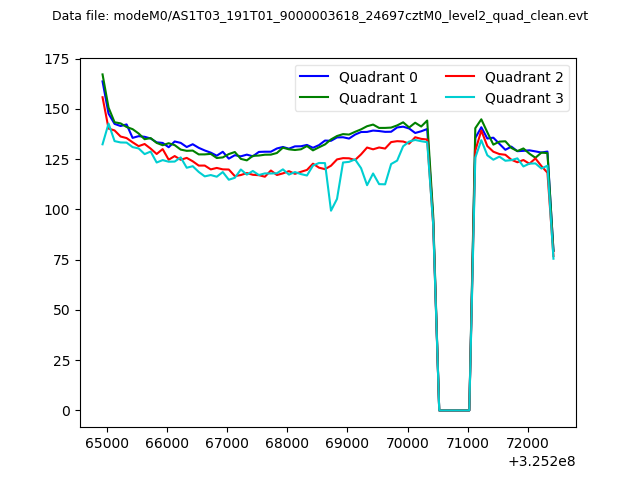
| Quadrant-wise count rates Data is divided into 100 sec bins |
 |
|
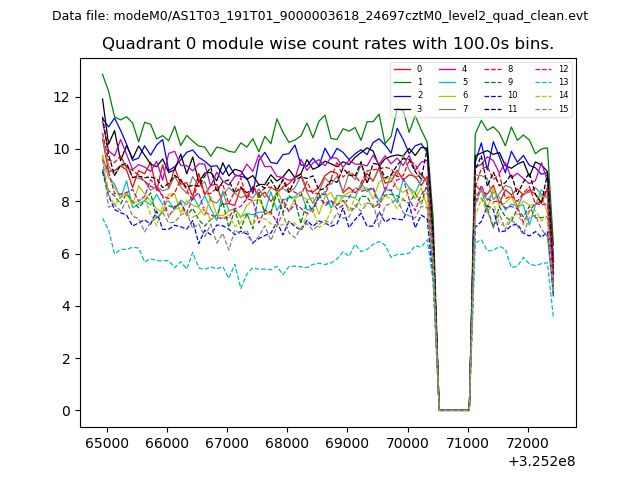
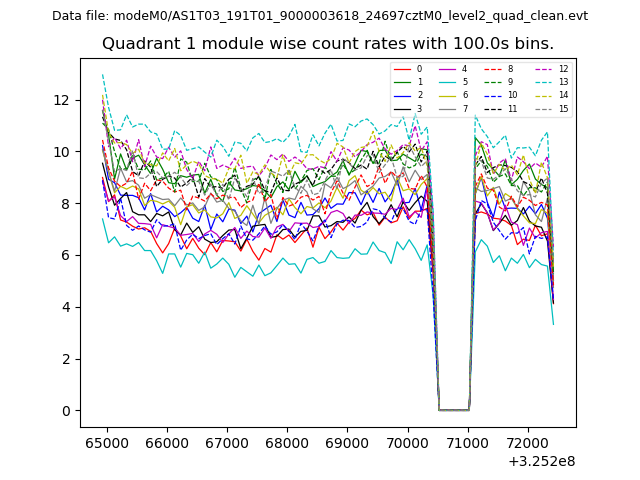
| Module-wise count rates for Quadrant A Data is divided into 100 sec bins |
 |
 |
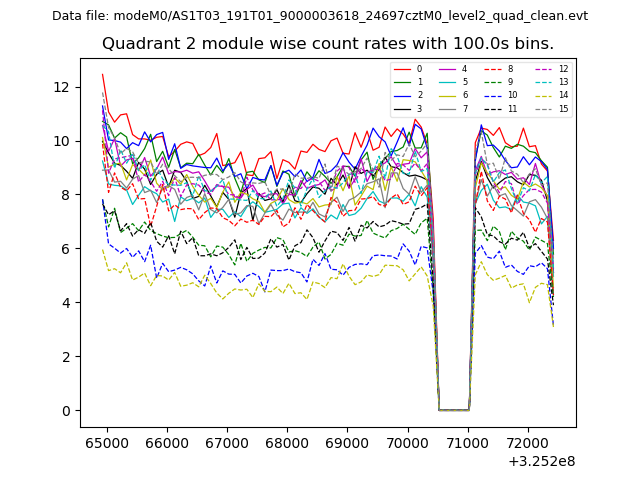
| Module-wise count rates for Quadrant B Data is divided into 100 sec bins |
 |
 |
| Module-wise count rates for Quadrant C Data is divided into 100 sec bins |
 |
 |
| Module-wise count rates for Quadrant D Data is divided into 100 sec bins |
 |
 |
| Parameter | Plot |
|---|---|
| CZT HV Monitor | 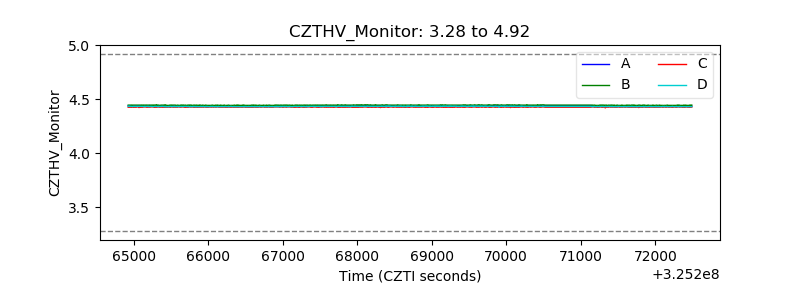 |
| D_VDD | 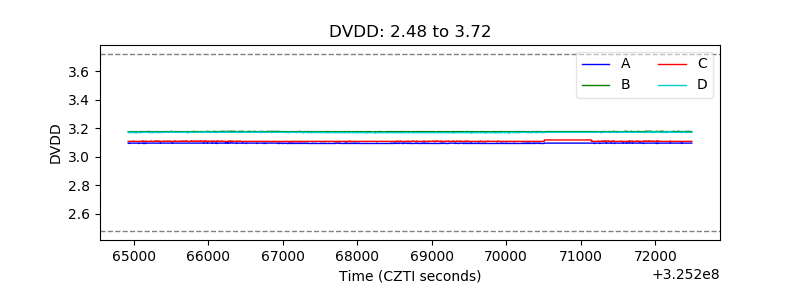 |
| Temperature 1 | 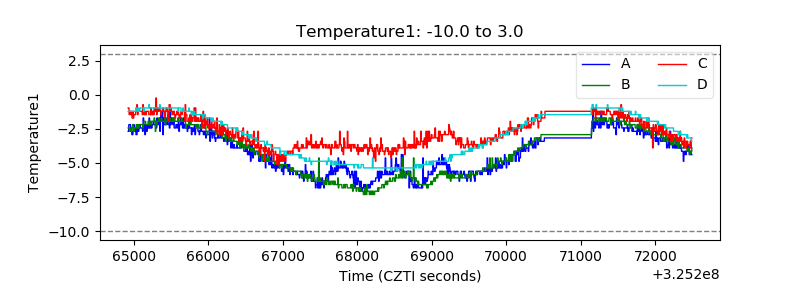 |
| Veto HV Monitor | 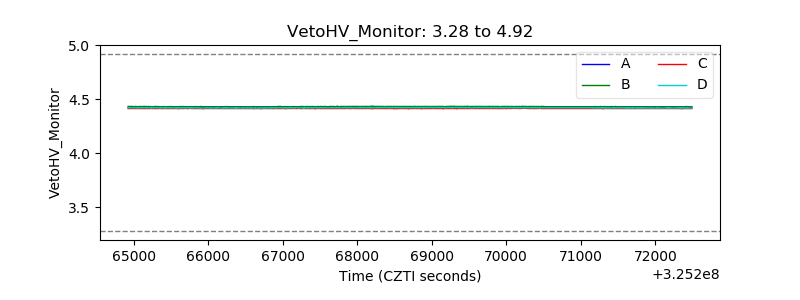 |
| Veto LLD | 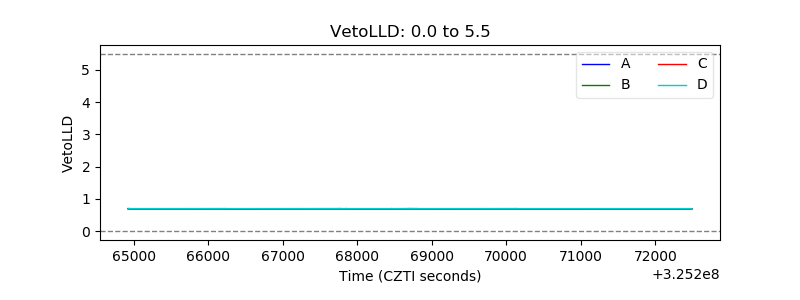 |
| Alpha Counter | 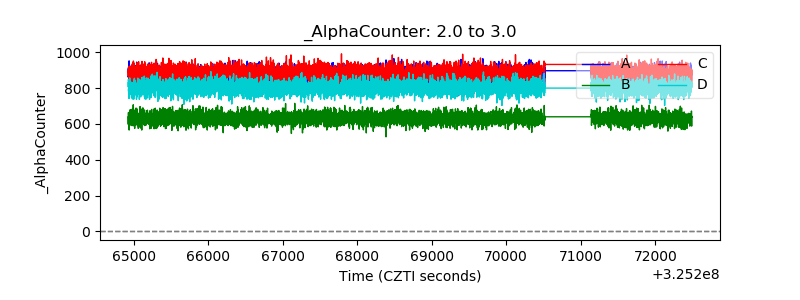 |
| _CPM_Rate | 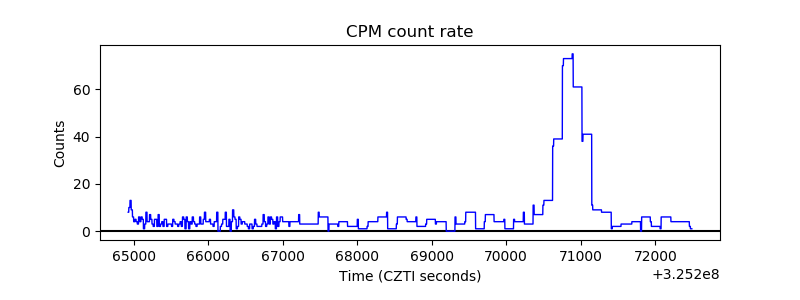 |
| CZT Counter | 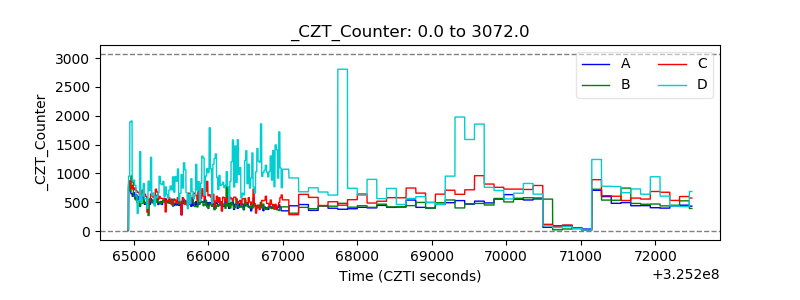 |
| +2.5 Volts monitor |  |
| +5 Volts monitor |  |
| _ROLL_ROT | 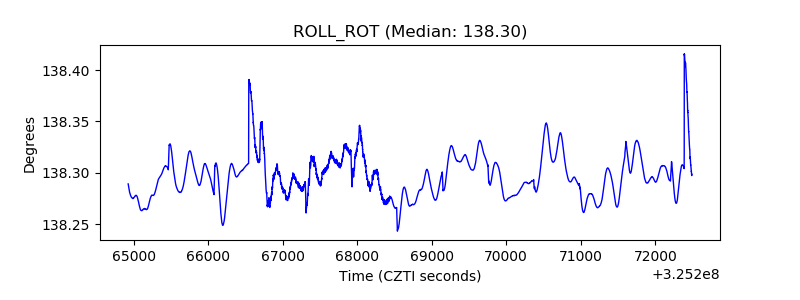 |
| _Roll_DEC | 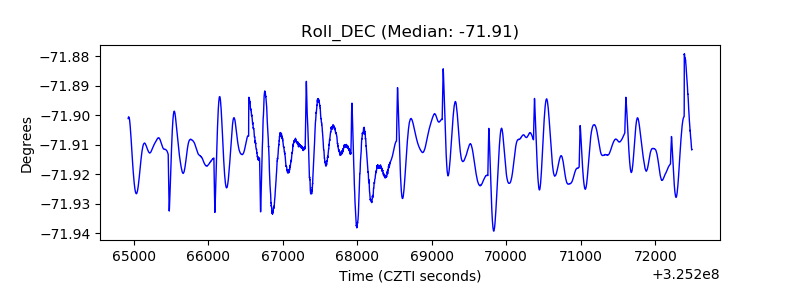 |
| _Roll_RA | 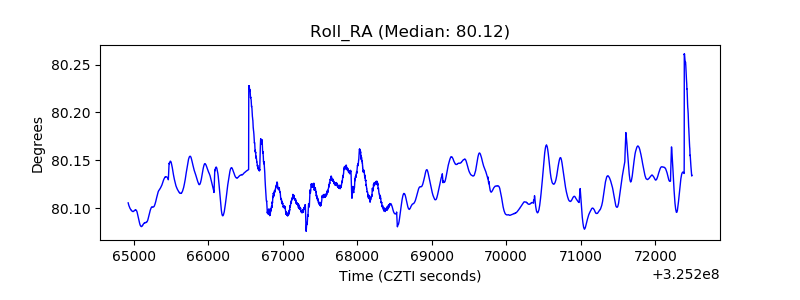 |
| Veto Counter | 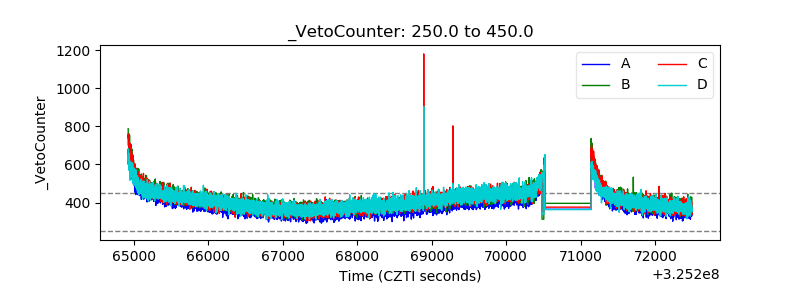 |