| Param | Original file | Final file |
|---|---|---|
| Filename | modeM0/AS1T03_191T01_9000003618_24698cztM0_level2.evt | modeM0/AS1T03_191T01_9000003618_24698cztM0_level2_quad_clean.evt |
| Size (bytes) | 545,091,840 | 135,322,560 |
| Size | 519.8 MB | 129.1 MB |
| Events in quadrant A | 3,403,548 | 928,121 |
| Events in quadrant B | 4,065,315 | 920,898 |
| Events in quadrant C | 3,800,158 | 883,412 |
| Events in quadrant D | 4,752,557 | 866,777 |
| Mode M9 | |||
|---|---|---|---|
| Quadrant | BADHDUFLAG | Total packets | Discarded packets |
| A | 0 | 3 | 0 |
| B | 0 | 3 | 0 |
| C | 0 | 3 | 0 |
| D | 0 | 3 | 0 |
| Mode M0 | |||
|---|---|---|---|
| Quadrant | BADHDUFLAG | Total packets | Discarded packets |
| A | 0 | 14977 | 1 |
| B | 0 | 16915 | 2 |
| C | 0 | 15908 | 1 |
| D | 0 | 18794 | 1 |
| Mode SS | |||
|---|---|---|---|
| Quadrant | BADHDUFLAG | Total packets | Discarded packets |
| A | 0 | 146 | 0 |
| B | 0 | 146 | 0 |
| C | 0 | 146 | 0 |
| D | 0 | 146 | 0 |
| Quadrant | Total seconds | Saturated seconds | Saturation percentage |
|---|---|---|---|
| A | 7172 | 44 | 0.613497% |
| B | 7172 | 273 | 3.806470% |
| C | 7172 | 82 | 1.143335% |
| D | 7172 | 254 | 3.541550% |
Noise dominated data is calculated using 1-second bins in cleaned event files. If a bin has >2000 counts, and if more than 50% of those come from <1% of pixels, then it is considered to be noise-dominated and hence unusable.
| Quadrant | # 1 sec bins | Bins with >0 counts | Bins with >2000 counts | High rate bins dominated by noise | Noise dominated (total time) | Noise dominated (detector-on time) | Marked lightcurve |
|---|---|---|---|---|---|---|---|
| A | 7512 | 7173 | 13 | 13 | 0.17% | 0.18% | 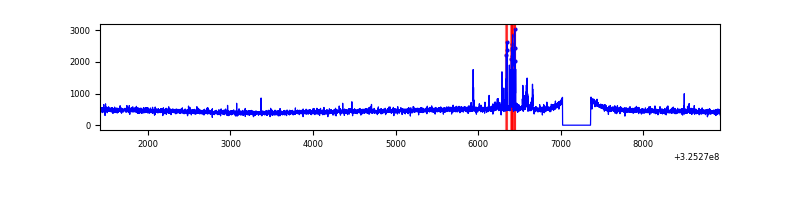 |
| B | 7512 | 7173 | 150 | 150 | 2.00% | 2.09% | 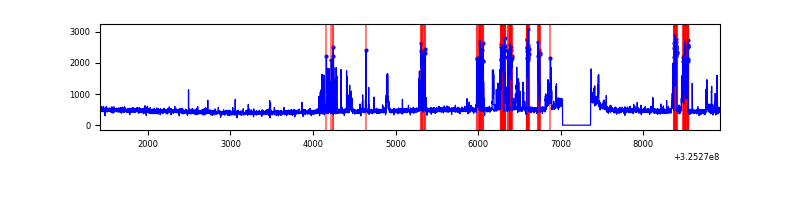 |
| C | 7512 | 7173 | 18 | 18 | 0.24% | 0.25% |  |
| D | 7512 | 7173 | 194 | 194 | 2.58% | 2.70% | 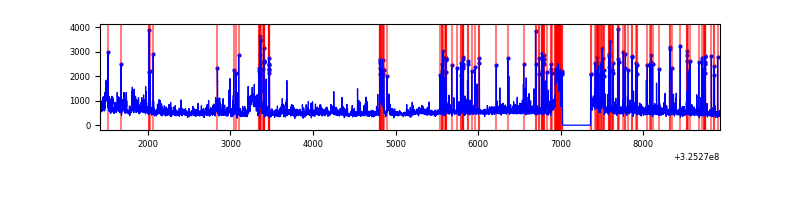 |
Top three noisy pixels from each quadrant. If the there are fewer than three noisy pixels in the level2.evt file, extra rows are filled as -1
| Pixel properties | Quadrant properties | ||||||
|---|---|---|---|---|---|---|---|
| Quadrant | DetID | PixID | Counts | Sigma | Mean | Median | Sigma |
| A | 12 | 96 | 115203 | 668.42 | 851 | 831 | 171.1 |
| A | 13 | 254 | 12072 | 65.69 | 851 | 831 | 171.1 |
| A | 3 | 137 | 7898 | 41.3 | 851 | 831 | 171.1 |
| B | 4 | 80 | 638006 | 4057.11 | 835 | 815 | 157.1 |
| B | 0 | 189 | 78519 | 494.76 | 835 | 815 | 157.1 |
| B | 4 | 173 | 50355 | 315.43 | 835 | 815 | 157.1 |
| C | 7 | 247 | 399548 | 2128.9 | 804 | 804 | 187.3 |
| C | 14 | 238 | 131093 | 695.61 | 804 | 804 | 187.3 |
| C | 2 | 16 | 89528 | 473.7 | 804 | 804 | 187.3 |
| D | 1 | 52 | 750392 | 3834.33 | 810 | 785 | 195.5 |
| D | 8 | 195 | 618747 | 3160.95 | 810 | 785 | 195.5 |
| D | 7 | 238 | 227243 | 1158.36 | 810 | 785 | 195.5 |
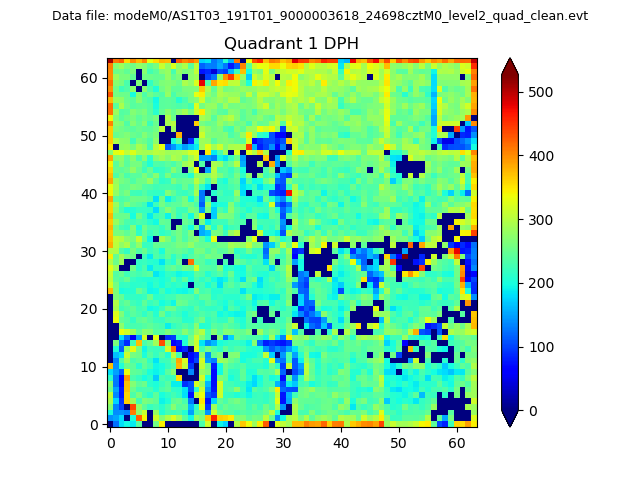
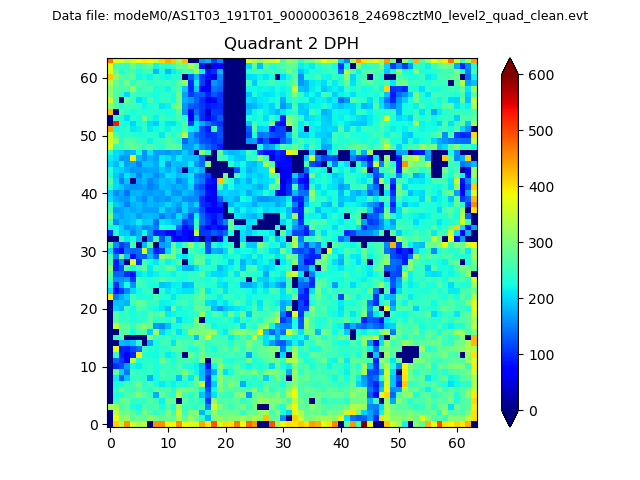
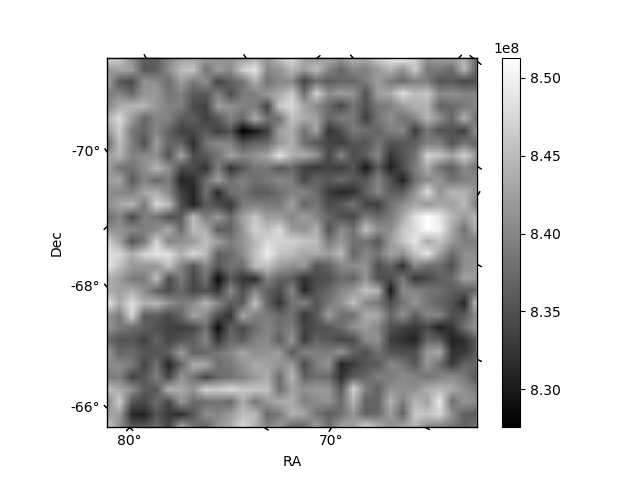
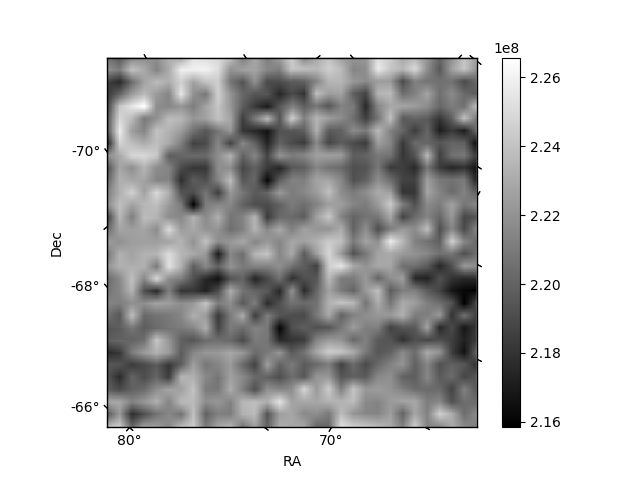
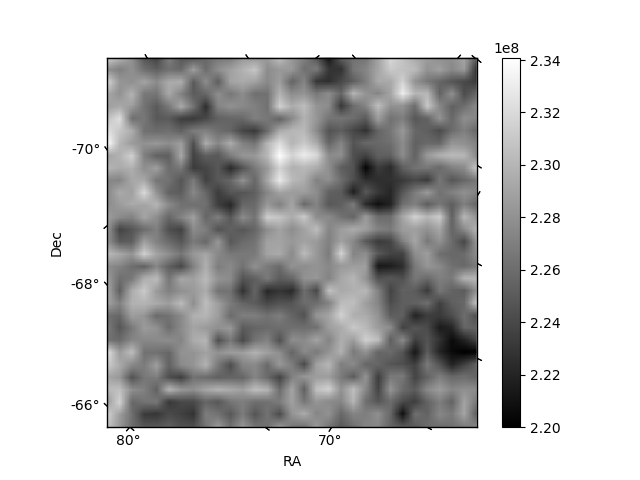
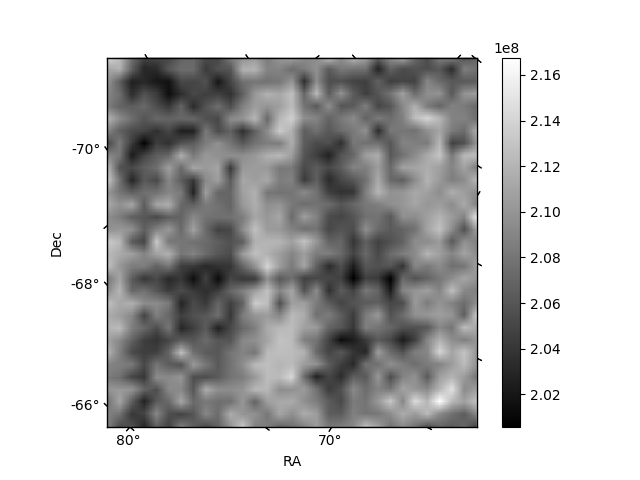
Histogram calculated using DETX and DETY for each event in the final _common_clean file
| Quadrant A | 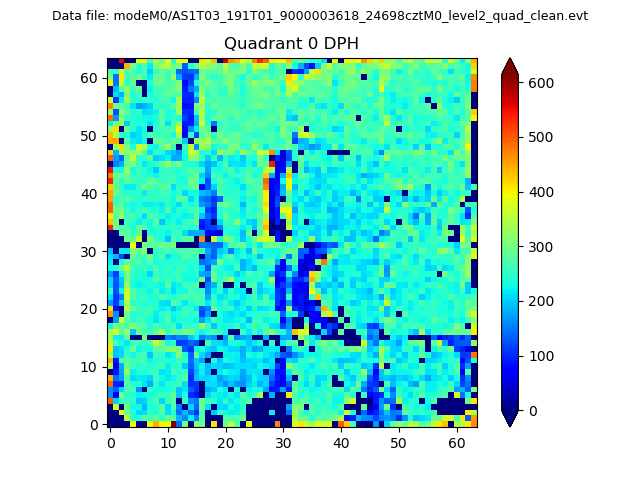 |
 |
Quadrant B |
|---|---|---|---|
| Quadrant D | 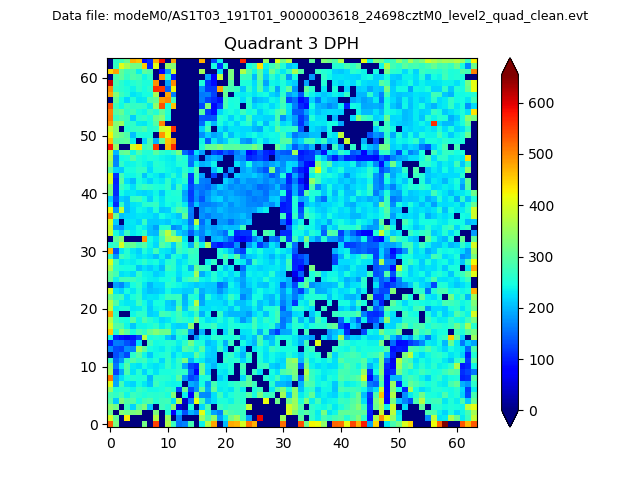 |
 |
Quadrant C |
| Plot type | Count rate plots | Images |
|---|---|---|
| Comparison with Poisson distribution Blue bars denote a histogram of data divided into 1 sec bins. Red curve is a Poisson curve with rate = median count rate of data. |
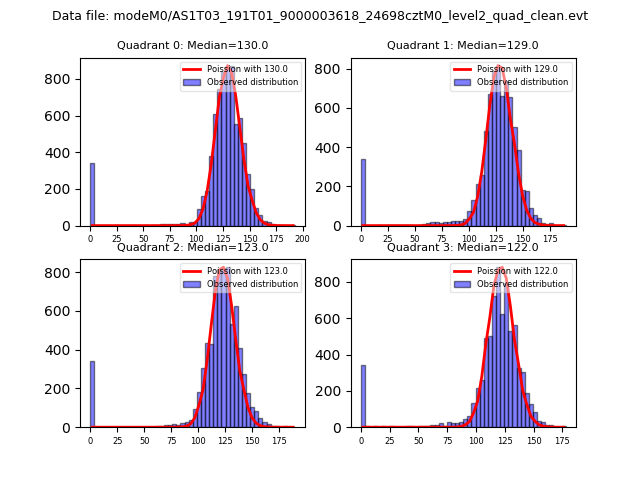 |
 |
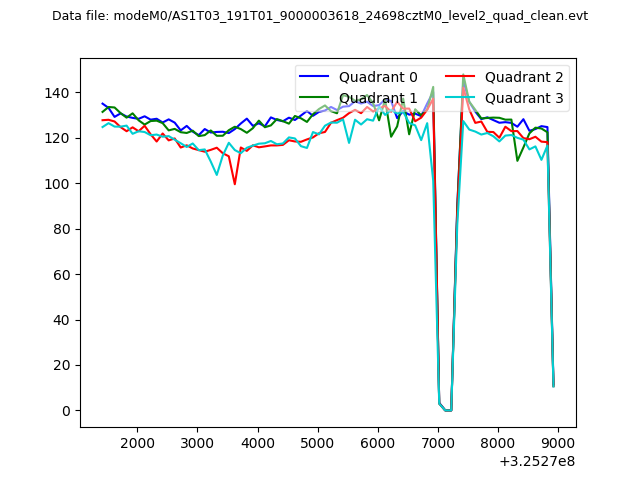
| Quadrant-wise count rates Data is divided into 100 sec bins |
 |
|
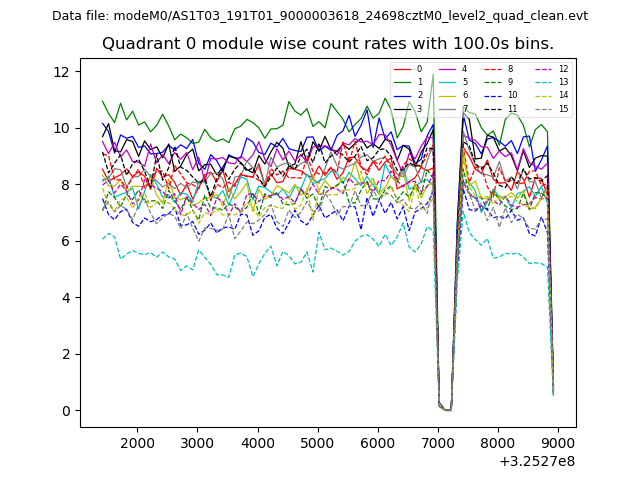
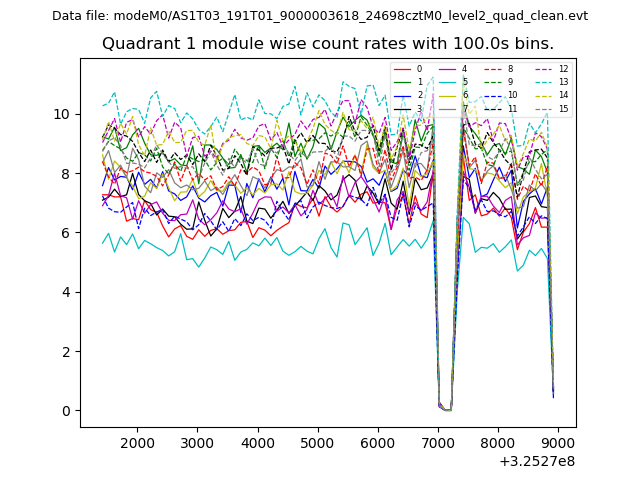
| Module-wise count rates for Quadrant A Data is divided into 100 sec bins |
 |
 |
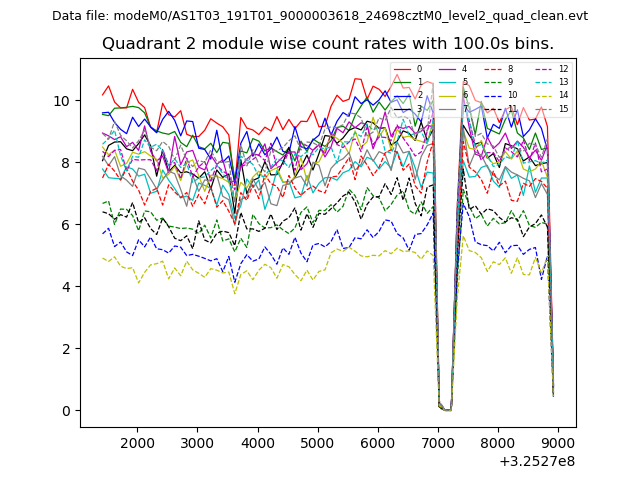
| Module-wise count rates for Quadrant B Data is divided into 100 sec bins |
 |
 |
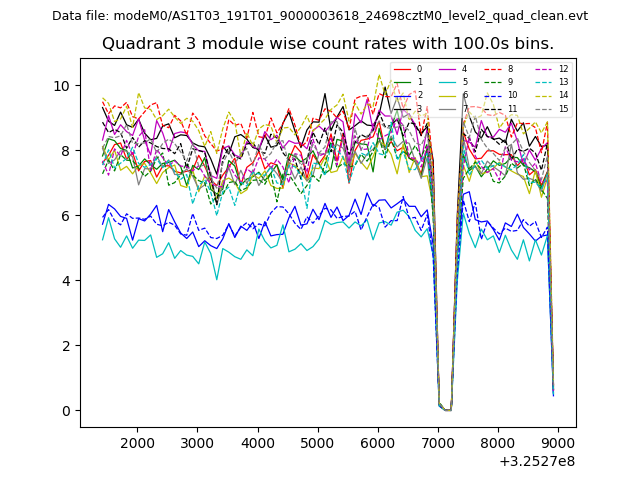
| Module-wise count rates for Quadrant C Data is divided into 100 sec bins |
 |
 |
| Module-wise count rates for Quadrant D Data is divided into 100 sec bins |
 |
 |
| Parameter | Plot |
|---|---|
| CZT HV Monitor | 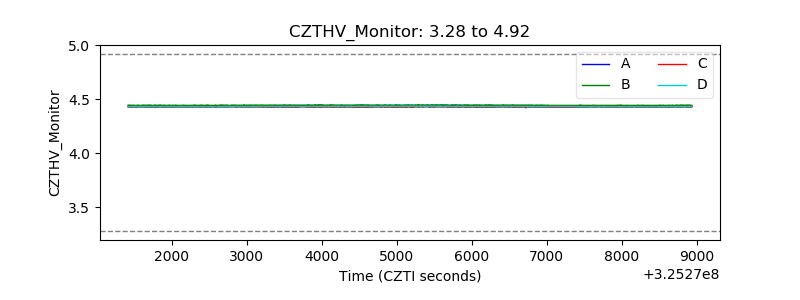 |
| D_VDD | 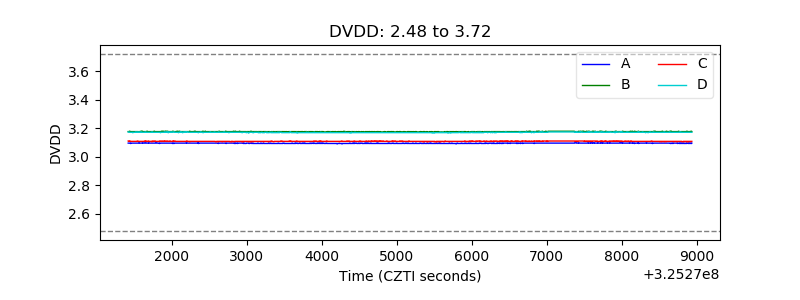 |
| Temperature 1 | 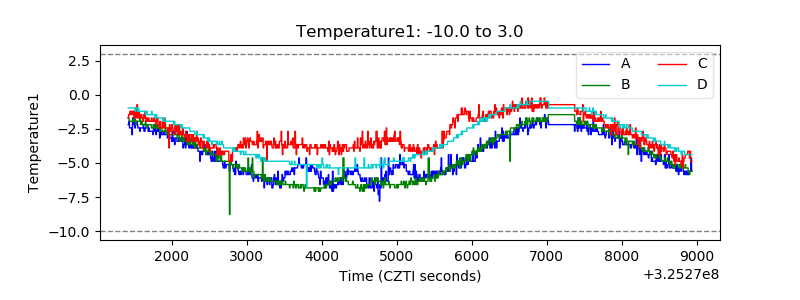 |
| Veto HV Monitor | 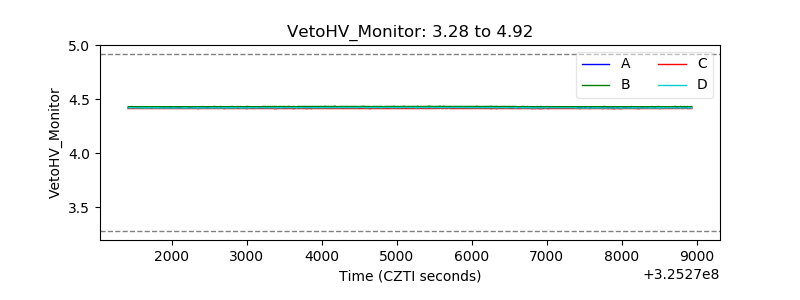 |
| Veto LLD | 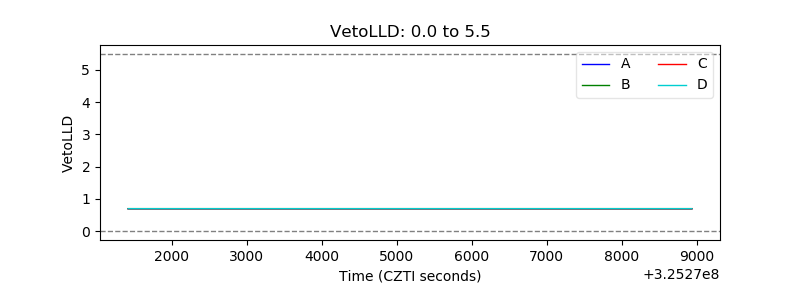 |
| Alpha Counter | 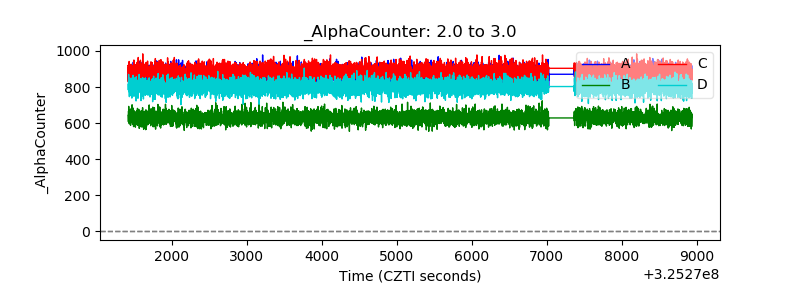 |
| _CPM_Rate | 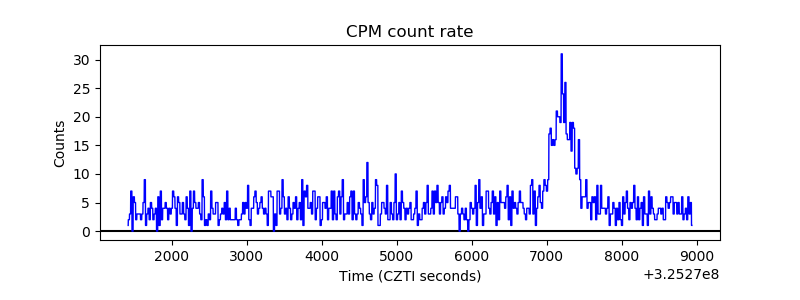 |
| CZT Counter | 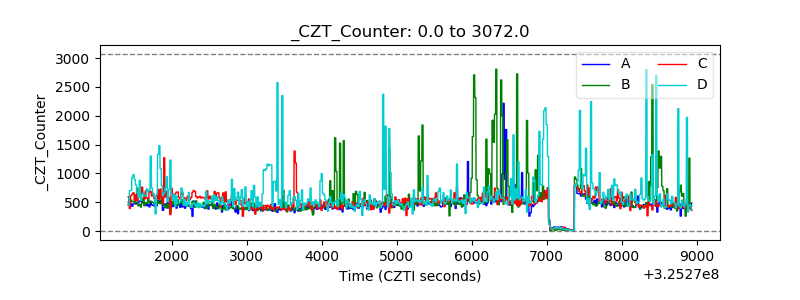 |
| +2.5 Volts monitor |  |
| +5 Volts monitor |  |
| _ROLL_ROT | 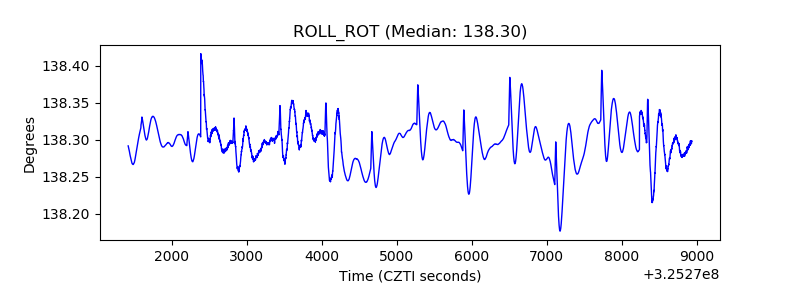 |
| _Roll_DEC | 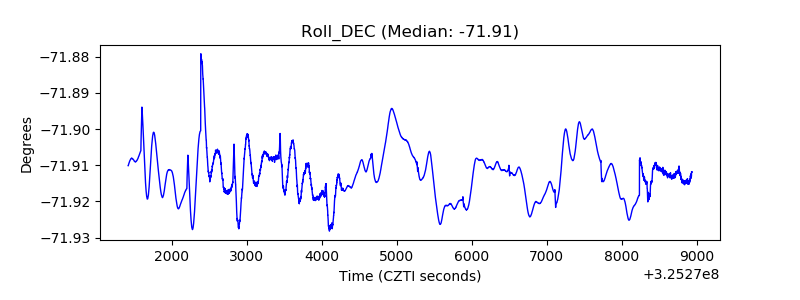 |
| _Roll_RA | 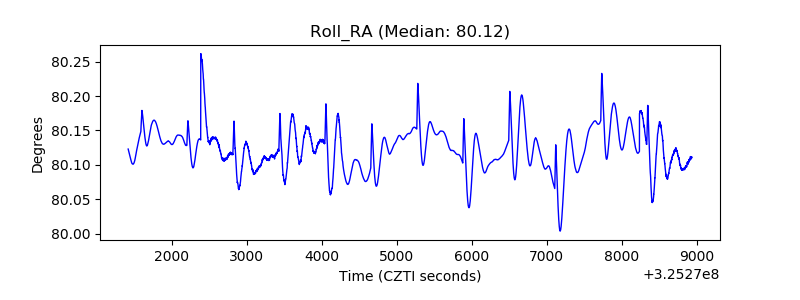 |
| Veto Counter | 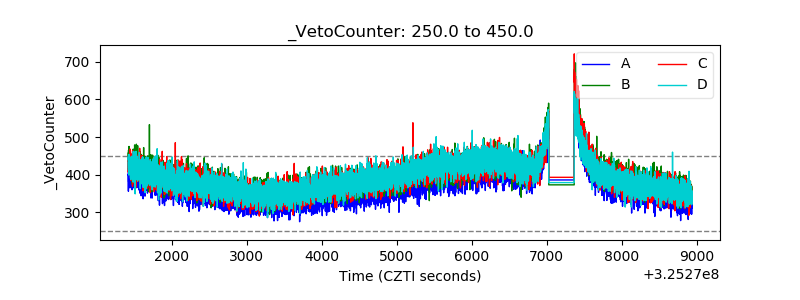 |