| Param | Original file | Final file |
|---|---|---|
| Filename | modeM0/AS1T03_191T01_9000003618_24703cztM0_level2.evt | modeM0/AS1T03_191T01_9000003618_24703cztM0_level2_quad_clean.evt |
| Size (bytes) | 579,746,880 | 165,470,400 |
| Size | 552.9 MB | 157.8 MB |
| Events in quadrant A | 4,056,224 | 1,124,972 |
| Events in quadrant B | 4,213,856 | 1,135,151 |
| Events in quadrant C | 4,421,329 | 1,081,869 |
| Events in quadrant D | 4,284,947 | 1,075,245 |
| Mode M9 | |||
|---|---|---|---|
| Quadrant | BADHDUFLAG | Total packets | Discarded packets |
| A | 0 | 17 | 0 |
| B | 0 | 17 | 0 |
| C | 0 | 17 | 0 |
| D | 0 | 17 | 0 |
| Mode M0 | |||
|---|---|---|---|
| Quadrant | BADHDUFLAG | Total packets | Discarded packets |
| A | 0 | 17442 | 2 |
| B | 0 | 17845 | 2 |
| C | 0 | 18526 | 2 |
| D | 0 | 18266 | 2 |
| Mode SS | |||
|---|---|---|---|
| Quadrant | BADHDUFLAG | Total packets | Discarded packets |
| A | 0 | 174 | 0 |
| B | 0 | 174 | 0 |
| C | 0 | 174 | 0 |
| D | 0 | 174 | 0 |
| Quadrant | Total seconds | Saturated seconds | Saturation percentage |
|---|---|---|---|
| A | 8571 | 63 | 0.735037% |
| B | 8572 | 115 | 1.341577% |
| C | 8572 | 119 | 1.388241% |
| D | 8572 | 64 | 0.746617% |
Noise dominated data is calculated using 1-second bins in cleaned event files. If a bin has >2000 counts, and if more than 50% of those come from <1% of pixels, then it is considered to be noise-dominated and hence unusable.
| Quadrant | # 1 sec bins | Bins with >0 counts | Bins with >2000 counts | High rate bins dominated by noise | Noise dominated (total time) | Noise dominated (detector-on time) | Marked lightcurve |
|---|---|---|---|---|---|---|---|
| A | 10261 | 8571 | 0 | 0 | 0.00% | 0.00% | 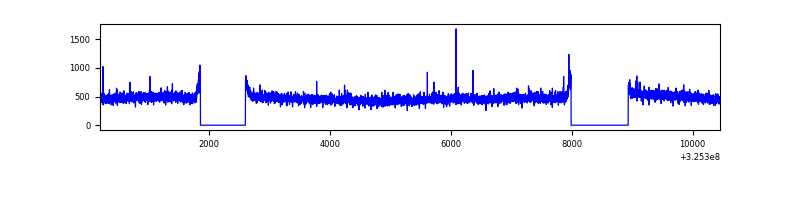 |
| B | 10262 | 8572 | 20 | 20 | 0.19% | 0.23% | 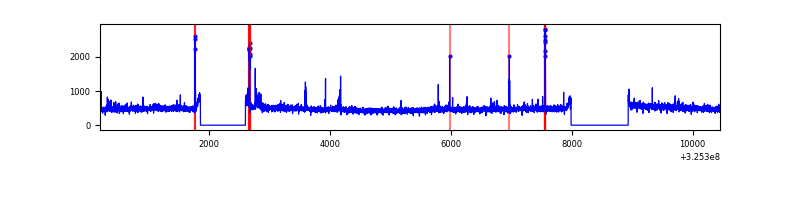 |
| C | 10262 | 8572 | 5 | 5 | 0.05% | 0.06% | 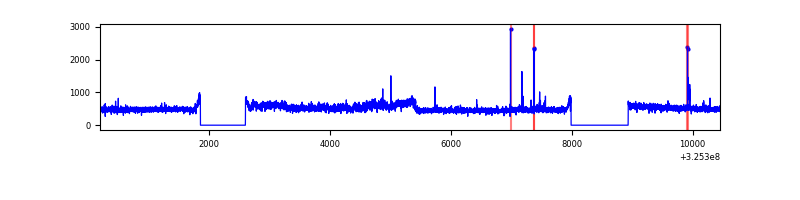 |
| D | 10262 | 8572 | 17 | 17 | 0.17% | 0.20% | 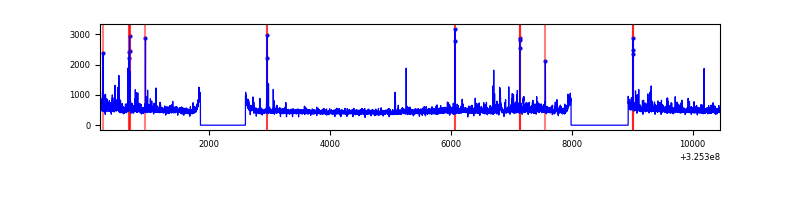 |
Top three noisy pixels from each quadrant. If the there are fewer than three noisy pixels in the level2.evt file, extra rows are filled as -1
| Pixel properties | Quadrant properties | ||||||
|---|---|---|---|---|---|---|---|
| Quadrant | DetID | PixID | Counts | Sigma | Mean | Median | Sigma |
| A | 10 | 255 | 16015 | 71.22 | 1048 | 1024 | 210.5 |
| A | 13 | 254 | 15336 | 67.99 | 1048 | 1024 | 210.5 |
| A | 3 | 137 | 9270 | 39.17 | 1048 | 1024 | 210.5 |
| B | 0 | 230 | 49407 | 245.36 | 1039 | 1010 | 197.2 |
| B | 4 | 52 | 26314 | 128.29 | 1039 | 1010 | 197.2 |
| B | 12 | 111 | 23938 | 116.24 | 1039 | 1010 | 197.2 |
| C | 7 | 247 | 296786 | 1272.96 | 1003 | 1010 | 232.4 |
| C | 14 | 238 | 160492 | 686.38 | 1003 | 1010 | 232.4 |
| C | 2 | 16 | 44566 | 187.46 | 1003 | 1010 | 232.4 |
| D | 1 | 52 | 219567 | 883.23 | 1021 | 990 | 247.5 |
| D | 8 | 195 | 155116 | 622.79 | 1021 | 990 | 247.5 |
| D | 2 | 234 | 31014 | 121.32 | 1021 | 990 | 247.5 |
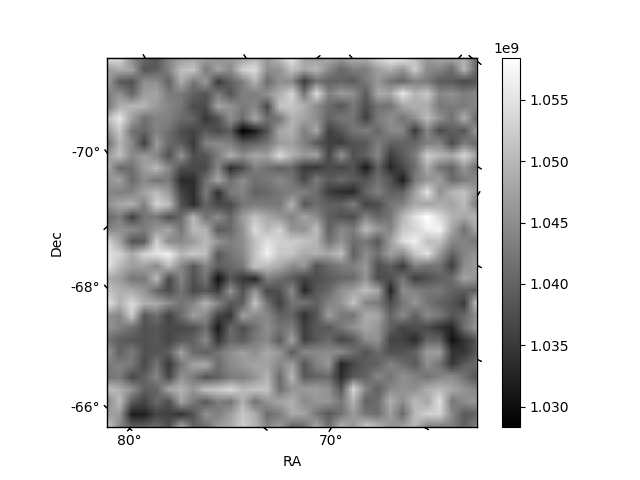
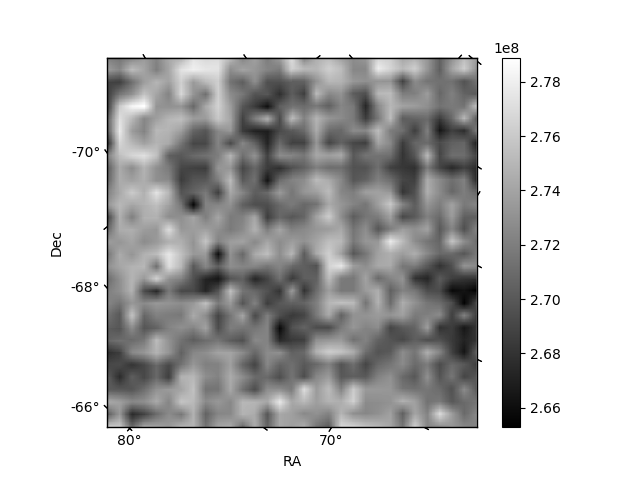
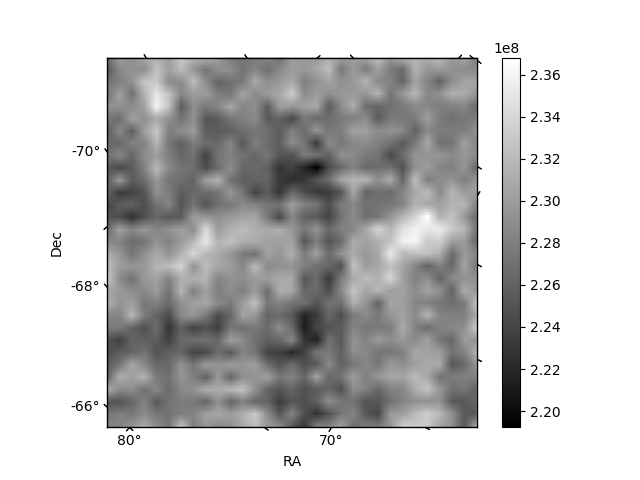
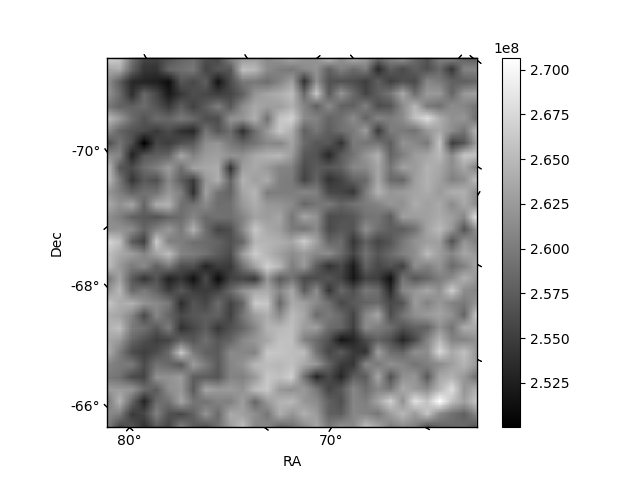
Histogram calculated using DETX and DETY for each event in the final _common_clean file
| Quadrant A | 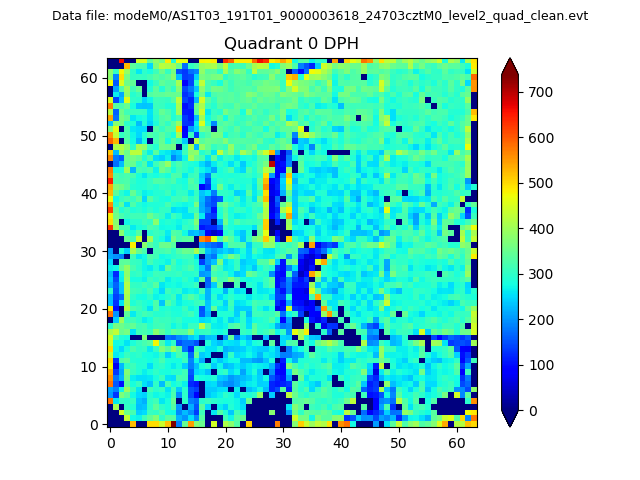 |
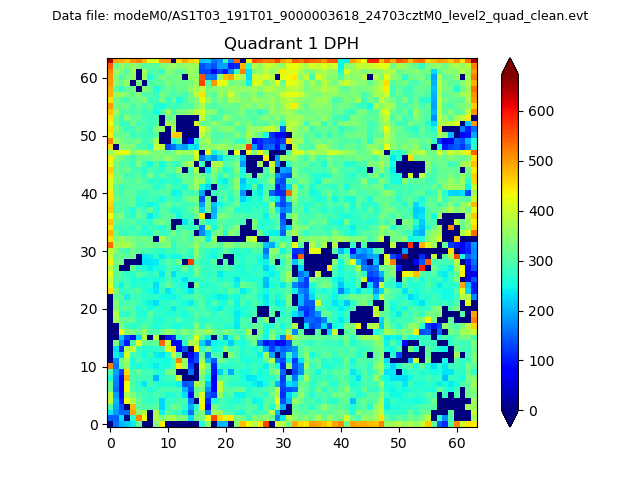 |
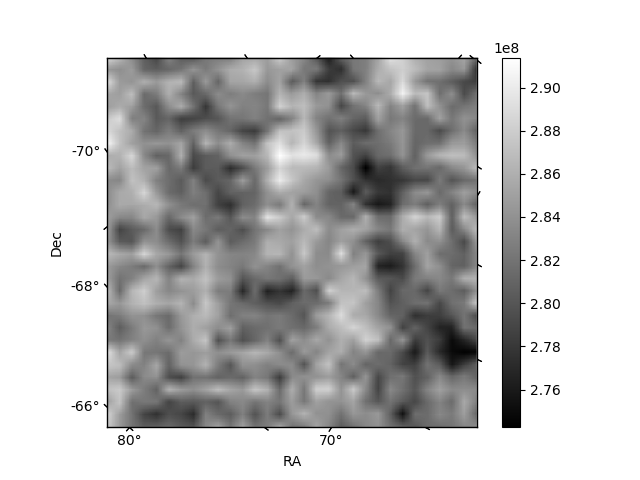
Quadrant B |
|---|---|---|---|
| Quadrant D | 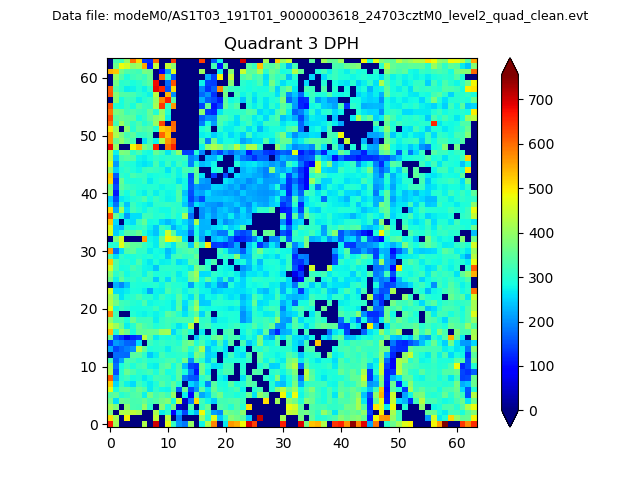 |
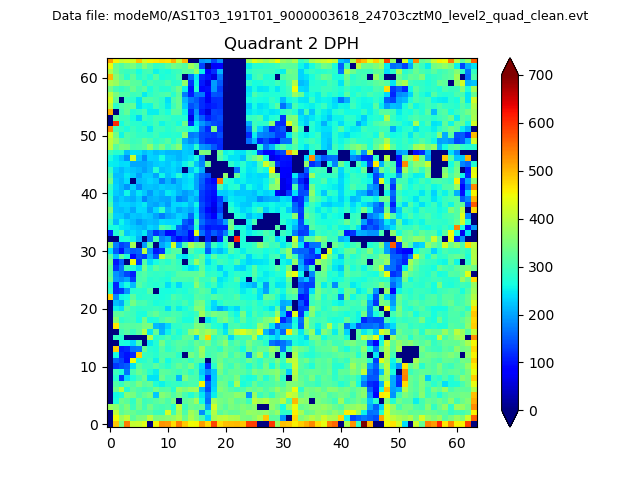 |
Quadrant C |
| Plot type | Count rate plots | Images |
|---|---|---|
| Comparison with Poisson distribution Blue bars denote a histogram of data divided into 1 sec bins. Red curve is a Poisson curve with rate = median count rate of data. |
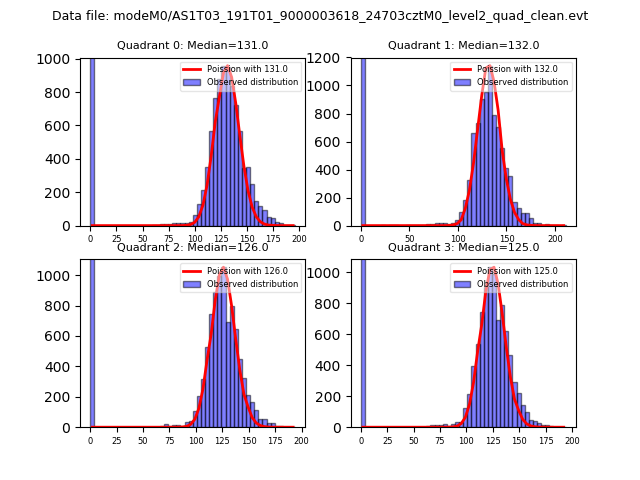 |
 |
| Quadrant-wise count rates Data is divided into 100 sec bins |
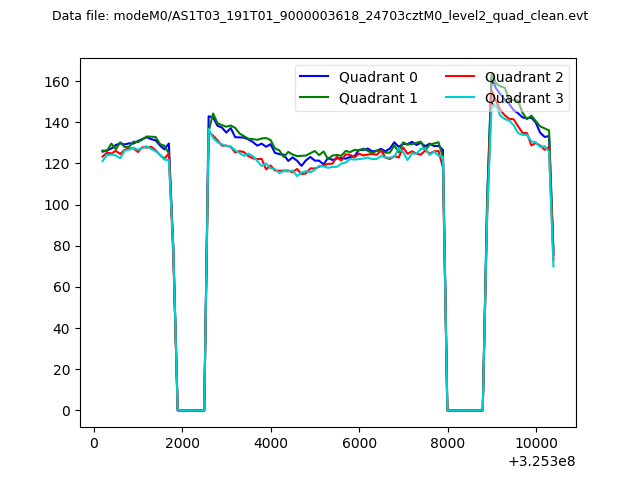 |
|
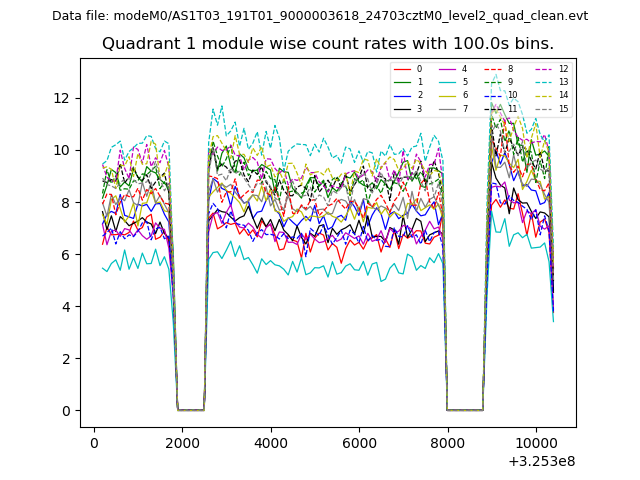
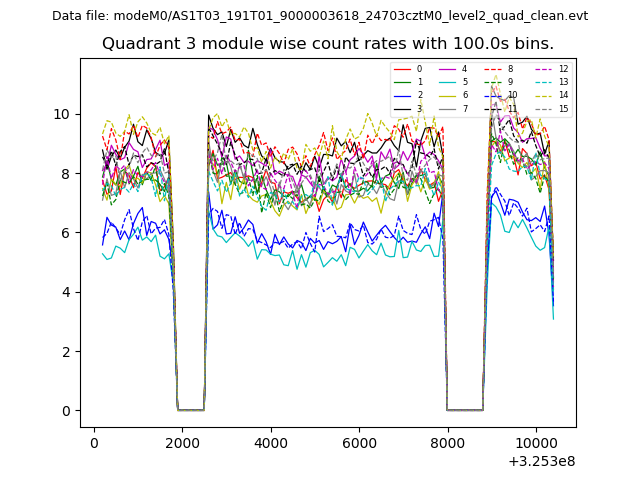
| Module-wise count rates for Quadrant A Data is divided into 100 sec bins |
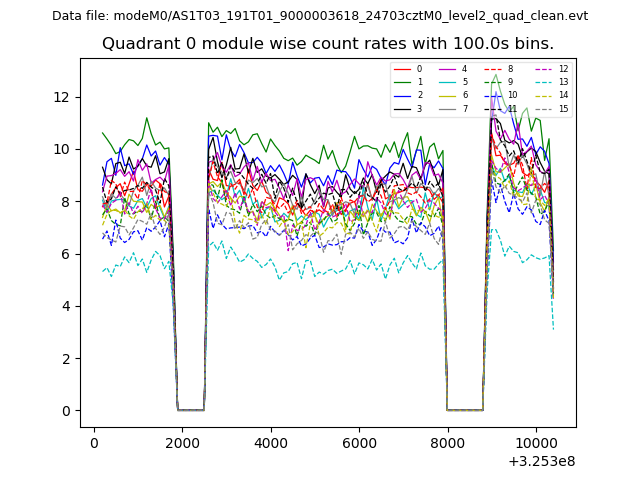 |
 |
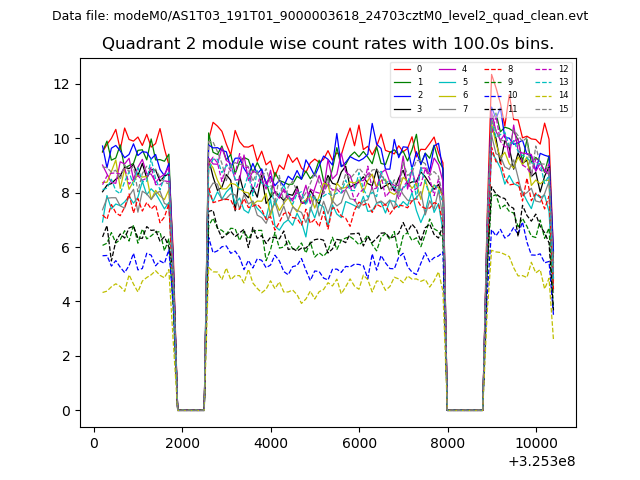
| Module-wise count rates for Quadrant B Data is divided into 100 sec bins |
 |
 |
| Module-wise count rates for Quadrant C Data is divided into 100 sec bins |
 |
 |
| Module-wise count rates for Quadrant D Data is divided into 100 sec bins |
 |
 |
| Parameter | Plot |
|---|---|
| CZT HV Monitor | 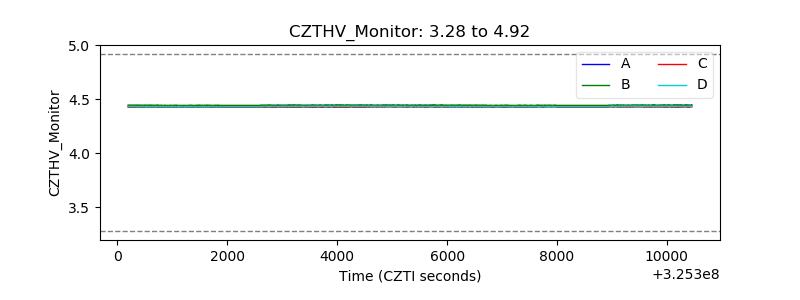 |
| D_VDD | 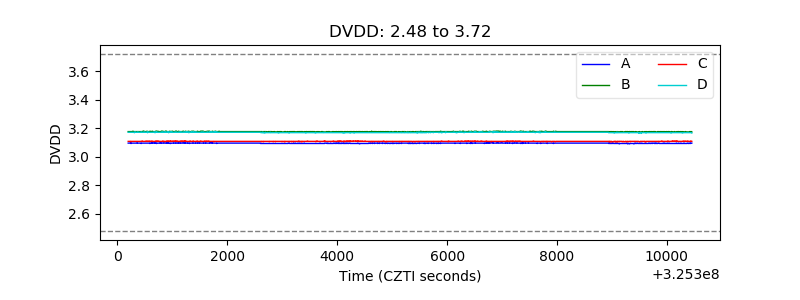 |
| Temperature 1 | 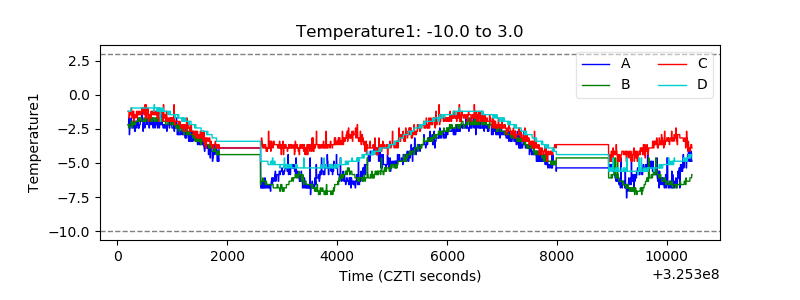 |
| Veto HV Monitor | 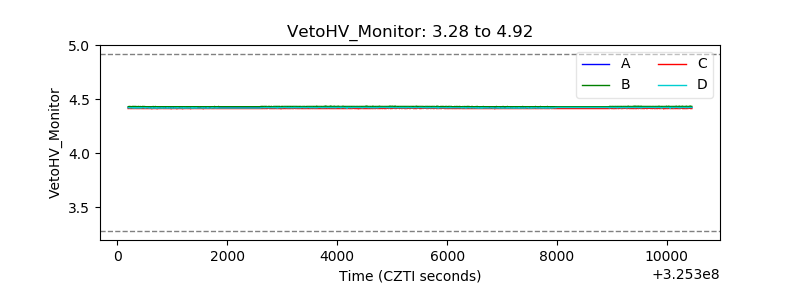 |
| Veto LLD | 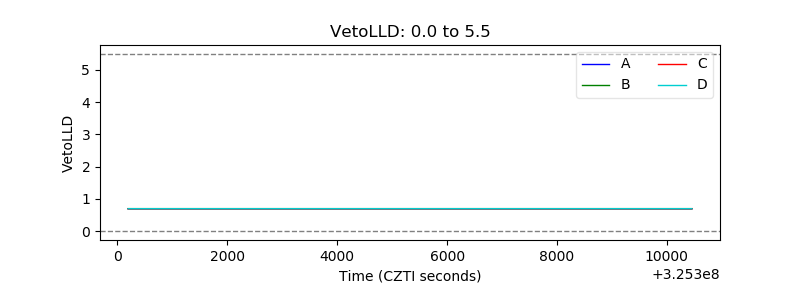 |
| Alpha Counter | 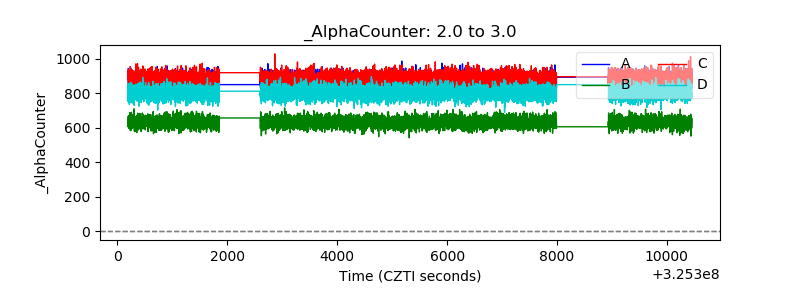 |
| _CPM_Rate | 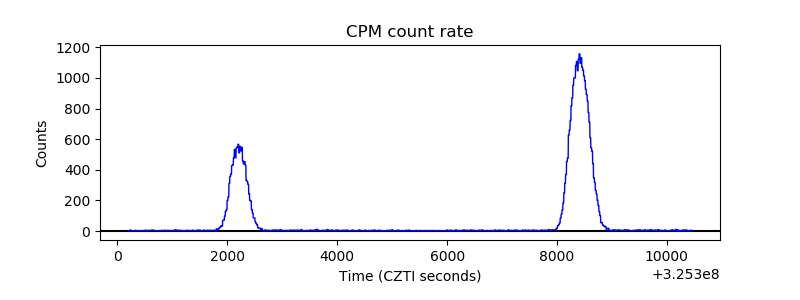 |
| CZT Counter | 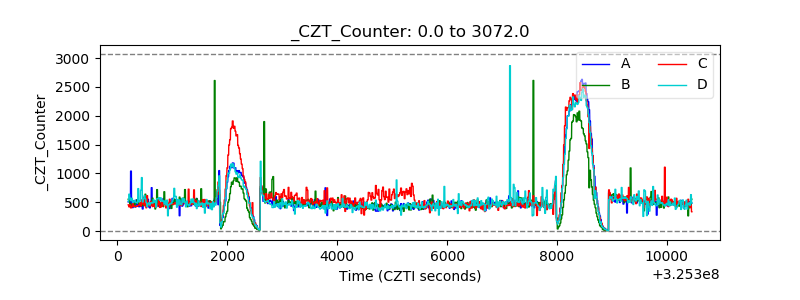 |
| +2.5 Volts monitor |  |
| +5 Volts monitor |  |
| _ROLL_ROT | 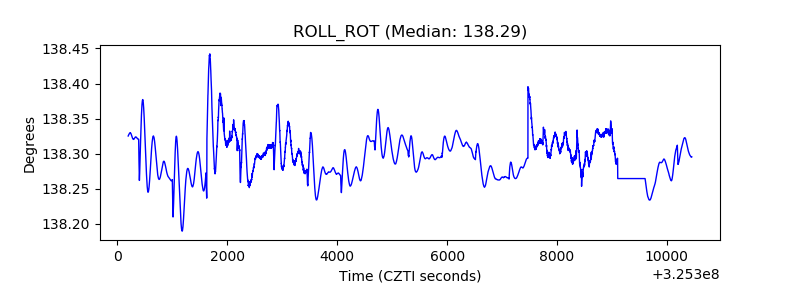 |
| _Roll_DEC | 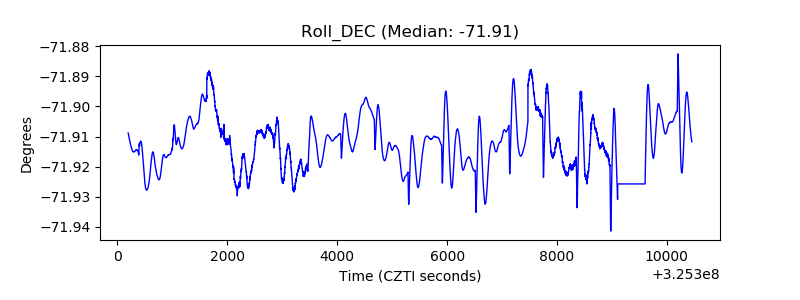 |
| _Roll_RA | 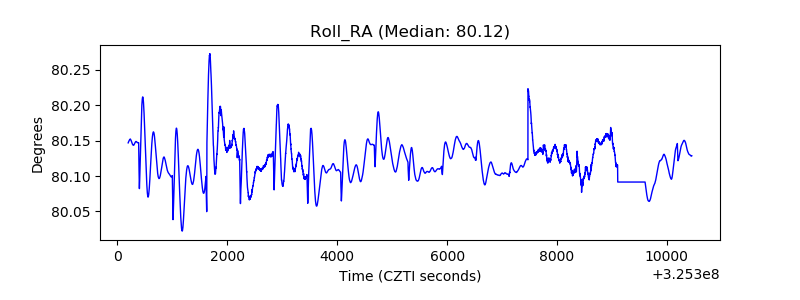 |
| Veto Counter | 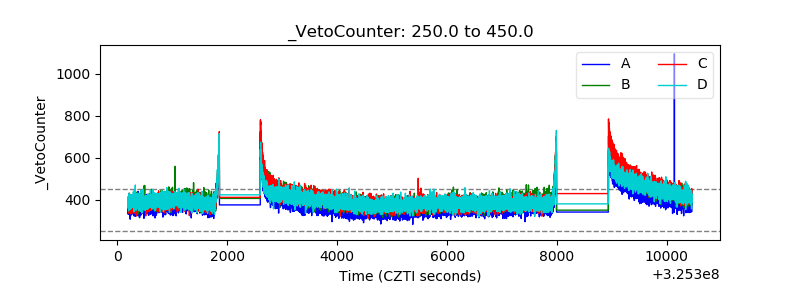 |