| Param | Original file | Final file |
|---|---|---|
| Filename | modeM0/AS1T03_191T01_9000003618_24707cztM0_level2.evt | modeM0/AS1T03_191T01_9000003618_24707cztM0_level2_quad_clean.evt |
| Size (bytes) | 548,778,240 | 141,056,640 |
| Size | 523.4 MB | 134.5 MB |
| Events in quadrant A | 3,276,284 | 986,917 |
| Events in quadrant B | 3,325,895 | 993,729 |
| Events in quadrant C | 4,582,059 | 936,926 |
| Events in quadrant D | 5,016,467 | 922,702 |
| Mode M9 | |||
|---|---|---|---|
| Quadrant | BADHDUFLAG | Total packets | Discarded packets |
| A | 0 | 13 | 0 |
| B | 0 | 13 | 0 |
| C | 0 | 13 | 0 |
| D | 0 | 13 | 0 |
| Mode M0 | |||
|---|---|---|---|
| Quadrant | BADHDUFLAG | Total packets | Discarded packets |
| A | 0 | 13726 | 1 |
| B | 0 | 13899 | 1 |
| C | 0 | 17576 | 1 |
| D | 0 | 19322 | 1 |
| Mode SS | |||
|---|---|---|---|
| Quadrant | BADHDUFLAG | Total packets | Discarded packets |
| A | 0 | 126 | 0 |
| B | 0 | 126 | 0 |
| C | 0 | 126 | 0 |
| D | 0 | 126 | 0 |
| Quadrant | Total seconds | Saturated seconds | Saturation percentage |
|---|---|---|---|
| A | 6192 | 56 | 0.904393% |
| B | 6192 | 67 | 1.082041% |
| C | 6192 | 234 | 3.779070% |
| D | 6193 | 262 | 4.230583% |
Noise dominated data is calculated using 1-second bins in cleaned event files. If a bin has >2000 counts, and if more than 50% of those come from <1% of pixels, then it is considered to be noise-dominated and hence unusable.
| Quadrant | # 1 sec bins | Bins with >0 counts | Bins with >2000 counts | High rate bins dominated by noise | Noise dominated (total time) | Noise dominated (detector-on time) | Marked lightcurve |
|---|---|---|---|---|---|---|---|
| A | 7457 | 6192 | 0 | 0 | 0.00% | 0.00% | 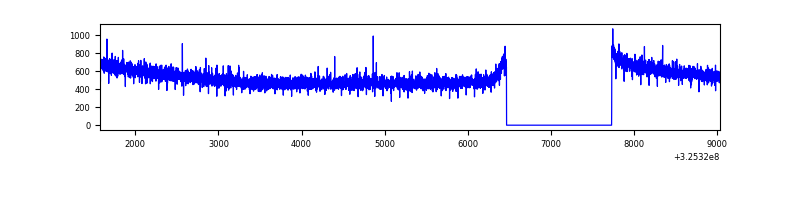 |
| B | 7457 | 6192 | 3 | 3 | 0.04% | 0.05% | 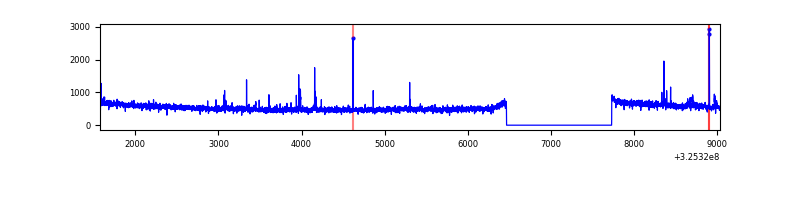 |
| C | 7457 | 6192 | 1 | 1 | 0.01% | 0.02% | 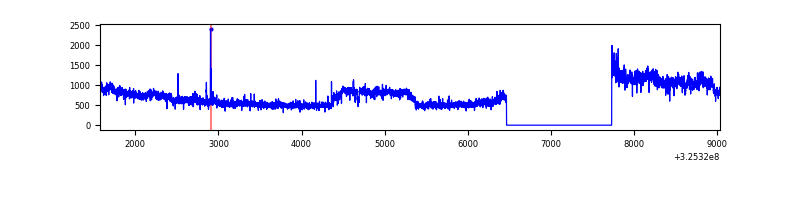 |
| D | 7458 | 6193 | 182 | 182 | 2.44% | 2.94% | 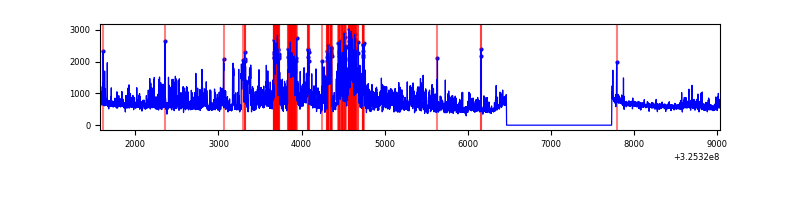 |
Top three noisy pixels from each quadrant. If the there are fewer than three noisy pixels in the level2.evt file, extra rows are filled as -1
| Pixel properties | Quadrant properties | ||||||
|---|---|---|---|---|---|---|---|
| Quadrant | DetID | PixID | Counts | Sigma | Mean | Median | Sigma |
| A | 13 | 254 | 10626 | 58.32 | 849 | 834 | 167.9 |
| A | 0 | 226 | 7569 | 40.11 | 849 | 834 | 167.9 |
| A | 3 | 137 | 6880 | 36.01 | 849 | 834 | 167.9 |
| B | 0 | 230 | 19666 | 122.32 | 829 | 810 | 154.1 |
| B | 4 | 80 | 19014 | 118.09 | 829 | 810 | 154.1 |
| B | 0 | 189 | 18489 | 114.68 | 829 | 810 | 154.1 |
| C | 7 | 247 | 1275015 | 6995.27 | 804 | 811 | 182.2 |
| C | 14 | 238 | 130804 | 713.65 | 804 | 811 | 182.2 |
| C | 10 | 9 | 16353 | 85.32 | 804 | 811 | 182.2 |
| D | 1 | 52 | 1209061 | 6141.49 | 824 | 804 | 196.7 |
| D | 12 | 233 | 451875 | 2292.76 | 824 | 804 | 196.7 |
| D | 8 | 195 | 207383 | 1050.03 | 824 | 804 | 196.7 |
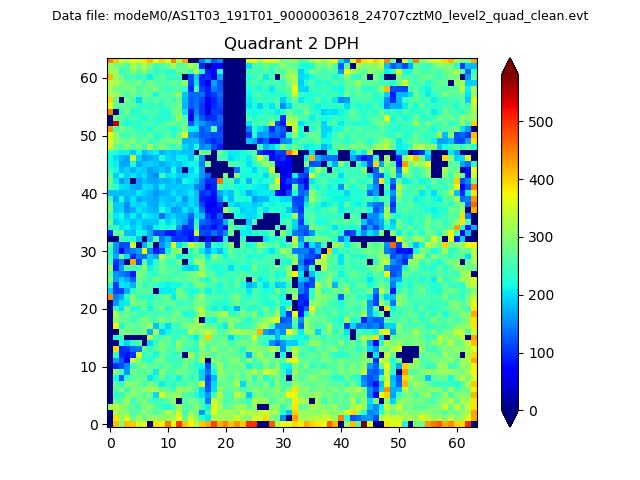
Histogram calculated using DETX and DETY for each event in the final _common_clean file
| Quadrant A | 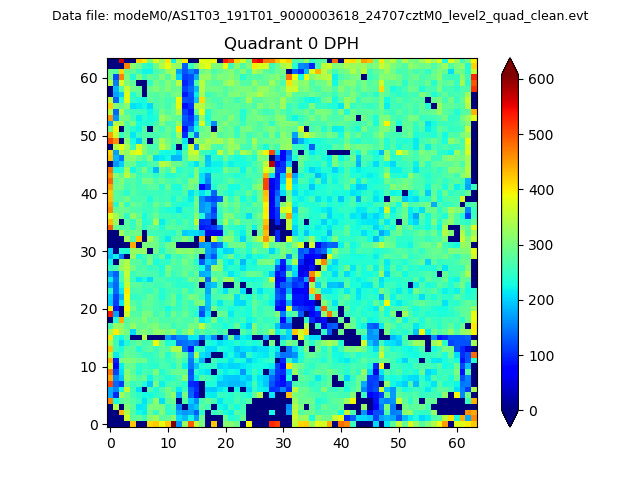 |
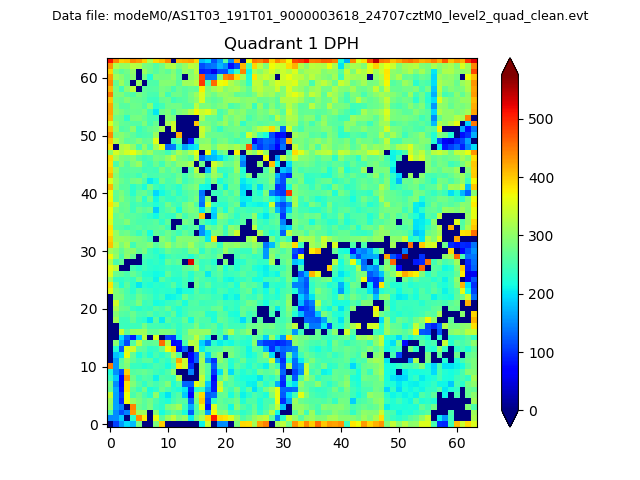 |
Quadrant B |
|---|---|---|---|
| Quadrant D | 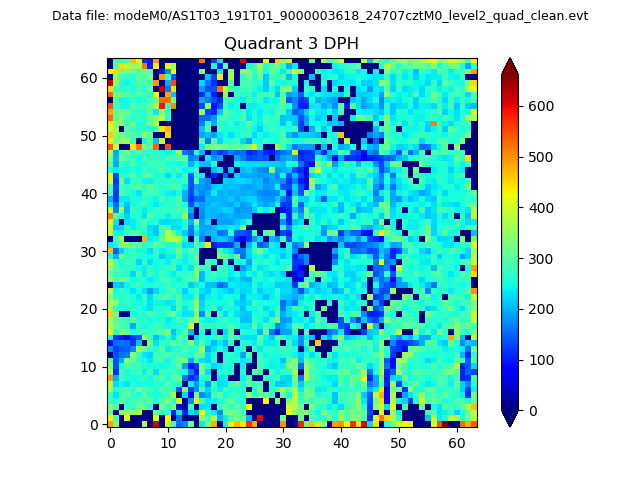 |
 |
Quadrant C |
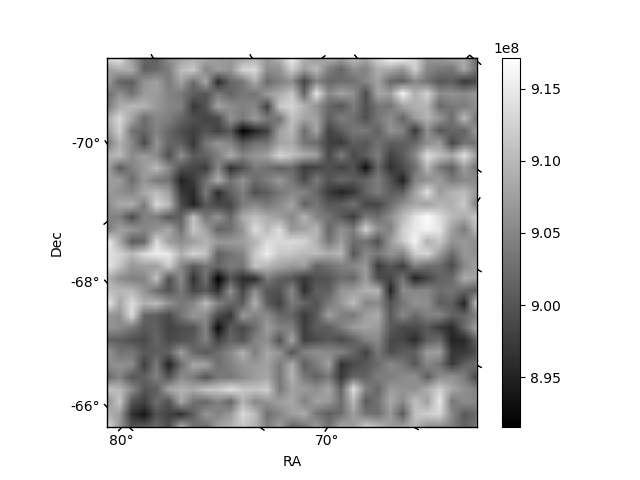
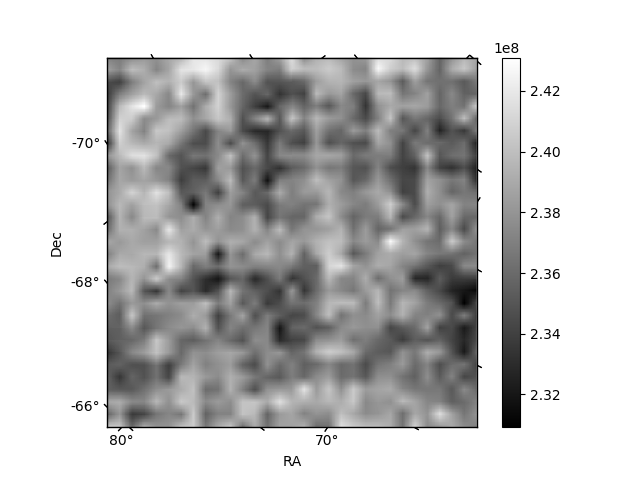
| Plot type | Count rate plots | Images |
|---|---|---|
| Comparison with Poisson distribution Blue bars denote a histogram of data divided into 1 sec bins. Red curve is a Poisson curve with rate = median count rate of data. |
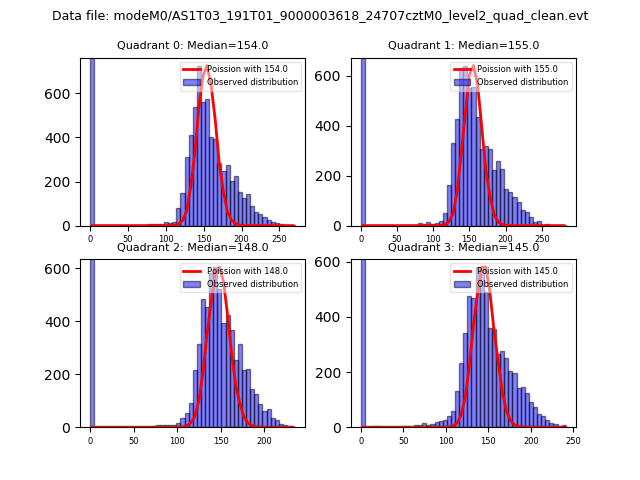 |
 |
| Quadrant-wise count rates Data is divided into 100 sec bins |
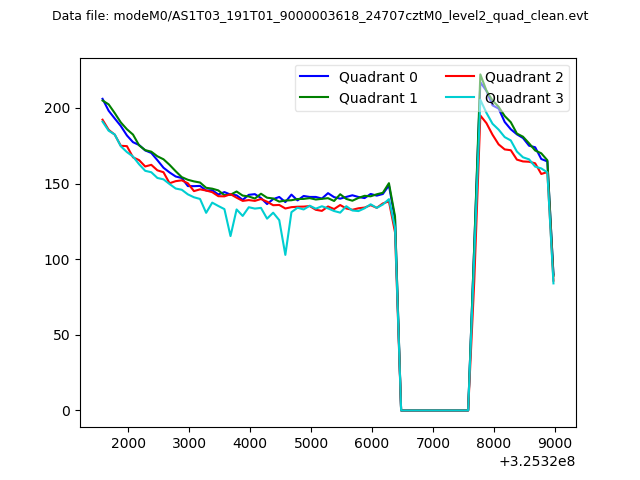 |
|
| Module-wise count rates for Quadrant A Data is divided into 100 sec bins |
 |
 |
| Module-wise count rates for Quadrant B Data is divided into 100 sec bins |
 |
 |
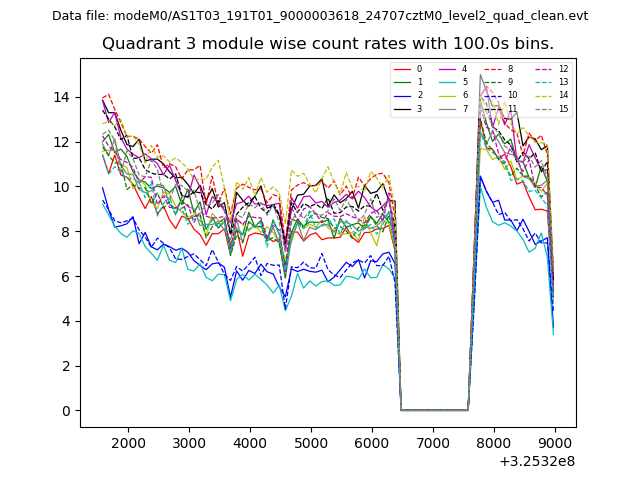
| Module-wise count rates for Quadrant C Data is divided into 100 sec bins |
 |
 |
| Module-wise count rates for Quadrant D Data is divided into 100 sec bins |
 |
 |
| Parameter | Plot |
|---|---|
| CZT HV Monitor |  |
| D_VDD | 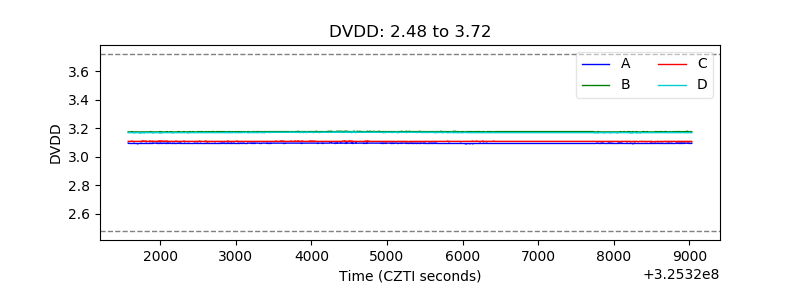 |
| Temperature 1 | 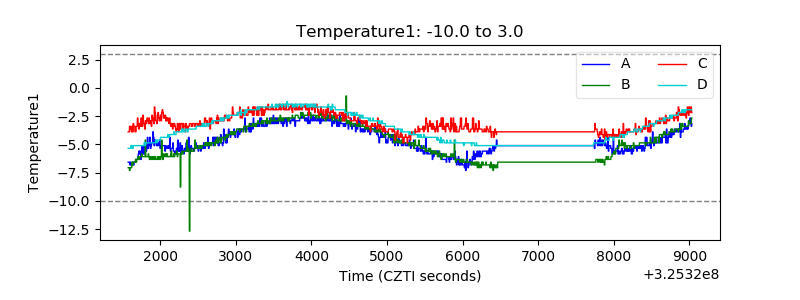 |
| Veto HV Monitor | 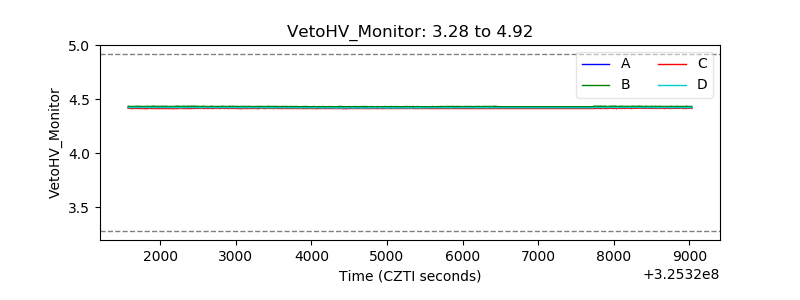 |
| Veto LLD | 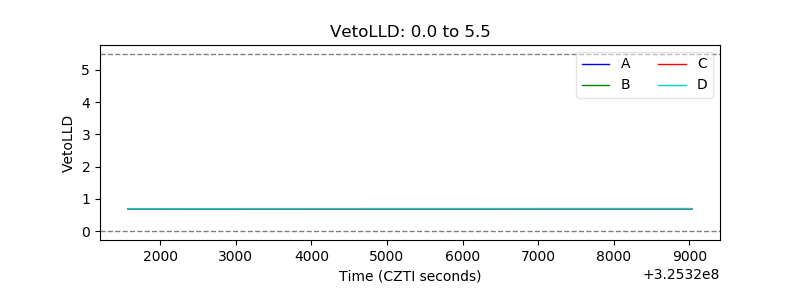 |
| Alpha Counter | 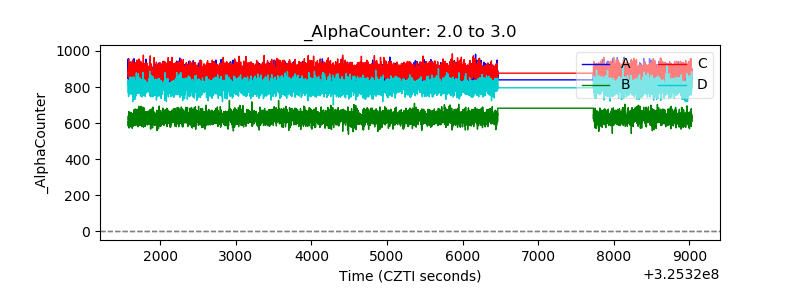 |
| _CPM_Rate | 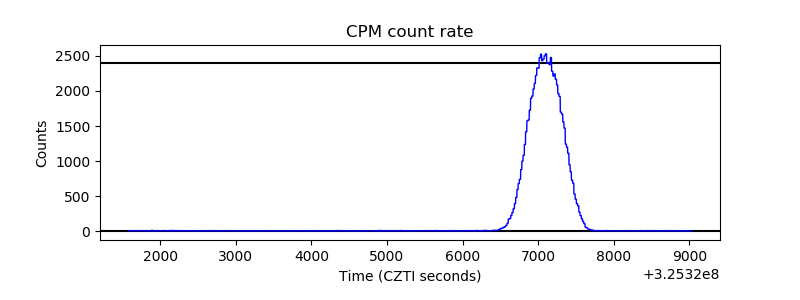 |
| CZT Counter | 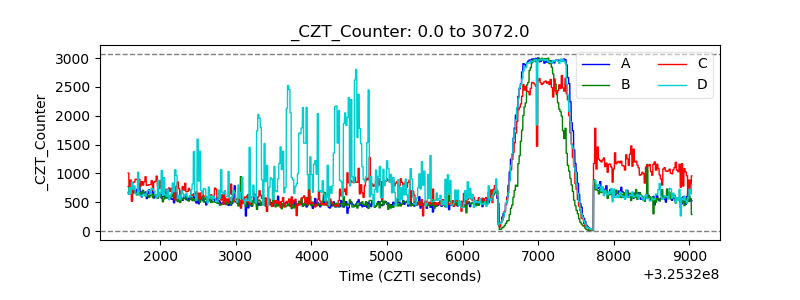 |
| +2.5 Volts monitor | 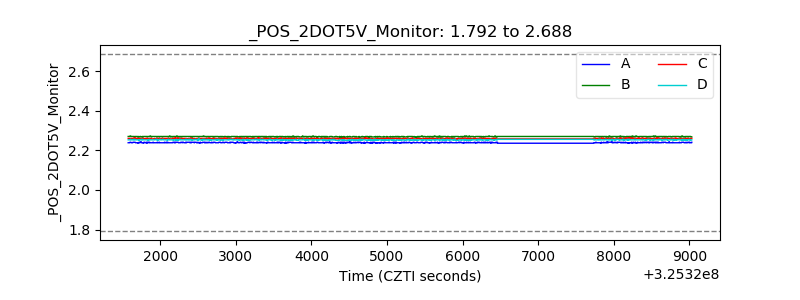 |
| +5 Volts monitor |  |
| _ROLL_ROT | 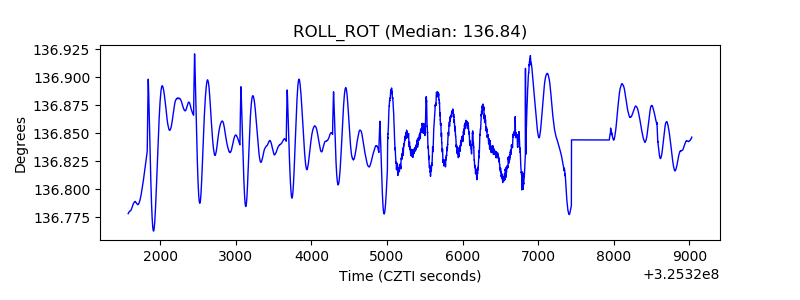 |
| _Roll_DEC | 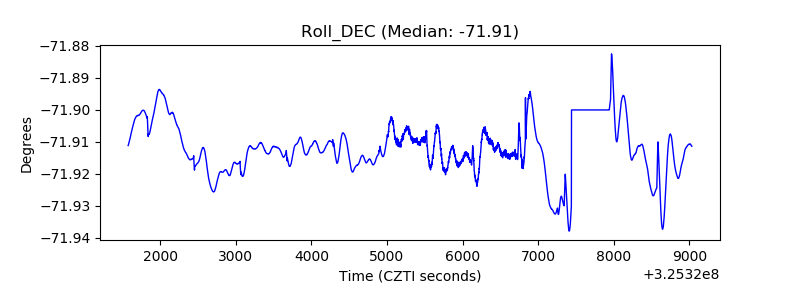 |
| _Roll_RA | 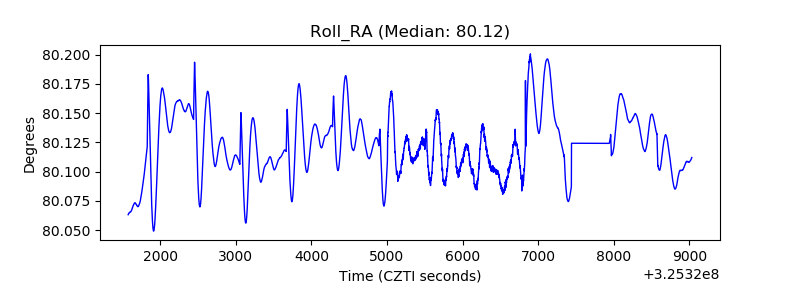 |
| Veto Counter |  |