| Param | Original file | Final file |
|---|---|---|
| Filename | modeM0/AS1T03_191T01_9000003618_24708cztM0_level2.evt | modeM0/AS1T03_191T01_9000003618_24708cztM0_level2_quad_clean.evt |
| Size (bytes) | 630,576,000 | 144,564,480 |
| Size | 601.4 MB | 137.9 MB |
| Events in quadrant A | 3,354,744 | 1,023,518 |
| Events in quadrant B | 3,426,015 | 1,022,715 |
| Events in quadrant C | 6,861,907 | 935,612 |
| Events in quadrant D | 5,027,135 | 955,252 |
| Mode M9 | |||
|---|---|---|---|
| Quadrant | BADHDUFLAG | Total packets | Discarded packets |
| A | 0 | 13 | 0 |
| B | 0 | 13 | 0 |
| C | 0 | 13 | 0 |
| D | 0 | 13 | 0 |
| Mode M0 | |||
|---|---|---|---|
| Quadrant | BADHDUFLAG | Total packets | Discarded packets |
| A | 0 | 13947 | 2 |
| B | 0 | 14218 | 1 |
| C | 0 | 24858 | 1 |
| D | 0 | 19399 | 1 |
| Mode SS | |||
|---|---|---|---|
| Quadrant | BADHDUFLAG | Total packets | Discarded packets |
| A | 0 | 128 | 0 |
| B | 0 | 128 | 0 |
| C | 0 | 128 | 0 |
| D | 0 | 128 | 0 |
| Quadrant | Total seconds | Saturated seconds | Saturation percentage |
|---|---|---|---|
| A | 6329 | 88 | 1.390425% |
| B | 6329 | 74 | 1.169221% |
| C | 6329 | 400 | 6.320114% |
| D | 6329 | 303 | 4.787486% |
Noise dominated data is calculated using 1-second bins in cleaned event files. If a bin has >2000 counts, and if more than 50% of those come from <1% of pixels, then it is considered to be noise-dominated and hence unusable.
| Quadrant | # 1 sec bins | Bins with >0 counts | Bins with >2000 counts | High rate bins dominated by noise | Noise dominated (total time) | Noise dominated (detector-on time) | Marked lightcurve |
|---|---|---|---|---|---|---|---|
| A | 7624 | 6329 | 0 | 0 | 0.00% | 0.00% | 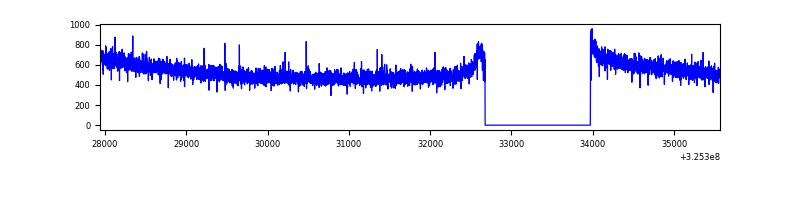 |
| B | 7624 | 6329 | 4 | 4 | 0.05% | 0.06% | 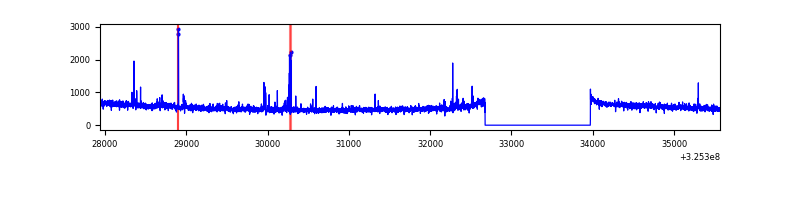 |
| C | 7624 | 6329 | 12 | 12 | 0.16% | 0.19% | 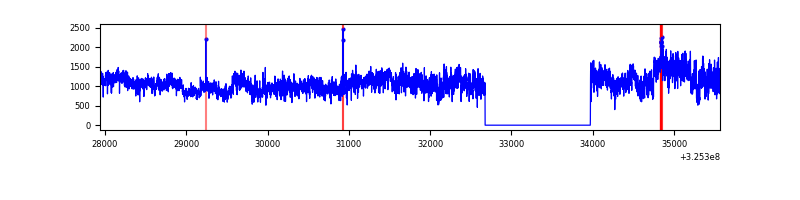 |
| D | 7624 | 6329 | 110 | 110 | 1.44% | 1.74% | 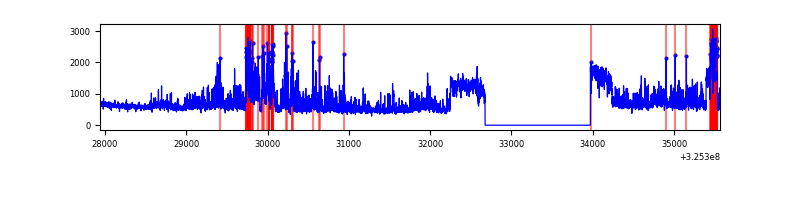 |
Top three noisy pixels from each quadrant. If the there are fewer than three noisy pixels in the level2.evt file, extra rows are filled as -1
| Pixel properties | Quadrant properties | ||||||
|---|---|---|---|---|---|---|---|
| Quadrant | DetID | PixID | Counts | Sigma | Mean | Median | Sigma |
| A | 13 | 254 | 10572 | 56.72 | 870 | 858 | 171.3 |
| A | 0 | 226 | 7678 | 39.82 | 870 | 858 | 171.3 |
| A | 3 | 137 | 6965 | 35.66 | 870 | 858 | 171.3 |
| B | 5 | 172 | 37832 | 236.44 | 846 | 828 | 156.5 |
| B | 0 | 230 | 29993 | 186.35 | 846 | 828 | 156.5 |
| B | 4 | 80 | 17929 | 109.27 | 846 | 828 | 156.5 |
| C | 7 | 247 | 3525800 | 19237.58 | 808 | 814 | 183.2 |
| C | 14 | 238 | 130055 | 705.33 | 808 | 814 | 183.2 |
| C | 2 | 16 | 26445 | 139.88 | 808 | 814 | 183.2 |
| D | 1 | 52 | 1510737 | 7499.26 | 837 | 815 | 201.3 |
| D | 12 | 233 | 179944 | 889.67 | 837 | 815 | 201.3 |
| D | 8 | 195 | 176756 | 873.84 | 837 | 815 | 201.3 |
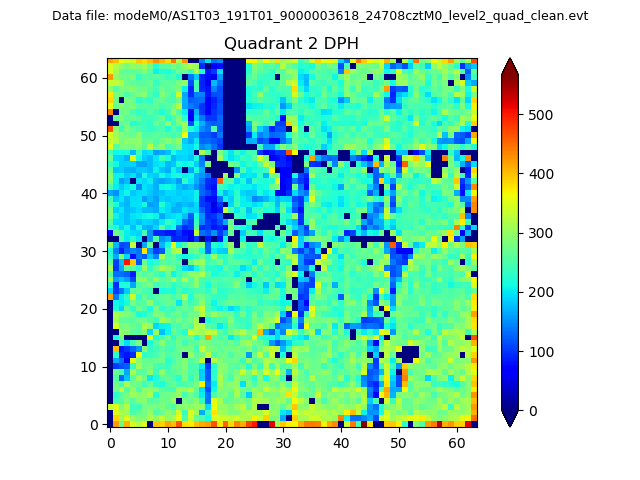
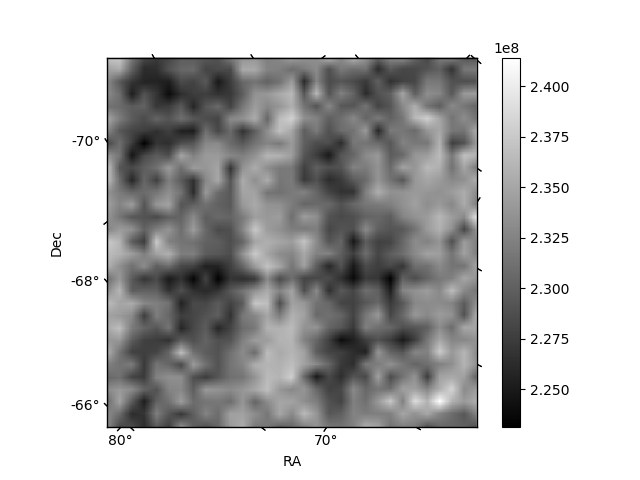
Histogram calculated using DETX and DETY for each event in the final _common_clean file
| Quadrant A | 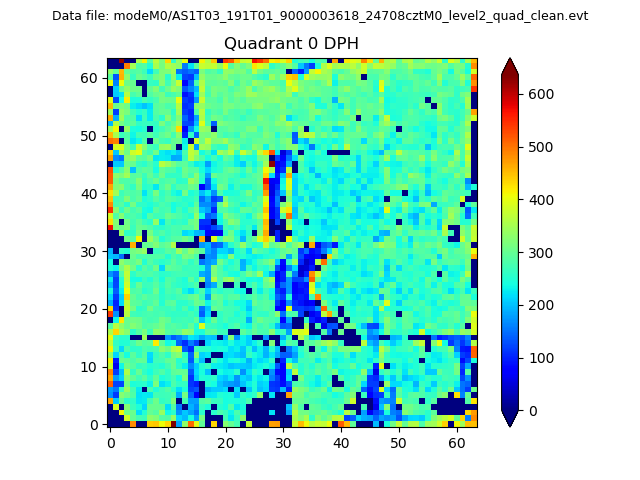 |
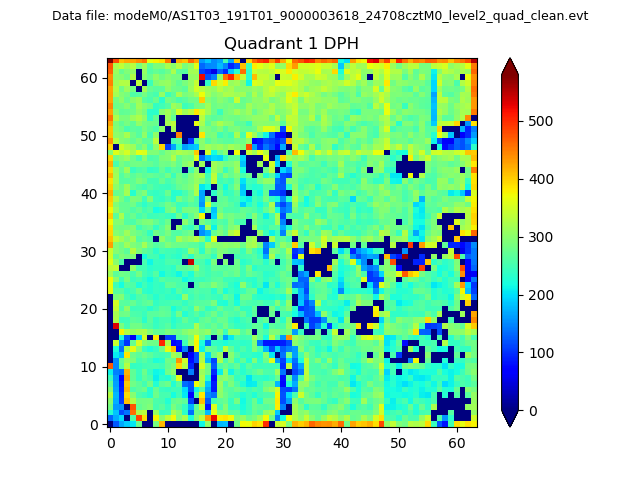 |
Quadrant B |
|---|---|---|---|
| Quadrant D | 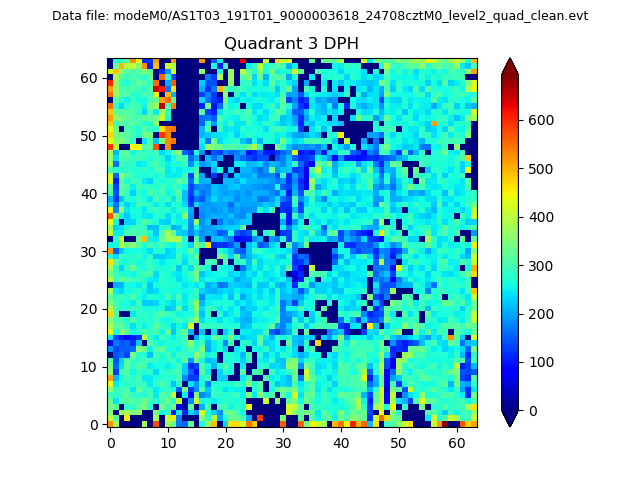 |
 |
Quadrant C |
| Plot type | Count rate plots | Images |
|---|---|---|
| Comparison with Poisson distribution Blue bars denote a histogram of data divided into 1 sec bins. Red curve is a Poisson curve with rate = median count rate of data. |
 |
 |
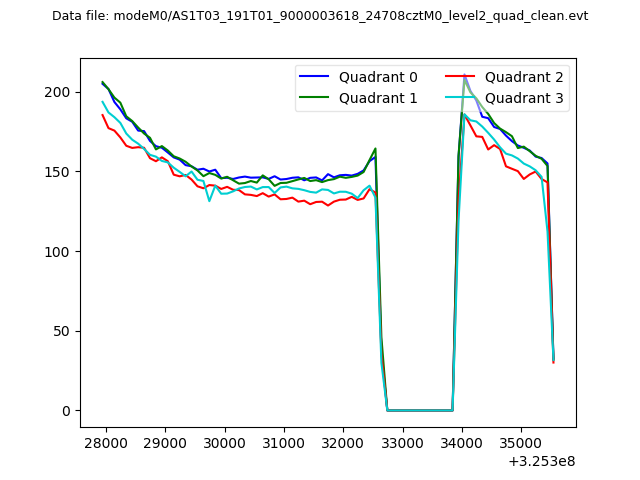
| Quadrant-wise count rates Data is divided into 100 sec bins |
 |
|
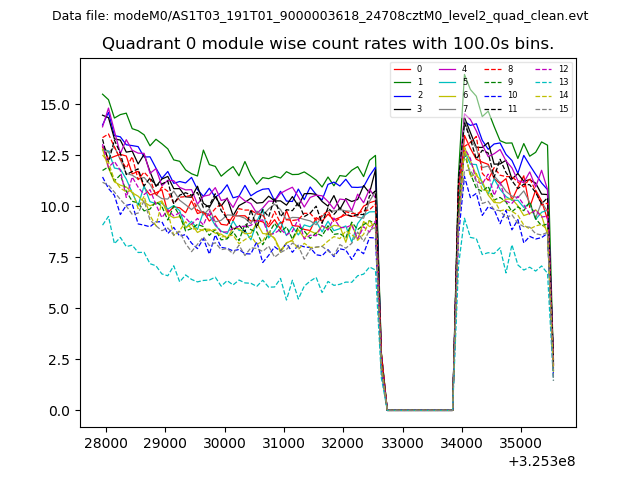
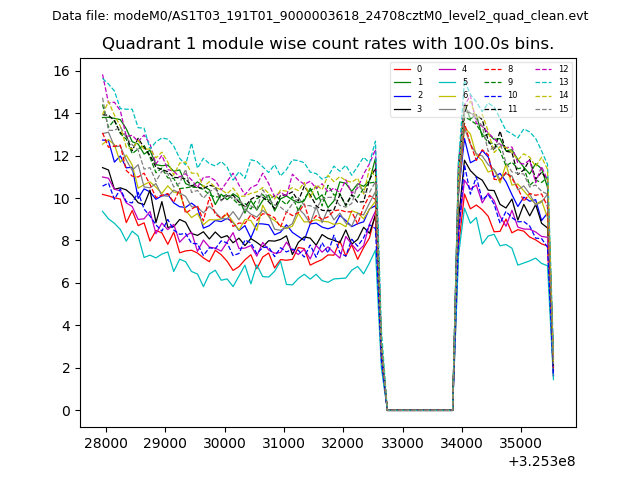
| Module-wise count rates for Quadrant A Data is divided into 100 sec bins |
 |
 |
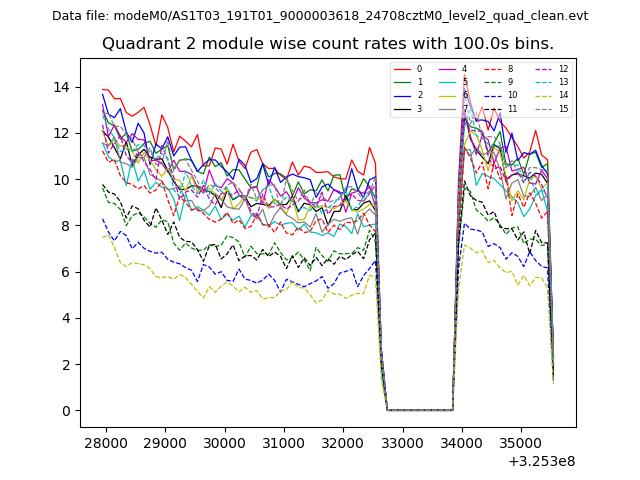
| Module-wise count rates for Quadrant B Data is divided into 100 sec bins |
 |
 |
| Module-wise count rates for Quadrant C Data is divided into 100 sec bins |
 |
 |
| Module-wise count rates for Quadrant D Data is divided into 100 sec bins |
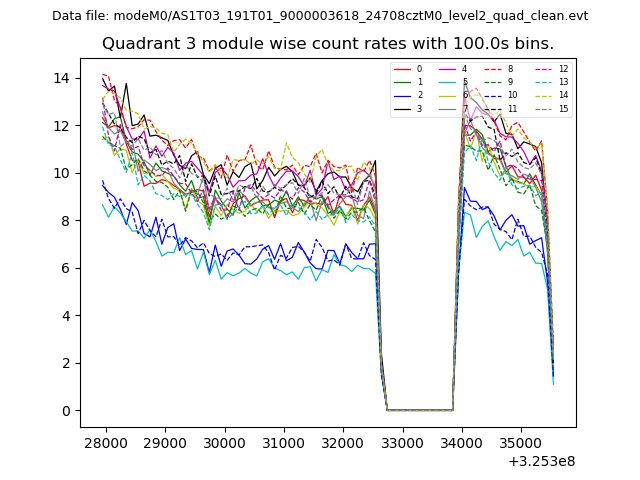 |
 |
| Parameter | Plot |
|---|---|
| CZT HV Monitor | 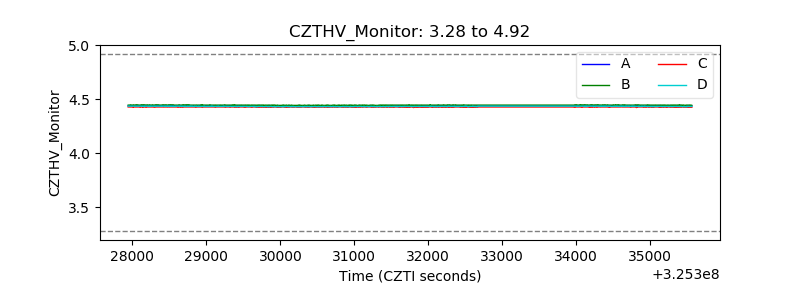 |
| D_VDD |  |
| Temperature 1 | 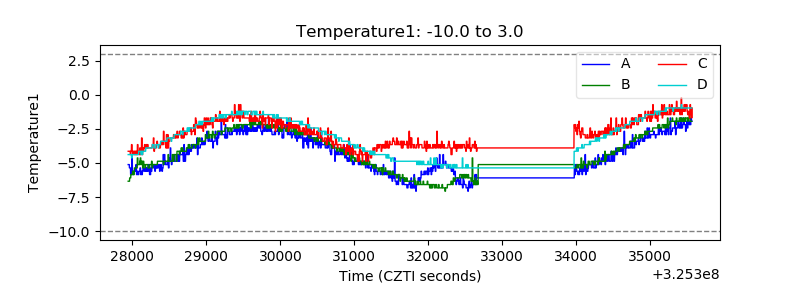 |
| Veto HV Monitor | 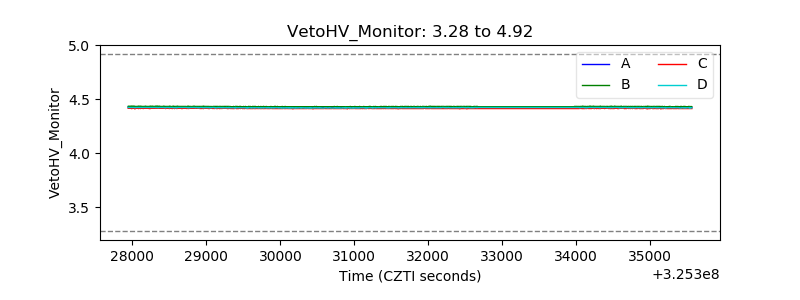 |
| Veto LLD | 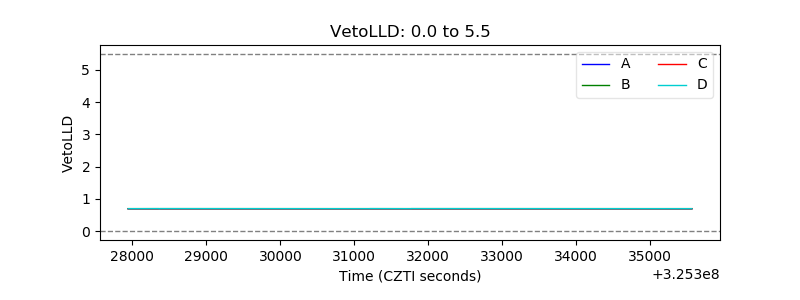 |
| Alpha Counter | 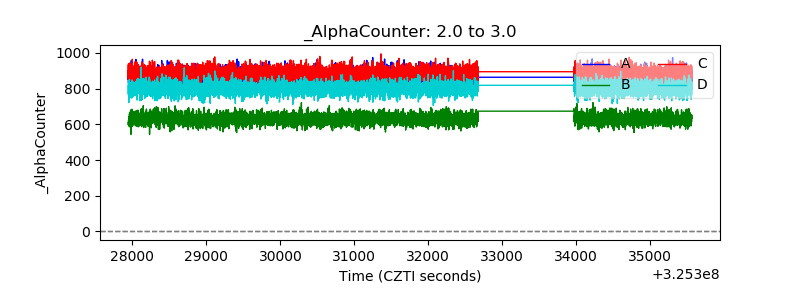 |
| _CPM_Rate | 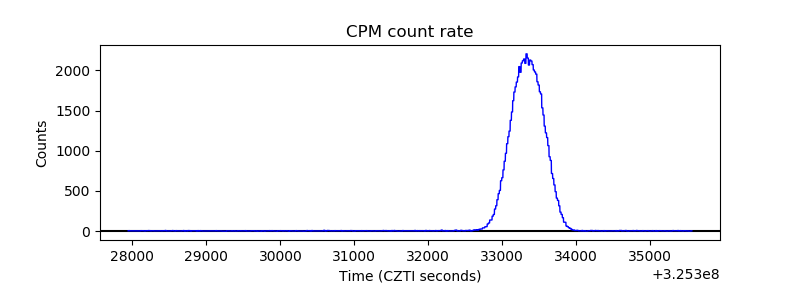 |
| CZT Counter | 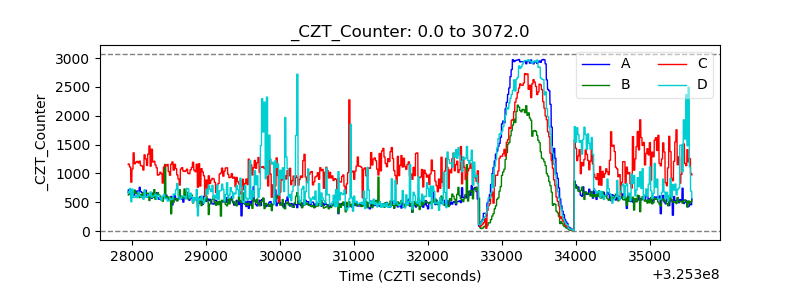 |
| +2.5 Volts monitor |  |
| +5 Volts monitor |  |
| _ROLL_ROT | 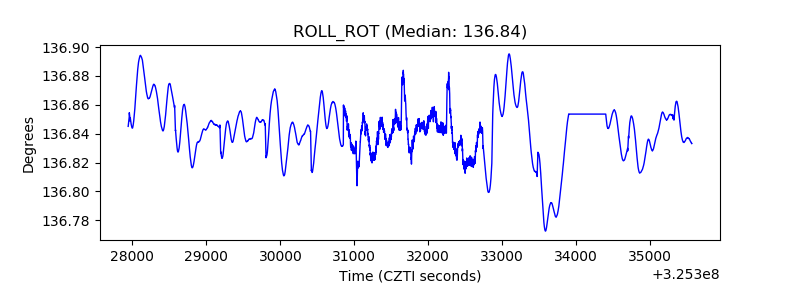 |
| _Roll_DEC | 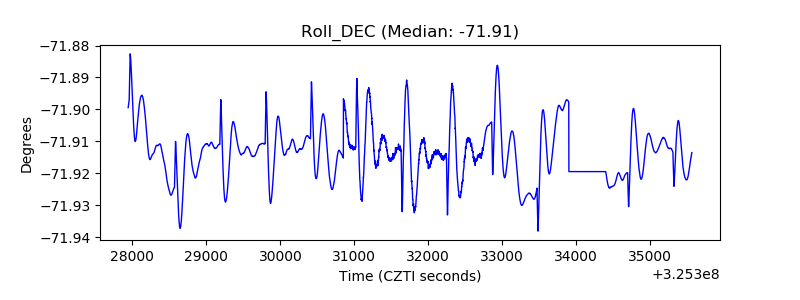 |
| _Roll_RA | 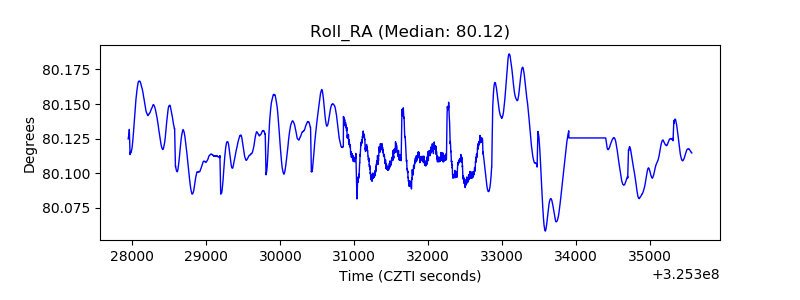 |
| Veto Counter | 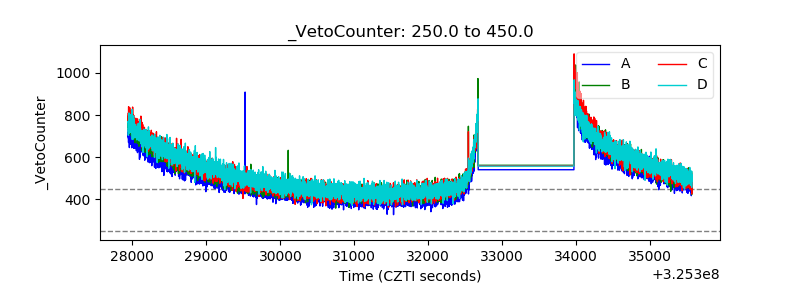 |